Data Challenges/icons/appstore.png

Techniques To Overcome Issues In Cloud Service Xaas Implementation Guidelines PDF
Following slide presents major techniques to overcome complexities faced by businesses while implementing everything as a service model. Major issues relate to complex data sequencing, lack of precise data, handling a diverse set of data, etc. Presenting Techniques To Overcome Issues In Cloud Service Xaas Implementation Guidelines PDF to dispense important information. This template comprises four stages. It also presents valuable insights into the topics including Complex Data Sequencing, Lack Precise Data, Handling Diverse Set Data. This is a completely customizable PowerPoint theme that can be put to use immediately. So, download it and address the topic impactfully.

Key Practices To Determine Origins Of Revenue Loss Microsoft PDF
The given slide illustrates some key practices to identify the sources of revenue leak at early stage. It includes data mining, unusual variations, follow ups, external party data sharing etc. Persuade your audience using this Data Mining, Unusual Variations, External Party Data Sharing. This PPT design covers four stages, thus making it a great tool to use. It also caters to a variety of topics including Data Mining, Unusual Variations, External Party Data Sharing. Download this PPT design now to present a convincing pitch that not only emphasizes the topic but also showcases your presentation skills.

Evaluation Matrix To Determine Employee Capability Level Ppt PowerPoint Presentation Model Format Ideas PDF
The following slide exhibits assessment matrix model which can be used by companies in order to determine employee competency level. Business acumen, data analysis, advance data analytics, data visualization, HR knowledge are some of the key competencies mentioned in the slide. Showcasing this set of slides titled Evaluation Matrix To Determine Employee Capability Level Ppt PowerPoint Presentation Model Format Ideas PDF. The topics addressed in these templates are Advanced Data Analytics, Data Visualization, Data Warehousing. All the content presented in this PPT design is completely editable. Download it and make adjustments in color, background, font etc. as per your unique business setting.

Market Research Study Template Ppt Sample
This is a market research study template ppt sample. This is a four stage process. The stages in this process are market size estimation, market crack down and data triangulation, market forecast model, key data points.

Statistical Assessment Example Ppt Background Images
This is a statistical assessment example ppt background images. This is a five stage process. The stages in this process are data element, data field, indexed collection, keved collection, bean collection, statistical assessment.
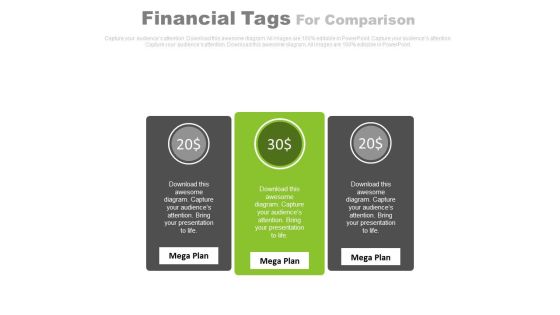
Three Text Tags Compare Chart Powerpoint Slides
This PowerPoint template has been designed with text tags and percentage data. You may download this PPT slide to display data comparison and analysis. Add this slide to your presentation and impress your superiors.

Information Technology For Crm Ppt Ideas
This is a information technology for crm ppt ideas. This is a seven stage process. The stages in this process are cost reduction, strict confidentiality, environment friendly, instant data capture, instant data analysis, reduce input error, increase satisfaction, information technology.
Three Text Boxes With Percentage Values And Icons Powerpoint Slides
This PowerPoint template has been designed with text boxes and percentage data. You may download this PPT slide to display data comparison and analysis. Add this slide to your presentation and impress your superiors.
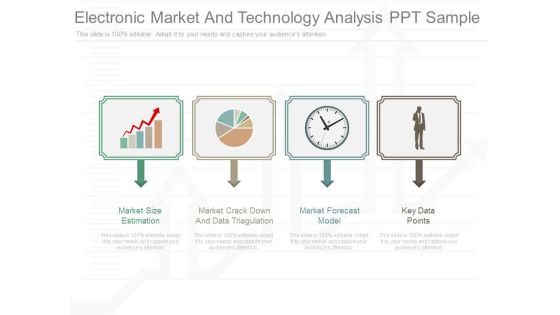
Electronic Market And Technology Analysis Ppt Sample
This is a electrnic market and technology analysis ppt sample. This is a four stage process. The stages in this process are market size estimation, market crack down and data triagulation, market forecast model, key data points.
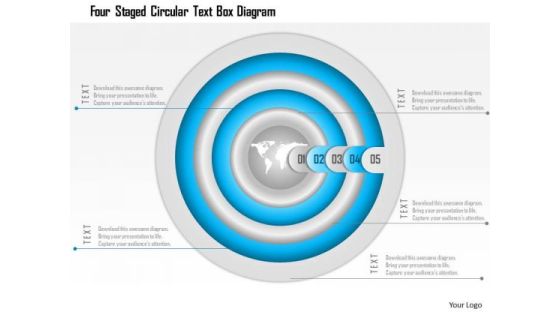
Business Diagram Four Staged Circular Text Box Diagram Presentation Template
This Power point template has been crafted with graphic of four staged circular text boxes. These text boxes can be used for data representation. Use this PPT slide for business data related presentation.
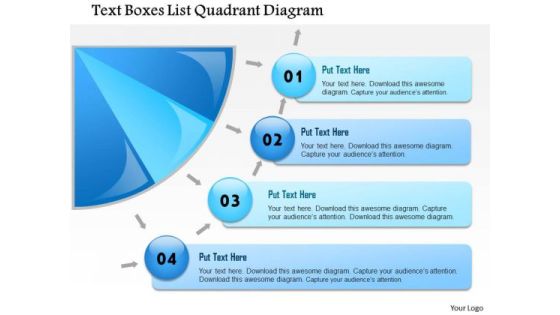
Business Framework Text Boxes List Quadrant Diagram PowerPoint Presentation
A semi circle diagram with text boxes are used to design this power point template slide. This PPT slide contains the concept of displaying business data. This PPT slide may be used for business data representations.

Business Diagram Six Staged Vertical Text Box Diagram Presentation Template
Six staged vertical text box diagram has been used to design this Power Point template slide. This PPT slide contains the concept of business data representation. Use this PPT slide for business data related presentations.

Business Diagram Three Interconnected Circles With Text Boxes Presentation Template
Three interconnected circles and text boxes are used to design this business diagram. This slide contains the concept of data and process flow. Use this amazing slide for your business and data related presentations.
Business Diagram Five Staged Multiple Icons Text Boxes Presentation Template
Five staged multiple icons style text boxes has been used to design this power point template. This PPT contains the concept of data representation. Display all data flow related topics in your business presentation with this PPT.

Business Diagram Five Staged Vertical Ribbon Text Boxes Presentation Template
Five staged vertical ribbon text boxes has been used to craft this power point template. This PPT contains the concept of data representation. Use this PPT for your data related topics in any business and marketing presentation.

Business Diagram Text Boxes Displaying Four Options Presentation Template
Four staged envelop style text boxes has been used to craft this power point template. This PPT contains the concept of data representation. This PPT can be used for your data related topics in any business and marketing presentation.
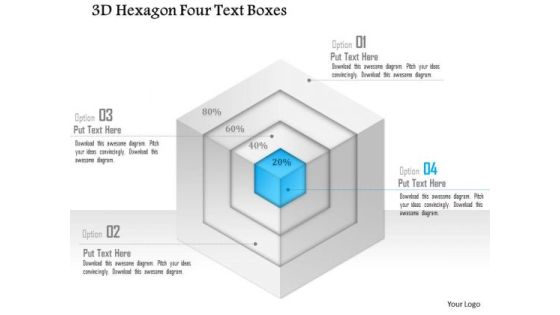
Business Diagram 3d Hexagon Four Text Boxes PowerPoint Template
Graphic of 3d hexagon diagram and text boxes are used to craft this power point template slide. This PPT slide contains the concept of data representation. Use this PPT for your business and marketing data flow related presentations.

Business Diagram Five Staged Torn Paper Text Boxes PowerPoint Template
Five staged torn paper design text box diagram has been used to craft this power point template slide. This PPT slide contains the concept of data representation. Use this PPT for your business and marketing data related presentations.
Business Diagram Four Staged Torn Paper Text Boxes PowerPoint Template
Four staged torn paper style text boxes are used to craft this power point template. This PPT contains the concept of data representation for business process. Use this PPT and build an innovative presentation for data based topics.
Business Diagram Three Colorful Balloons With Text PowerPoint Template
Three colorful balloons with text box has been used to craft this power point template slide. This PPt slide contains the concept of business data presentation. Use this PPT slide and build quality presentation on data related presentations.
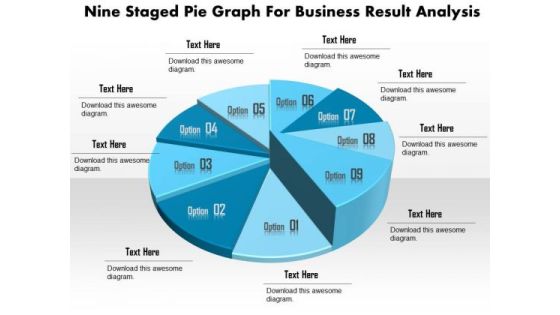
Business Diagram Nine Staged Pie Graph For Business Result Analysis Presentation Template
This business slide displays nine staged pie chart. This diagram is a data visualization tool that gives you a simple way to present statistical information. This slide helps your audience examine and interpret the data you present.

Business Diagram Seven Staged Pie Graph For Business Analysis Presentation Template
This business slide displays seven staged pie chart. This diagram is a data visualization tool that gives you a simple way to present statistical information. This slide helps your audience examine and interpret the data you present.

Business Diagram Six Staged 3d Pie Graph For Result Analysis Presentation Template
This business slide displays six staged pie chart. This diagram is a data visualization tool that gives you a simple way to present statistical information. This slide helps your audience examine and interpret the data you present.
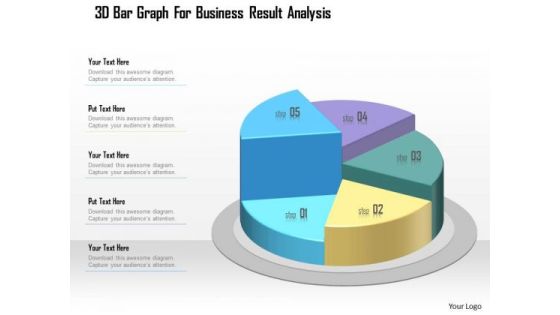
Business Diagram 3d Bar Graph For Business Result Analysis Presentation Template
This business slide displays five staged pie chart. This diagram is a data visualization tool that gives you a simple way to present statistical information. This slide helps your audience examine and interpret the data you present.
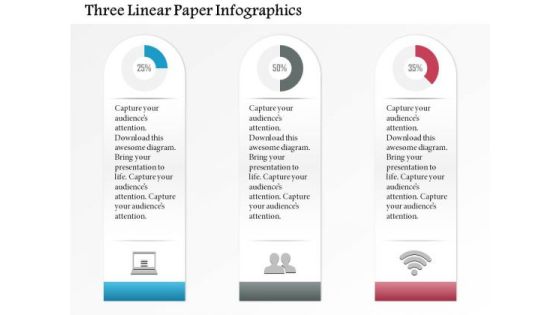
Business Diagram Three Linear Paper Infographics Presentation Template
Three linear paper info graphics has been used to design this power point template slide. This PPT slide contains the concept of data analysis and business data flow. Use this PPT slide for your business and marketing related presentations.

Business Diagram 3d Battery Connected With Bulb For Idea Generation PowerPoint Slide
This business slide displays battery icon connected with bulb. This diagram is a data visualization tool that gives you a simple way to present statistical information. This slide helps your audience examine and interpret the data you present.

Money Growth Chart On Laptop With Mouse Powerpoint Template
This business slide displays money growth chart on laptop with mouse. This diagram is a data visualization tool that gives you a simple way to present statistical information. This slide helps your audience examine and interpret the data you present.
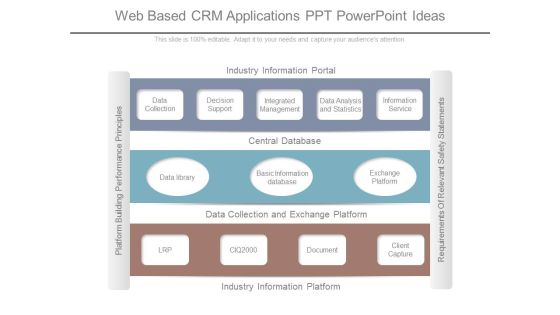
Web Based Crm Applications Ppt Powerpoint Ideas
This is a web based crm applications ppt powerpoint ideas. This is a three stage process. The stages in this process are industry information portal, data collection, decision support, integrated management, data analysis and statistics, information service, central database.
Business Diagram Three Staged Sequential Infographics With Icons PowerPoint Template
Three staged sequential info graphic with icons has been used to design this power point template. This PPT contains the concept of data flow. Use this PPT diagram to show marketing and business data in any presentation.

Business Diagram Four Staged Circular Text Boxes With Globe Presentation Template
Four staged circular text boxes with globe graphic are used to craft this power point template. This PPT contains the concept of global business data flow. Use this PPT for your data related topics in business presentation.

Predictive Analytics Steps Ppt PowerPoint Presentation Styles Guidelines
This is a predictive analytics steps ppt powerpoint presentation styles guidelines. This is a six stage process. The stages in this process are define project, data collection, data analysis, statistics, stages, benefits.

Business Diagram Infographics Design With Six Options Presentation Template
Graphic of six staged info graphics has been used to design this power point template. This PPT diagram contains the concept of data flow and representation. Use this PPT for data technology related presentations.
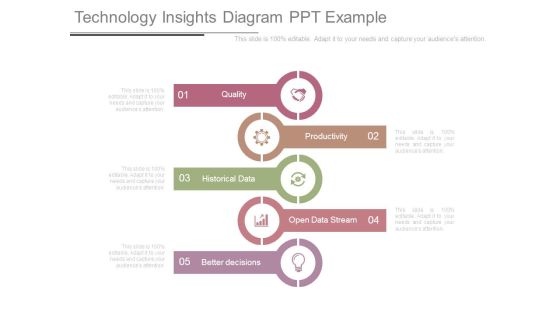
Technology Insights Diagram Ppt Example
This is a technology insights diagram ppt example. This is a five stage process. The stages in this process are quality, productivity, historical data, open data stream, better decisions.
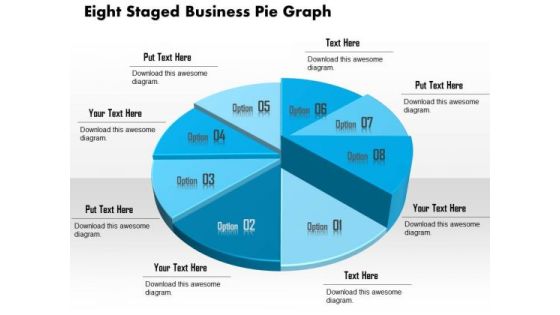
Business Diagram Eight Staged Business Pie Graph Presentation Template
This business slide displays eight staged pie chart. This diagram is a data visualization tool that gives you a simple way to present statistical information. This slide helps your audience examine and interpret the data you present.

Circular Diagram Of Agile Software Development Powerpoint Templates
This PowerPoint template has been designed with circular diagram This diagram is a data visualization tool that gives you a simple way to present statistical information. This slide helps your audience examine and interpret the data you present.
Six Unidirectional Arrows With Business Icons Process Flow Powerpoint Templates
This business slide displays spiral road map design with icons. This diagram is a data visualization tool that gives you a simple way to present statistical information. This slide helps your audience examine and interpret the data you present.

Technological Process Business Template Presentation Powerpoint Example
This is a technological process business template presentation powerpoint example. This is a eight stage process. The stages in this process are client website, training, webinars, coaching, modelling, data preparation, data understanding, business understanding.
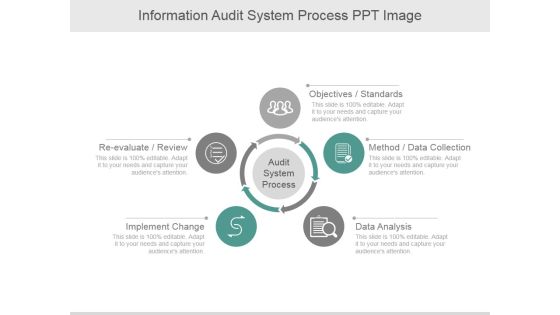
Information Audit System Process Ppt PowerPoint Presentation Ideas
This is a information audit system process ppt powerpoint presentation ideas. This is a five stage process. The stages in this process are objectives standards, method data collection, data analysis, implement change, re evaluate review.
Business Diagram Infographics Design With Four Options Presentation Template
Four staged info graphics has been used to design this power point template. This PPT diagram contains the concept of data flow. Use this PPT for business and marketing data related topics in any presentation.

Business Diagram Infographics Design With Three Options Presentation Template
Three staged info graphics has been used to craft this power point template diagram. This PPT diagram contains the concept of data flow and storage. Use this PPT for business and data related presentations.

Business Diagram Five Staged Infographics With Stand Design PowerPoint Template
Five staged info graphics with stand has been used to craft this power point template. This PPT contains the concept of data flow. Use this PPT slide for your sales and business data related presentations.
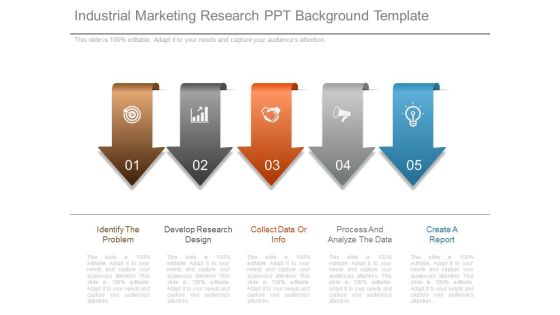
Industrial Marketing Research Ppt Background Template
This is a industrial marketing research ppt background template. This is a five stage process. The stages in this process are identify the problem, develop research design, collect data or info, process and analyze the data, create a report.

Stock Photo Laptops Connected With Cloud Technology PowerPoint Slide
Graphic of multiple laptops and cloud are used to decorate this power point template. This image template contains the concept of data storage and transfer. Use this PPT for all your data technology and cloud computing related presentations.
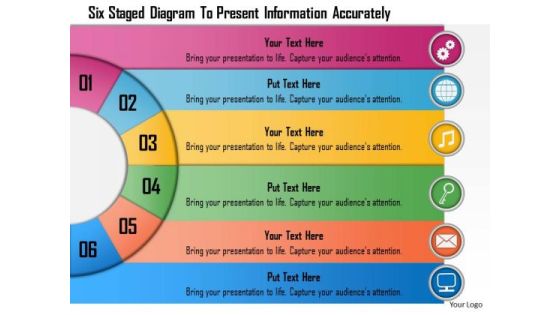
Business Diagram Six Staged Diagram To Present Information Accurately Presentation Template
Six staged semicircular text boxes are used to craft this power point template. This PPT contains the concept of data representation. Use this PPT for your business and sales related data representation in any presentation.

Business Diagram Six Staged Diagram To Present Relevant Information Presentation Template
Six staged colorful ribbon text boxes has been used to craft this power point template. This PPT contains the concept of data representation. This PPT is suitable for your data related topics in any business and marketing presentation.

Market Research Analysis Template Presentation Powerpoint
This is a market research analysis template presentation powerpoint. This is a five stage process. The stages in this process are market research data analysis, web survey analysis, product research, data processing, brand valuation, market research analysis.

Reducing Cost Dollar Sign With Cloud On Mobile Ppt Powerpoint Presentation Styles File Formats
This is a reducing cost dollar sign with cloud on mobile ppt powerpoint presentation styles file formats. This is a four stage process. The stages in this process are data analysis, data science, information science.
Business Diagram Six Steps Infographics With Icons Presntation Template
This power point template has been crafted with graphic of six staged text boxes. This PPT diagram contains the concept of data and text representation. Use this PPT for your business and marketing data related presentations.

Business Diagram Three Triangles To Present Business Information Presentation Template
Three interconnected triangles are used to design this business diagram. This slide contains the concept of data and process flow. Use this slide for your business and data related presentations.

Advanced Email Metrics And Analysis Services Diagram Slide
This is a advanced email metrics and analysis services diagram slide. This is a four stage process. The stages in this process are analytics data warehouse, data mining, financial modeling.
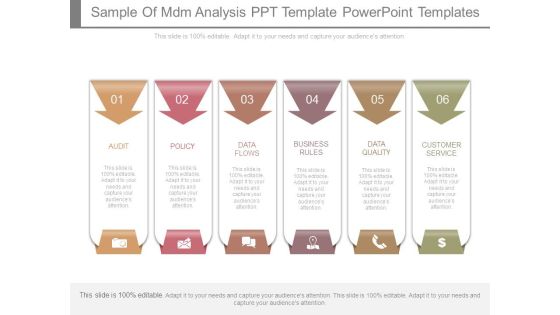
Sample Of Mdm Analysis Ppt Template Powerpoint Templates
This is a sample of mdm analysis ppt template powerpoint templates. This is a six stage process. The stages in this process are audit, policy, data flows, business rules, data quality, customer service.

Cost Reduction Analysis Bar Chart Ppt Powerpoint Presentation File Graphics Design
This is a cost reduction analysis bar chart ppt powerpoint presentation file graphics design. This is a five stage process. The stages in this process are data analysis, data science, information science.

Business Diagram Six Staged Diagram With Trophy For Success Presentation Template
Six staged colorful ribbon text boxes has been used to craft this power point template. This PPT contains the concept of data representation. This PPT is suitable for your data related topics in any business and marketing presentation.

Stock Photo Computer Server And Colorful Books Pwerpoint Slide
This business image has been crafted with computer server and colorful books. This image displays the concept of data storage and data communication. This image is useful for technical and education related presentation.
Stock Photo Stack Of Books With Computer Server Pwerpoint Slide
This business image has been crafted with computer server and stack of books. This image displays the concept of data storage and data communication. This image is useful for technical and education related presentation.

Business Diagram Design Of Five Pen Drives Presentation Template
Graphic of five colored pen drives has been used to craft this power point template. This PPT contains the concept of data storage. Use this PPT for data technology related presentations.

1 Icon Of Database Or Disk Storage For A Network File System Or Storage Area Network Ppt Slides
This Powerpoint image slide has been designed with graphic of database icon. This PPT slide contains network file system and storage area network to show data storage. Use this PPT slide in your data storage related presentation.

Database Administration And Automation Ppt Powerpoint Presentation Portfolio Images
This is a database administration and automation ppt powerpoint presentation portfolio images. This is a six stage process. The stages in this process are data management, data centre, storage system.

Cloud Computing Files Storage Vector Icon Ppt Powerpoint Presentation Ideas Pictures
This is a cloud computing files storage vector icon ppt powerpoint presentation ideas pictures. This is a one stage process. The stages in this process are data management icon, big data icon.

Computer Screen Monitor Analytics Vector Icon Ppt Powerpoint Presentation Inspiration Grid
This is a computer screen monitor analytics vector icon ppt powerpoint presentation inspiration grid. This is a one stage process. The stages in this process are data management icon, big data icon.
Sales Opportunity Tracking And Management Ppt Slides
This is a sales opportunity tracking and management ppt slides. This is a eight stage process. The stages in this process are organization data determination, territory determination, data management, text determination, content management, status management, pricing, partner determination, sales transactions.
Business Diagram Four Steps With Icons Presentation Template
This power point template diagram has been crafted with graphic of four staged text boxes. This PPT contains the concept of text and data representation. Use this PPT for your business and data related presentations.

Stock Photo Blue Colored Pen Drive With Combination Lock PowerPoint Slide
Graphic of blue colored pen drive and combination lock has been used to design this power point template. This PPT contains the concept of data security and data technology. Use this PPT for your business and marketing related presentations.
Business Diagram Connected Bulbs With Icons Presentation Template
This power point template slide has been crafted with graphic of bulbs and switchboards. This PPT contains the concept of data technology and idea generation. Use this PPT slide for business and data related presentations.

Audit System Process Ppt PowerPoint Presentation Good
This is a audit system process ppt powerpoint presentation good. This is a five stage process. The stages in this process are re evaluate review, objectives standards, implement change, method data collection, data analysis.
Stock Photo 3d Folders With Key And Lock PowerPoint Slide
Concept of data security has been displayed in this power point image template with suitable graphics. This image contains the graphics of 3d folders and key with lock. Use this PPT image for your data related presentations.
Business Diagram Five Icons With Circle Diagram Presentation Template
Five staged process flow diagram has been used to craft this power point template. This PPT diagram contains the concept of data and process flow .Use this PPT for business and data related presentations.
Business Diagram Four Icons With Circle Diagram Presentation Template
Four staged process flows has been used to design this power point template. This PPT diagram contains the concept of data flow. Use this PPT for business and marketing data related topics in any presentation.

Hr Business Intelligence Ppt Powerpoint Diagram
This is a hr business intelligence ppt powerpoint diagram. This is a one stage process. The stages in this process are back end data collection and integration tools, hr data mart, hr planning, recruitment, training skills, hr costing, knowledge management.

Computer Screen With Cloud Icon Ppt Powerpoint Presentation Infographics Display
This is a computer screen with cloud icon ppt powerpoint presentation infographics display. This is a three stage process. The stages in this process are data visualization icon, data management icon.
Visual Analytics Vector Icon Ppt Powerpoint Presentation Infographics Show
This is a visual analytics vector icon ppt powerpoint presentation infographics show. This is a three stage process. The stages in this process are data visualization icon, data management icon.
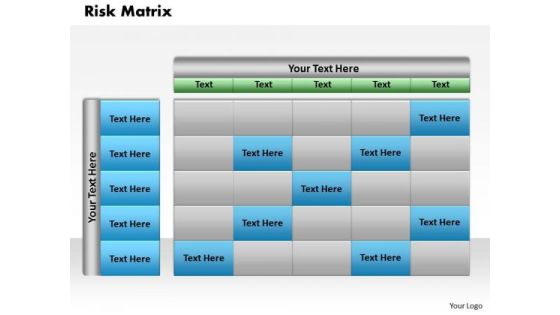
Business Framework Matrix PowerPoint Presentation
This business framework power point template has been designed with graphic of matrix. This two variable matrix can be used for data manipulation and analysis. Use this template to show business data analysis and create an impact on viewers.

Portfolio Revision Ppt PowerPoint Presentation Visual Aids Infographic Template
This is a portfolio revision ppt powerpoint presentation visual aids infographic template. This is a two stage process. The stages in this process are current portfolio, data analysis, new portfolio, data analysis.
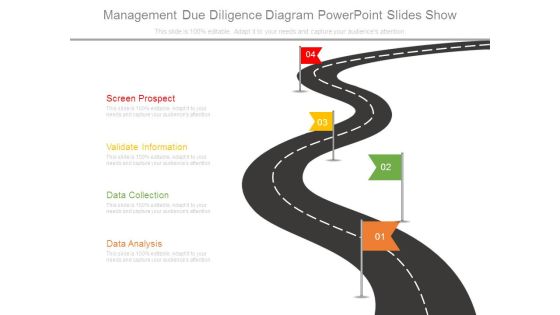
Management Due Diligence Diagram Powerpoint Slides Show
This is a management due diligence diagram powerpoint slides show. This is a four stage process. The stages in this process are screen prospect, validate information, data collection, data analysis.

Cost Reduction With Downward Arrow And Dollar Sign Ppt Powerpoint Presentation Infographics Templates
This is a cost reduction with downward arrow and dollar sign ppt powerpoint presentation infographics templates. This is a three stage process. The stages in this process are data analysis, data science, information science.
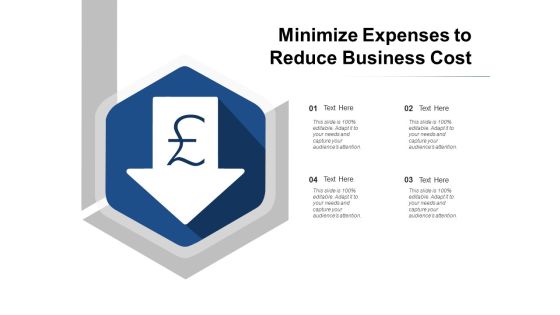
Minimize Expenses To Reduce Business Cost Ppt Powerpoint Presentation Inspiration Pictures
This is a minimize expenses to reduce business cost ppt powerpoint presentation inspiration pictures. This is a four stage process. The stages in this process are data analysis, data science, information science.
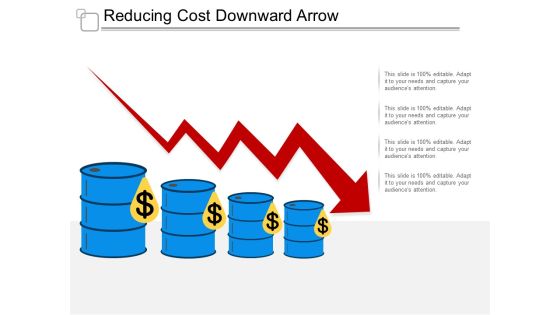
Reducing Cost Downward Arrow Ppt Powerpoint Presentation Outline Inspiration
This is a reducing cost downward arrow ppt powerpoint presentation outline inspiration. This is a four stage process. The stages in this process are data analysis, data science, information science.

Reducing Cost Vector Dollar Sign With Down Arrow Ppt Powerpoint Presentation Model Outline
This is a reducing cost vector dollar sign with down arrow ppt powerpoint presentation model outline. This is a four stage process. The stages in this process are data analysis, data science, information science.

Ways To Reduce Business Costs Ppt Powerpoint Presentation Portfolio Images
This is a ways to reduce business costs ppt powerpoint presentation portfolio images. This is a four stage process. The stages in this process are data analysis, data science, information science.

Business Diagram Secure Connections To The Public Cloud With Folders And Lock Ppt Slide
This technical slide has been designed with graphic of folders and cloud with lock. This PPT slide depicts the concept of secure connections. It focuses on the data safety in cloud technology. Use this diagram for data safety related presentations.
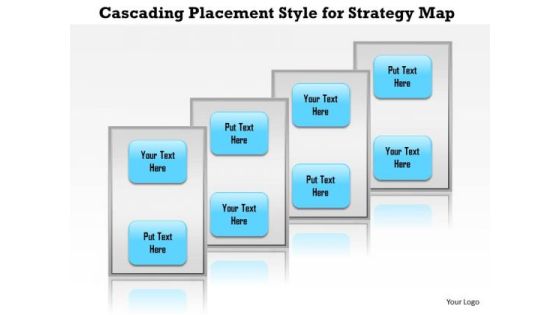
Business Framework Cascading Placement Style For Strategy Map PowerPoint Presentation
This exclusive Power point slide template has been crafted with graphic of two foot prints. This graphic contains the text boxes to display and highlight important data. Use this PPT slide for your business data representation
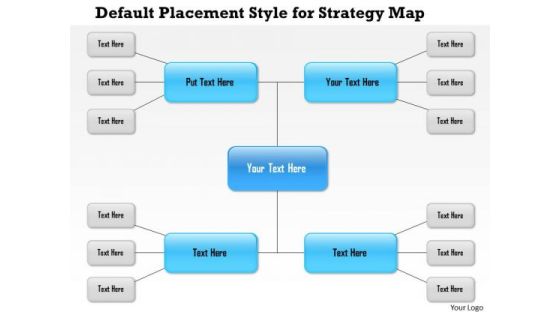
Business Framework Default Placement Style For Strategy Map PowerPoint Presentation
This power point template slide has been crafted with graphic of prism. In this slide prism is contain the ray of light style text boxes for data representation. Use this PPT for data insight process.
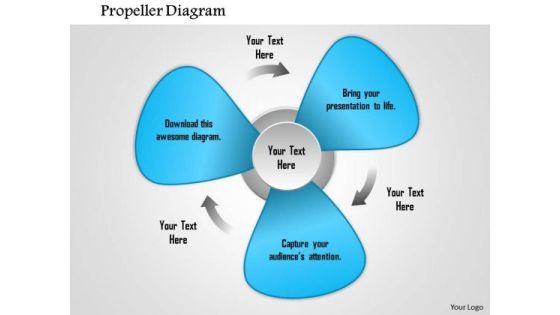
Business Framework Propeller Diagram For PowerPoint Presentation
A three staged text box diagram has been used to decorate this Power point template slide. This slide contains the propeller graphic diagram and display data. Use this PPT for data representation related topics.

Business Diagram Five Business Steps In Numeric Order Presentation Template
Five colored linear text boxes are used to design this power point template. This PPT contains the concept of data flow updation. Display any data in your business presentation with this unique PPT.

Business Diagram Five Steps In Concentric Circle Presentation Template
Five staged colorful circular text boxes in linear flow has been used to design this power point template. This PPT contains the concept of data representation. Use this PPT for your data related topics in any business or sales presentation.

Business Diagram Four Steps For Process Improvement Presentation Template
Graphic of four sequential text boxes are used to design this power point template. This PPT contains the concept of data flow in any process. Use this PPT for your data and process flow related topics in any presentation.

Business Diagram Linear Order Of Five Steps For Business Process Presentation Template
Five linear text boxes are used to design this power point template. This PPT contains the concept of data representation. Use this PPT for your data related topics in any presentation.

Business Diagram Pillars Displaying Three Options Presentation Template
Graphic of three colored pillars has been used to design this power point template diagram. This PPT contains the concept of text and data representation. Use this PPT diagram for your business data related topics.

Business Diagram Three Steps Process Diagram Presentation Template
Graphic of three colored pillars has been used to design this power point template diagram. This PPT contains the concept of text and data representation. Use this PPT diagram for your business data related topics.
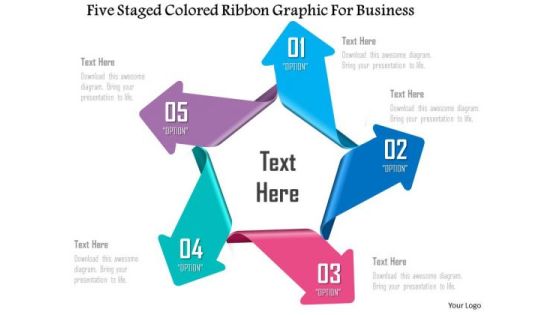
Business Diagram Five Staged Colored Ribbon Graphic For Business PowerPoint Template
Five staged colored ribbon text boxes are used to design this power point template. This PPT contains the concept of data representation. Use this PPT slide for your marketing and business data related presentations.
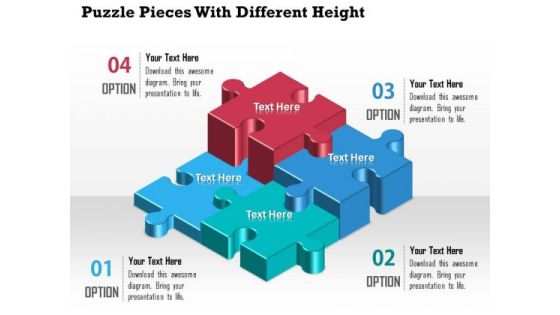
Business Diagram Puzzle Pieces With Different Height Presentation Template
A professional bar graph has been crafted with graphic of puzzles. All these puzzles are in different heights which shows the various levels of any data result representations. Use this diagram for your business result and data analysis related topics.
Business Diagram Globe With Colorful Arrows And Icons Presentation Template
This business diagram has been designed with graphic of globe with arrow and icons. Use our diagram slide to organize data and to display data analysis. This diagram is suitable for global business and marketing related presentations.

Research Meeting Powerpoint Slide Designs Download
This is a research meeting powerpoint slide designs download. This is a six stage process. The stages in this process are research meeting, sampling and questionnaire, strategy meeting, data collection, incentivising the respondents by client, data analysis and interpretation.
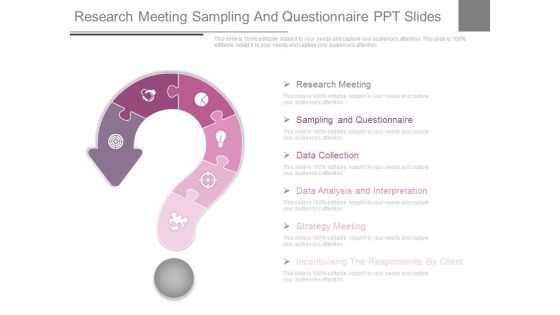
Research Meeting Sampling And Questionnaire Ppt Slides
This is a research meeting sampling and questionnaire ppt slides. This is a six stage process. The stages in this process are sampling and questionnaire, research meeting, data collection, data analysis and interpretation, strategy meeting, incentivising the respondents by client.
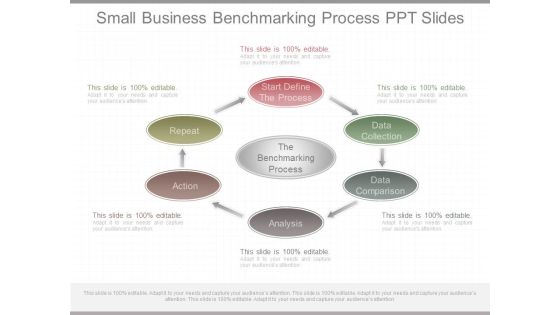
Small Business Benchmarking Process Ppt Slides
This is a small business benchmarking process ppt slides. This is a six stage process. The stages in this process are the benchmarking process, start define the process, data collection, data comparison, analysis, action, repeat.

Critical Surveys For Market Research Example Ppt Image
This is a critical surveys for market research example ppt image. This is a seven stage process. The stages in this process are determine research design, data collection, visualization and analysis, define research objective, instrument development, data quality check, reporting.
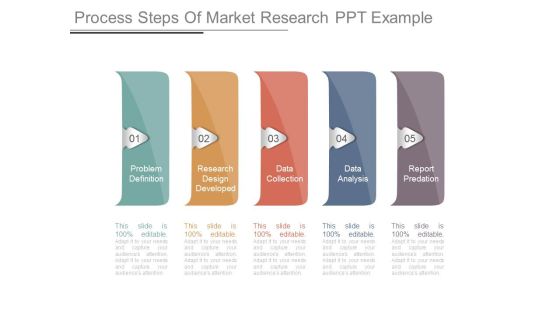
Process Steps Of Market Research Ppt Example
This is a process steps of market research ppt example. This is a five stage process. The stages in this process are problem definition, research design developed, data collection, data analysis, report predation.

Assets Resource Planning Template Powerpoint Slides Templates
This is a assets resource planning template powerpoint slides templates. This is a eight stage process. The stages in this process are finance, storage and access, demand, data mining and analysis, external audit, data sales and marketing, operations.

Improving Process Turnaround Time Example Ppt Examples
This is a improving process turnaround time example ppt examples. This is a four stage process. The stages in this process are output preparation, measure improve, data processing, data analysis, improving process.

Sample Of Visual Analytics Diagram Powerpoint Guide
This is a sample of visual analytics diagram powerpoint guide. This is a four stage process. The stages in this process are data analysis, business problem, find structure, data view.

Steps In Marketing Mix Process Powerpoint Slide Deck
This is a steps in marketing mix process powerpoint slide deck. This is a nine stage process. The stages in this process are market research, communication, implementation, data collection, data analysis, modelling, interpretation, budget allocation, forecasting.

Audit System Management Framework Good Ppt PowerPoint Presentation Microsoft
This is a audit system management framework good ppt powerpoint presentation microsoft. This is a five stage process. The stages in this process are objectives standards, method data collection, data analysis, implement change, re evaluate review.
Lifecycle Of Audit System Process Ppt PowerPoint Presentation Icon
This is a lifecycle of audit system process ppt powerpoint presentation icon. This is a five stage process. The stages in this process are objectives standards, method data, collection, data analysis, implement change.

Corporate Audit Management Process Ppt PowerPoint Presentation Summary
This is a corporate audit management process ppt powerpoint presentation summary. This is a five stage process. The stages in this process are re evaluate review, objectives standards, method data collection, data analysis, implement change.

Audit System Process Ppt PowerPoint Presentation Styles
This is a audit system process ppt powerpoint presentation styles. This is a five stage process. The stages in this process are method data collection, data analysis, objectives standards, reevaluate review, implement change.

Audit System Process Ppt PowerPoint Presentation Professional
This is a audit system process ppt powerpoint presentation professional. This is a five stage process. The stages in this process are objectives standards, method data collection, data analysis, implement change, re evaluate review.
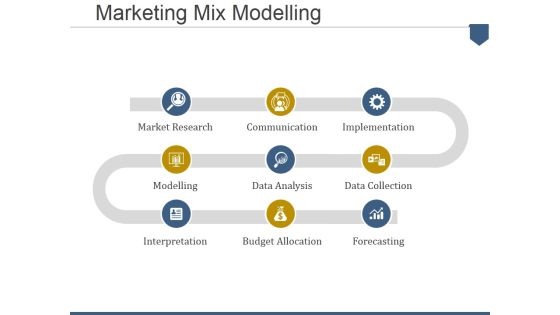
Marketing Mix Modelling Ppt PowerPoint Presentation Portfolio Graphics Template
This is a marketing mix modelling ppt powerpoint presentation portfolio graphics template. This is a three stage process. The stages in this process are market research, communication, implementation, data collection, forecasting, budget allocation, data analysis, modelling, interpretation.

Audit System Process Ppt PowerPoint Presentation Inspiration Graphics Design
This is a audit system process ppt powerpoint presentation inspiration graphics design. This is a five stage process. The stages in this process are objectives standards, method data collection, data analysis, implement change, re evaluate review.

Strategic Planning Business Architecture Template Ppt Slides
This is a strategic planning business architecture template ppt slides. This is a five stage process. The stages in this process are strategy, business architecture, enterprise architecture, information data architecture, information data architecture, application architecture.
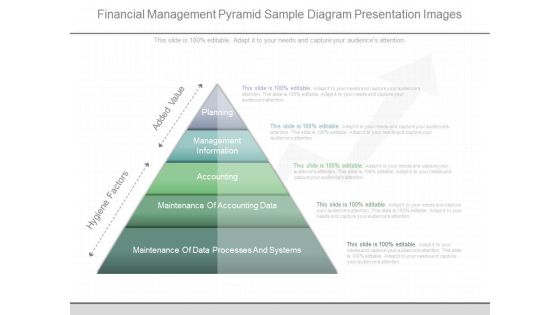
Financial Management Pyramid Sample Diagram Presentation Images
This is a financial management pyramid sample diagram presentation images. This is a five stage process. The stages in this process are planning, management information, accounting, maintenance of accounting data, maintenance of data processes and systems, hygiene factors, added value.

Basic Value Stream Mapping Slide Ppt Example
This is a basic value stream mapping slide ppt example. This is a five stage process. The stages in this process are information flow, material and data flow, timeline, process, data, customer.
Business Diagram Zigzag Process Diagram With Six Icons Presentation Template
This business diagram has been designed with graphic of six staged zigzag process diagram and icons. This slide depicts concept of data and process flow. Use this diagram for data display in business presentations.

Business Diagram Four Steps Flag Design Presentation Template
Graphic of four vertical colorful flags are used to design this power point template. This PPT contains the concept of data representation. Use this PPT for your data related topics in any presentation.

Business Diagram Building Diagram With Three Steps Presentation Template
Three staged house graphic has been used to craft this power point template. This PPT diagram contains the concept of data representation. Use this PPT for your data and business related presentations.

Business Diagram Eight Arrows Steps With Globe Presentation Template
Graphic of five staged film roll diagram has been used to craft this power point template diagram. This PPT contains the concept of data representation. Use this PPT for business and marketing data related presentations.
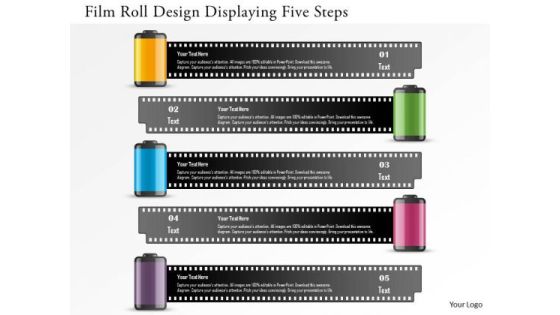
Business Diagram Film Roll Design Displaying Five Steps Presentation Template
Graphic of five staged film roll diagram has been used to craft this power point template diagram. This PPT contains the concept of data representation. Use this PPT for business and marketing data related presentations.

Business Diagram Film Roll Diagram With Three Steps Presentation Template
This power point template has been crafted with graphic of three film roll graphics. This PPT contains the concept of data flow. Use this PPT for your data related presentations.
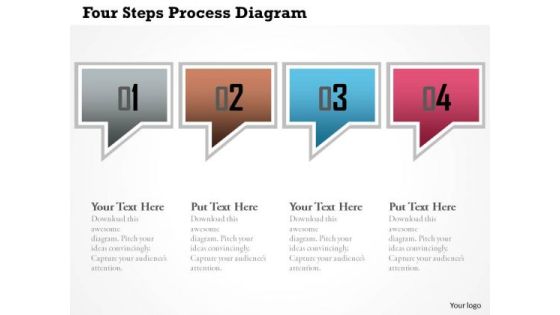
Business Diagram Four Steps Process Diagram Presentation Template
This power point template has been crafted with graphic of dialogue box. This PPT contains the concept of process and data flow. Use this PPT for your business and data related presentations.

Business Diagram Timeline Diagram With Six Options Presentation Template
Graphic of designer circles has been used to design this power point template. This PPT contains the concept of data representation. Use this PPT for your business and data related presentation.

Business Diagram Three Staged Step Diagram For Process Flow Presentation Template
Three staged step diagram has been used to craft this power point template diagram. This PPT contains the concept of data and process flow representation. Use this PPT for business and marketing data related presentations.


 Continue with Email

 Home
Home


