Data Challenges/icons/appstore.png
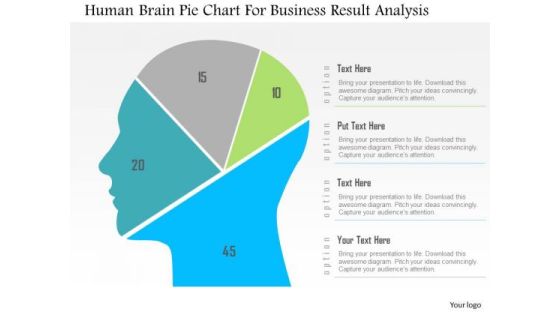
Business Diagram Human Brain Pie Chart For Business Result Analysis PowerPoint Slide
This diagram displays human face graphic divided into sections. This section can be used for data display. Use this diagram to build professional presentations for your viewers.

Business Diagram Human Mind Diagram With Pie Graph For Representation PowerPoint Slide
This diagram displays human face graphic divided into sections. This section can be used for data display. Use this diagram to build professional presentations for your viewers.

Business Diagram 3d Pencil With Text Boxes For Representation PowerPoint Slide
This Power Point diagram displays graphic of pencil with icons and text spaces. It contains diagram of colorful pencil for data display. Use this diagram to build professional presentations for your viewers.
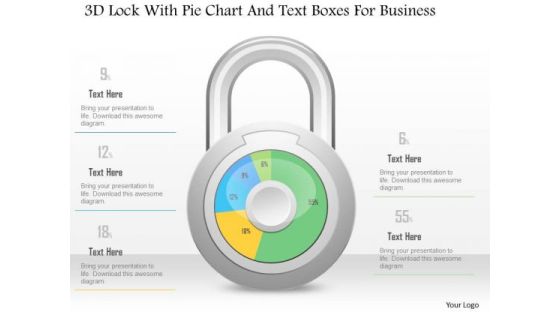
Business Diagram 3d Lock With Pie Chart And Text Boxes For Business PowerPoint Slide
This Power Point diagram has been crafted with pie chart in shape of lock. It contains diagram of lock pie chart to compare and present data in an effective manner. Use this diagram to build professional presentations for your viewers.

Business Diagram 3d Lock With Pie Graph For Result Representation PowerPoint Slide
This Power Point diagram has been crafted with pie chart in shape of lock. It contains diagram of lock pie chart to compare and present data in an effective manner. Use this diagram to build professional presentations for your viewers.

Bar Graph For Market Analysis Ppt Samples Download
This is a bar graph for market analysis ppt samples download. This is a four stage process. The stages in this process are category.
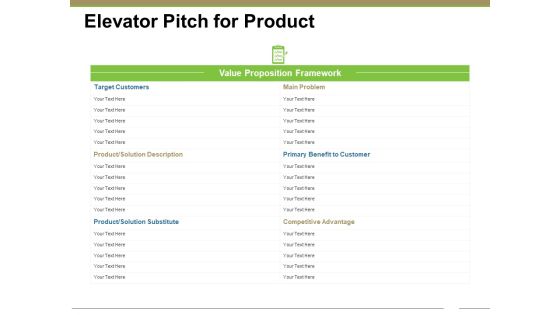
Elevator Pitch For Product Ppt PowerPoint Presentation Infographic Template Infographic Template
This is a elevator pitch for product ppt powerpoint presentation infographic template infographic template. This is a three stage process. The stages in this process are target customers, main problem, primary benefit to customer, competitive advantage, product solution description.

ROI Calculation Ppt PowerPoint Presentation Complete Deck With Slides
This is a roi calculation ppt powerpoint presentation complete deck with slides. This is a one stage process. The stages in this process are business, planning, strategy, marketing, management.

Datacenter Services Network Security Ppt Sample
This is a datacenter services network security ppt sample. This is a five stage process. The stages in this process are arrow, business, marketing.

Security Administration Powerpoint Shapes
This is a security administration powerpoint shapes. This is a three stage process. The stages in this process are storage management, directory service administration, security administration.

Business Diagram Six Staged Pie Charts For Text Representation PowerPoint Slide
This slide displays graphic six staged pie charts. Download this diagram to present and compare business data. Use this diagram to display business process workflows in any presentation.

Real Estate Policy Support Ppt PowerPoint Presentation Background Images
This is a real estate policy support ppt powerpoint presentation background images. This is a one stage process. The stages in this process are policy support, business, technology, big data, communication.

Magnifying Glass Ppt PowerPoint Presentation Ideas
This is a magnifying glass ppt powerpoint presentation ideas. This is a one stage process. The stages in this process are choose a right person for leadership, business, big data, marketing, technology.
Business Diagram Human Icons With Bubbles And Different Icons Inside PowerPoint Slide
This diagram displays graph with percentage value growth. This business slide is suitable to present and compare business data. Use this diagram to build professional presentations for your viewers.

Business Diagram Three Staged Pencil Diagram For Graph Formation PowerPoint Slide
This business diagram displays set of pencils. This Power Point template has been designed to compare and present business data. Download this diagram to represent stages of business growth.

Business Diagram Tablet With Pie And Business Bar Graph For Result Analysis PowerPoint Slide
This PowerPoint template displays technology gadgets with various business charts. Use this diagram slide, in your presentations to make business reports for statistical analysis. You may use this diagram to impart professional appearance to your presentations.
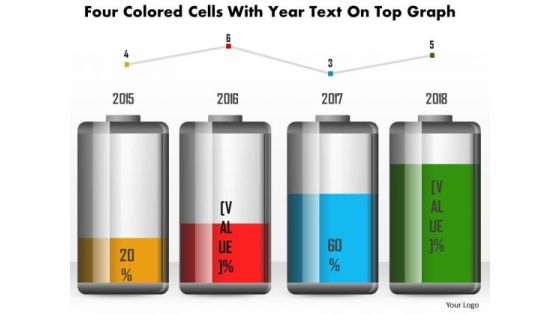
Business Diagram Four Colored Cells With Year Text On Top Graph PowerPoint Slide
This business diagram has been designed with battery cell graphic for business timeline. This slide can be used for business planning and management. Use this diagram for your business and success milestones related presentations.
Business Diagram Battery Icon With Power Icons Energy Technology PowerPoint Slide
This business diagram displays battery icon with power charging. Use this diagram, in your presentations to display energy saving, battery and technology. Create professional presentations using this diagram slide.
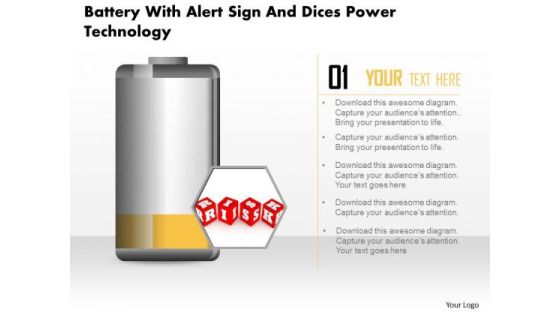
Business Diagram Battery With Alert Sign And Dices Power Technology PowerPoint Slide
This business diagram displays risk alert on battery icon. Use this diagram, in your presentations to display energy saving, battery and technology. Create professional presentations using this diagram slide.
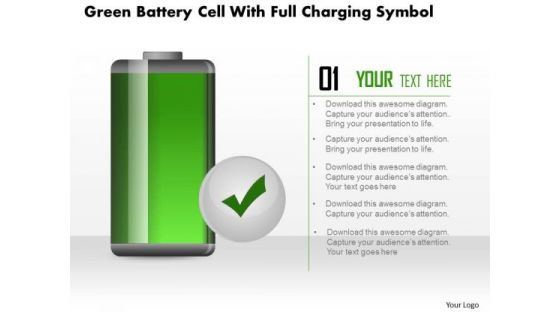
Business Diagram Green Battery Cell With Full Charging Symbol PowerPoint Slide
This business diagram displays full battery charge icon. Use this diagram, in your presentations to display energy saving, battery and technology. Create professional presentations using this diagram slide.
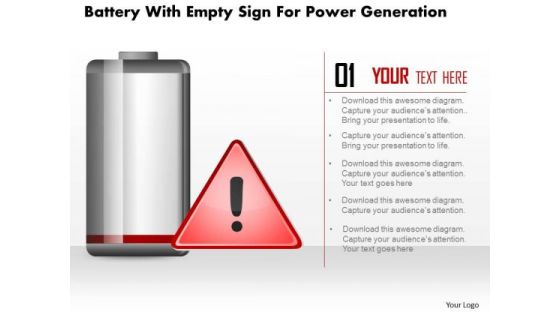
Business Diagram Battery With Empty Sign For Power Generation PowerPoint Slide
This business diagram displays empty sign alert on battery icon. Use this diagram, in your presentations to display energy saving, battery and technology. Create professional presentations using this diagram slide.
Business Diagram Hour Glass With 3d Man And Icons PowerPoint Slide
This diagram displays 3d man with hour glass and icons. This diagram contains concept of communication and technology. Use this diagram to display business process workflows in any presentations.

Magnifying Glass Ppt PowerPoint Presentation Model Show
This is a magnifying glass ppt powerpoint presentation model show. This is a one stage process. The stages in this process are magnifying glass, technology, communication, business, marketing.
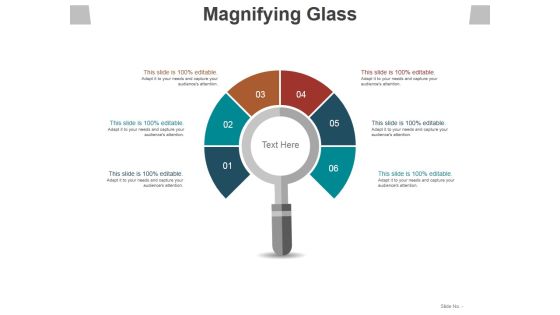
Magnifying Glass Ppt PowerPoint Presentation Layouts Guide
This is a magnifying glass ppt powerpoint presentation layouts guide. This is a six stage process. The stages in this process are magnifying glass, process, business, marketing, technology.

Magnifier Glass Ppt PowerPoint Presentation Summary Microsoft
This is a magnifier glass ppt powerpoint presentation summary microsoft. This is a five stage process. The stages in this process are magnifying glass, arrows, marketing, technology, business.
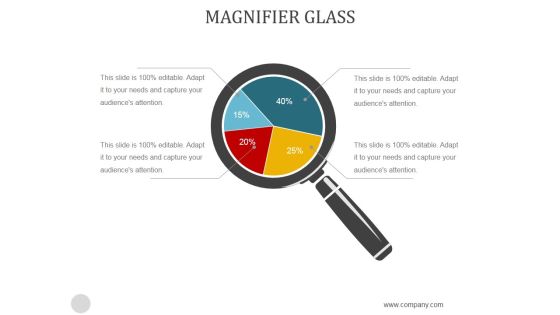
Magnifier Glass Ppt PowerPoint Presentation Example
This is a magnifier glass ppt powerpoint presentation example. This is a four stage process. The stages in this process are magnifier, searching, strategy, analysis, business.

Business Diagram Five Staged Timeline Diagram For Business PowerPoint Slide
This PowerPoint template displays five points timeline diagram. This business diagram has been designed with graphic of timeline with five points, text space and start, end points. Use this diagram, in your presentations to display process steps, stages, timelines and business management. Make wonderful presentations using this business slide.

Six Stages Disaster Cycle Ppt PowerPoint Presentation Designs Download
This is a six stages disaster cycle ppt powerpoint presentation designs download. This is a six stage process. The stages in this process are prevention, mitigation, preparedness, reconstruction, rehabilitation.

Key Potential Customers Ppt PowerPoint Presentation Tips
This is a key potential customers ppt powerpoint presentation tips. This is a one stage process. The stages in this process are target, audience.

Magnifying Glass Ppt PowerPoint Presentation File Grid
This is a magnifying glass ppt powerpoint presentation file grid. This is a four stage process. The stages in this process are magnifying glass, icons, marketing, business, management.
Magnifying Glass Ppt PowerPoint Presentation Icon Good
This is a magnifying glass ppt powerpoint presentation icon good. This is a five stage process. The stages in this process are magnifying glass, process, icons, marketing, business.
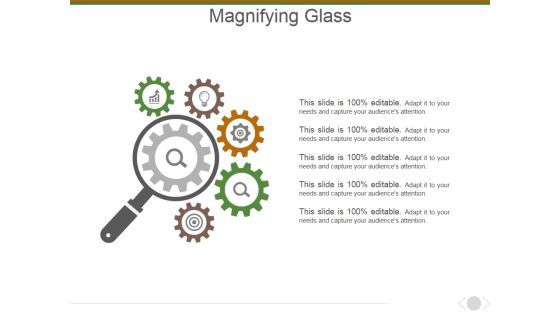
Magnifying Glass Ppt PowerPoint Presentation Infographic Template Example Topics
This is a magnifying glass ppt powerpoint presentation infographic template example topics. This is a five stage process. The stages in this process are magnifying glass, icons, business, marketing, management.

Business Diagram Colored Column Chart For Result Analysis PowerPoint Slide
This Power Point diagram has been designed with graphic of column chart. It contains diagram of bar char depicting annual business progress report. Use this diagram to build professional presentations for your viewers.
Magnifying Glass Ppt PowerPoint Presentation Icon Topics
This is a magnifying glass ppt powerpoint presentation icon topics. This is a three stage process. The stages in this process are magnifying glass, technology, business, marketing, icons.

Magnifying Glass Ppt PowerPoint Presentation Guidelines
This is a magnifying glass ppt powerpoint presentation guidelines. This is a four stage process. The stages in this process are magnifying glass, business, technology, marketing, success.
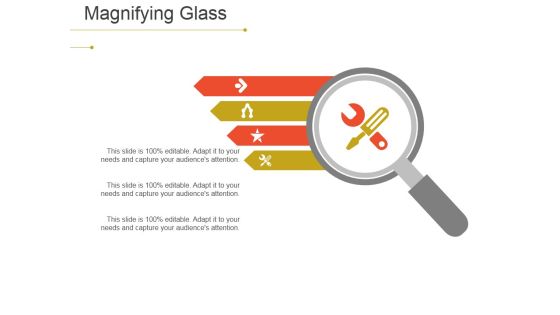
Magnifying Glass Ppt PowerPoint Presentation Infographic Template Inspiration
This is a magnifying glass ppt powerpoint presentation infographic template inspiration. This is a four stage process. The stages in this process are magnifying glass, business, technology, marketing, management.
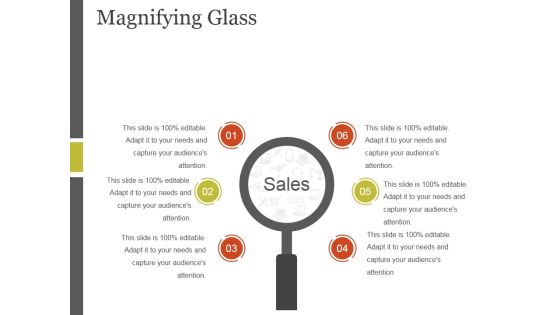
Magnifying Glass Ppt PowerPoint Presentation Outline Graphic Tips
This is a magnifying glass ppt powerpoint presentation outline graphic tips. This is a six stage process. The stages in this process are sales, magnifying glass, business, marketing, technology.

Magnifier Glass Ppt PowerPoint Presentation Infographic Template Sample
This is a magnifier glass ppt powerpoint presentation infographic template sample. This is a six stage process. The stages in this process are magnifier glass, icon, business, technology, marketing.
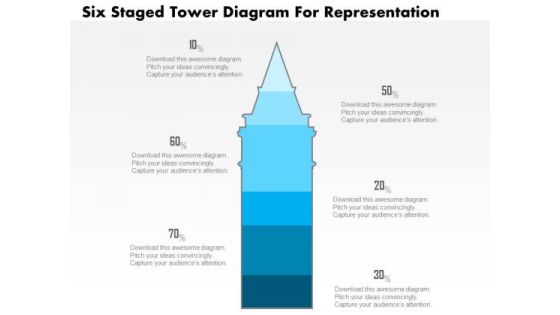
Business Diagram Five Staged Tower Diagram For Representation PowerPoint Slide
This business slide displays five staged tower diagram. It contains blue tower graphic divided into five parts. This diagram slide depicts processes, stages, steps, points, options information display. Use this diagram, in your presentations to express your views innovatively.
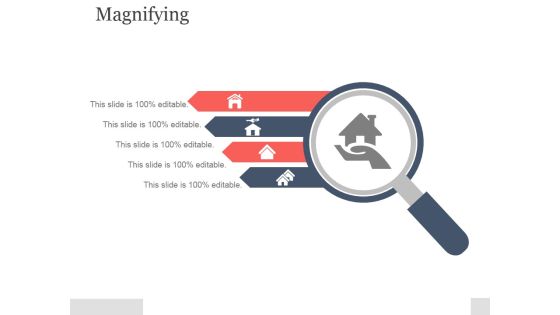
Magnifying Ppt PowerPoint Presentation Background Designs
This is a magnifying ppt powerpoint presentation background designs. This is a four stage process. The stages in this process are business, marketing, success, management, icons.

Magnifying Glass Ppt PowerPoint Presentation Outline
This is a magnifying glass ppt powerpoint presentation outline. This is a six stage process. The stages in this process are magnifying glass, icons, process, marketing, business.

Magnifying Glass Ppt PowerPoint Presentation Files
This is a magnifying glass ppt powerpoint presentation files. This is a four stage process. The stages in this process are business, marketing, process, magnifying, glass.

Magnifying Glass Ppt PowerPoint Presentation Inspiration Brochure
This is a magnifying glass ppt powerpoint presentation inspiration brochure. This is a six stage process. The stages in this process are magnifying glass, business, marketing, success.
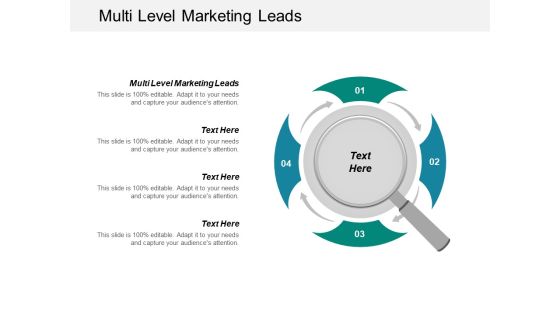
Multi Level Marketing Leads Ppt PowerPoint Presentation File Brochure Cpb
This is a multi level marketing leads ppt powerpoint presentation file brochure cpb. This is a four stage process. The stages in this process are multi level marketing leads.
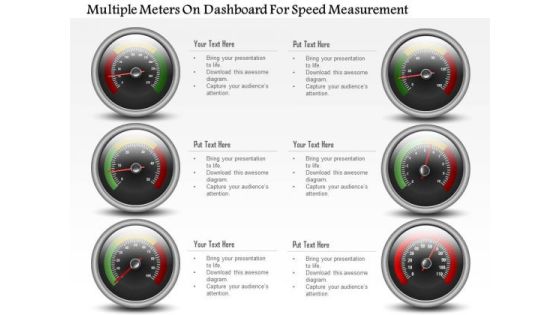
Business Diagram Multiple Meters On Dashboard For Speed Measurement PowerPoint Slide
This business diagram has been designed with multiple meters on dashboard. This slide can be used for business planning and progress. Use this diagram for your business and success milestones related presentations.

Business Diagram Four Steps With 3d Business Person Standing Over It PowerPoint Slide
This business diagram displays bar graph with business person standing on it. This Power Point template has been designed to display personal growth. You may use this diagram to impart professional appearance to your presentations.

Magnify Ppt PowerPoint Presentation Summary Portfolio
This is a magnify ppt powerpoint presentation summary portfolio. This is a five stage process. The stages in this process are magnify, business, technology, data analysis, marketing.
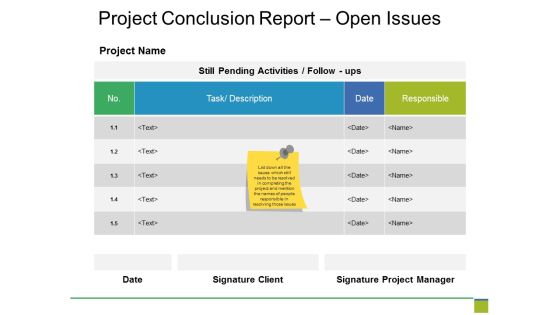
Project Conclusion Report Open Issues Ppt PowerPoint Presentation Outline Gallery
This is a project conclusion report open issues ppt powerpoint presentation outline gallery. This is a five stage process. The stages in this process are project name, table, data analysis, data analysis.

Marketing Mix Modelling Ppt PowerPoint Presentation Good
This is a marketing mix modelling ppt powerpoint presentation good. This is a eight stage process. The stages in this process are market research, implementation, data analysis, interpretation, communication, modelling, data collection, budget allocation.

Cloud Information Security What Are The Downsides Of A Cloud Security Ppt Infographics Files PDF
This slide describes the downsides of the cloud security system, including loss of control over data, data loss, insider theft, and data breaches. Presenting Cloud Information Security What Are The Downsides Of A Cloud Security Ppt Infographics Files PDF to provide visual cues and insights. Share and navigate important information on four stages that need your due attention. This template can be used to pitch topics like Data Loss, Loss Control, Insider Theft, Data Breaches. In addtion, this PPT design contains high resolution images, graphics, etc, that are easily editable and available for immediate download.

Consumer Information Platform Architecture With Channels Professional PDF
This slide shows the customer data platform architecture which covers the data such as demographics, onsite behavioural, transactional, mobile and device data, etc with channels such as email, push messaging, social, direct mail, etc. Persuade your audience using this consumer information platform architecture with channels professional pdf. This PPT design covers five stages, thus making it a great tool to use. It also caters to a variety of topics including predictive, segmentation, multi channel and data, cross device tracking. Download this PPT design now to present a convincing pitch that not only emphasizes the topic but also showcases your presentation skills.
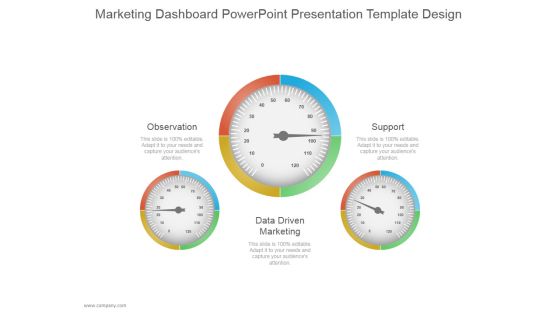
Marketing Dashboard Ppt PowerPoint Presentation Slides
This is a marketing dashboard ppt powerpoint presentation slides. This is a three stage process. The stages in this process are observation, data driven marketing, support.

4 Basic Principles Of Company Ppt PowerPoint Presentation Guidelines
This is a 4 basic principles of company ppt powerpoint presentation guidelines. This is a four stage process. The stages in this process are assist in the creation of the final report, track activity, collect data, perform a random data sample for each audit procedure.
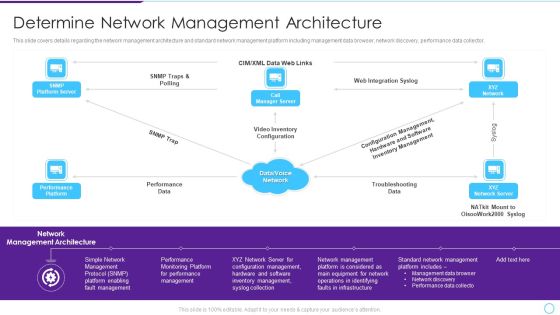
Intelligent Infrastructure Determine Network Management Architecture Formats PDF
This slide covers details regarding the network management architecture and standard network management platform including management data browser, network discovery, performance data collector. Presenting Intelligent Infrastructure Determine Network Management Architecture Formats PDF to provide visual cues and insights. Share and navigate important information on five stages that need your due attention. This template can be used to pitch topics like Performance, Data, SNMP Trap, Web Integration Syslog, XYZ Network Server. In addtion, this PPT design contains high resolution images, graphics, etc, that are easily editable and available for immediate download.

Business And Financial Analysis Ppt PowerPoint Presentation Portfolio Templates
This is a business and financial analysis ppt powerpoint presentation portfolio templates. This is a four stage process. The stages in this process are investment, tables, data analysis, marketing, equipment.
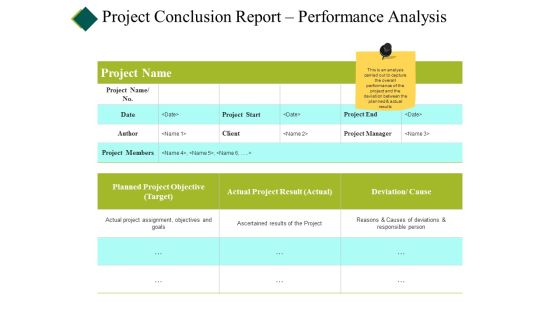
Project Conclusion Report Performance Analysis Ppt PowerPoint Presentation Show Smartart
This is a project conclusion report performance analysis ppt powerpoint presentation show smartart. This is a three stage process. The stages in this process are cost, planning, table, project report, data management.

Monthly Social Media Dashboard Ppt PowerPoint Presentation Infographics Files
This is a monthly social media dashboard ppt powerpoint presentation infographics files. This is a four stage process. The stages in this process are marketing, business, financial, data analysis, management.

Search Engine Rankings Ppt PowerPoint Presentation Layouts Gridlines
This is a Search Engine Rankings Ppt PowerPoint Presentation Layouts Gridlines. This is a three stage process. The stages in this process are Business, Marketing, Table, Data Analysis, Finance.

Revenue Split By Product Segment Template Ppt PowerPoint Presentation Pictures Professional
This is a revenue split by product segment template ppt powerpoint presentation pictures professional. This is a four stage process. The stages in this process are table, data analysis, business, marketing, compare.

Product Comparison Ppt PowerPoint Presentation Visual Aids Gallery
This is a product comparison ppt powerpoint presentation visual aids gallery. This is a six stage process. The stages in this process are business, table, marketing, data analysis, feature.


 Continue with Email

 Home
Home


