Data Architecture Diagram
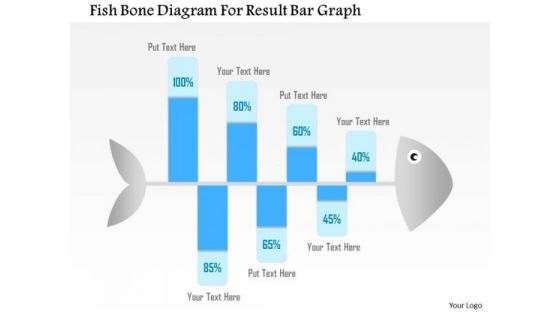
Business Diagram Fish Bone Diagram For Result Bar Graph Presentation Template
Graphic of fish bone has been used to design this Power Point template slide. This PPT slide contains the concept of problem analysis and root cause analysis. Use this PPT slide and display process of root cause analysis for any field. This PPT slide is very well designed for business and production related problem analysis.

Business Diagram 3d Binary Globe Vector In Circular Diagram Presentation Template
This business image has been designed with graphic of 3d binary globe with vector design. Use this image for your global business topics. Make a wonderful presentations by using this exclusive image.
C4 Model For Salesforce Diagram Model Icons PDF
This slide mentions the C4 model for salesforce diagram architecture based upon abstractions that reflect how software architects and developers think about and build softwares. It includes context, containers, components and code. Introducing C4 Model For Salesforce Diagram Model Icons PDF. to increase your presentation threshold. Encompassed with four stages, this template is a great option to educate and entice your audience. Dispence information on Context, Containers, Components, using this template. Grab it now to reap its full benefits.

Business Analysis Vs Business Analytics Diagram Ppt Slides
This is a business analysis vs business analytics diagram ppt slides. This is a one stage process. The stages in this process are area, main focus, architectural domains, requirements, project management, business analysis, functions and process, enterprise? process technology organisation, functionality software configuration and development, sdlc, business analytics, data and reporting, data information technology, reports, dashboards and kpis data consolidation and presention, sdlc agile.

Data Search With Various Charts To Recognize Market Trends Icon Ppt PowerPoint Presentation Infographic Template Clipart PDF
Persuade your audience using this data search with various charts to recognize market trends icon ppt powerpoint presentation infographic template clipart pdf. This PPT design covers three stages, thus making it a great tool to use. It also caters to a variety of topics including data search with various charts to recognize market trends icon. Download this PPT design now to present a convincing pitch that not only emphasizes the topic but also showcases your presentation skills.

Summary Of Cloud Erp System Framework Current Real Time Data Accessibility Status In The Company Brochure PDF
This slide shows the current Real Time Data Accessibility status of the company in terms of accessible and not accessible.Deliver and pitch your topic in the best possible manner with this Summary Of Cloud Erp System Framework Current Real Time Data Accessibility Status In The Company Brochure PDF Use them to share invaluable insights on Current Real Time Data Accessibility Status In The Company and impress your audience. This template can be altered and modified as per your expectations. So, grab it now.
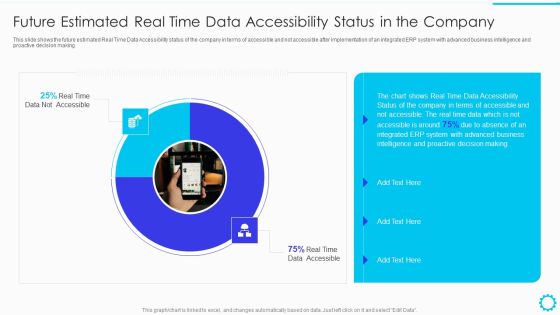
Summary Of Cloud ERP System Framework Future Estimated Real Time Data Accessibility Status In The Company Structure PDF
This slide shows the future estimated Real Time Data Accessibility status of the company in terms of accessible and not accessible after implementation of an integrated ERP system with advanced business intelligence and proactive decision makingDeliver and pitch your topic in the best possible manner with this Summary Of Cloud ERP System Framework Future Estimated Real Time Data Accessibility Status In The Company Structure PDF Use them to share invaluable insights on Data Accessibility, Accessible Is Around, Proactive Decision Making and impress your audience. This template can be altered and modified as per your expectations. So, grab it now.

Real Estate Property Management System Real Estate Price And Sales Historical Data Ppt Professional Slide Portrait PDF
Deliver and pitch your topic in the best possible manner with this real estate property management system real estate price and sales historical data ppt professional slide portrait pdf. Use them to share invaluable insights on prices, sales and impress your audience. This template can be altered and modified as per your expectations. So, grab it now.
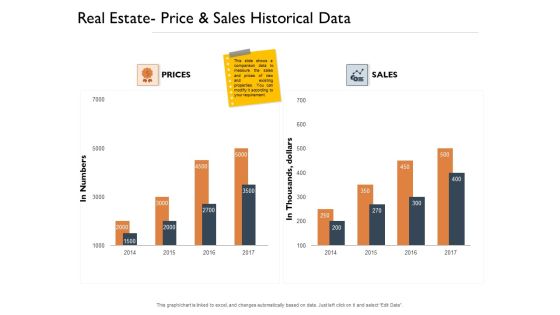
Freehold Property Business Plan Real Estate Price And Sales Historical Data Ppt PowerPoint Presentation Slides Design Ideas PDF
Presenting this set of slides with name freehold property business plan real estate price and sales historical data ppt powerpoint presentation slides design ideas pdf. The topics discussed in these slides are sales, price, 2014 to 2017. This is a completely editable PowerPoint presentation and is available for immediate download. Download now and impress your audience.
Server Icon With Tick Mark For Data Verification Vector Icon Ppt PowerPoint Presentation Gallery File Formats PDF
Showcasing this set of slides titled server icon with tick mark for data verification vector icon ppt powerpoint presentation gallery file formats pdf. The topics addressed in these templates are server icon with tick mark for data verification vector icon. All the content presented in this PPT design is completely editable. Download it and make adjustments in color, background, font etc. as per your unique business setting.

3 Division Circle Illustration For Audience Management Big Data Platform Ppt PowerPoint Presentation File Background Designs PDF
Presenting 3 division circle illustration for audience management big data platform ppt powerpoint presentation file background designs pdf to dispense important information. This template comprises three stages. It also presents valuable insights into the topics including 3 division circle illustration for audience management big data platform. This is a completely customizable PowerPoint theme that can be put to use immediately. So, download it and address the topic impactfully.
Local Area Network For Data Transfer Between Various Devices Vector Icon Ppt PowerPoint Presentation File Display PDF
Persuade your audience using this local area network for data transfer between various devices vector icon ppt powerpoint presentation file display pdf. This PPT design covers three stages, thus making it a great tool to use. It also caters to a variety of topics including local area network for data transfer between various devices vector icon. Download this PPT design now to present a convincing pitch that not only emphasizes the topic but also showcases your presentation skills.
Local Area Network For Receiving Data From Various Sources Vector Icon Ppt PowerPoint Presentation Gallery Slide Download PDF
Persuade your audience using this local area network for receiving data from various sources vector icon ppt powerpoint presentation gallery slide download pdf. This PPT design covers three stages, thus making it a great tool to use. It also caters to a variety of topics including local area network for receiving data from various sources vector icon. Download this PPT design now to present a convincing pitch that not only emphasizes the topic but also showcases your presentation skills.

Information Analysis And BI Playbook How To Overcome Automated Data Analysis Powered By Ml Challenges Clipart PDF
This template illustrates that automated discovery of insights utilizes machine learning algorithms to analyze billions of data points in seconds to perform complex segmentation, anomaly detection, and trend-based analysis without coding. Make sure to capture your audiences attention in your business displays with our gratis customizable Information Analysis And BI Playbook How To Overcome Automated Data Analysis Powered By Ml Challenges Clipart PDF. These are great for business strategies, office conferences, capital raising or task suggestions. If you desire to acquire more customers for your tech business and ensure they stay satisfied, create your own sales presentation with these plain slides.
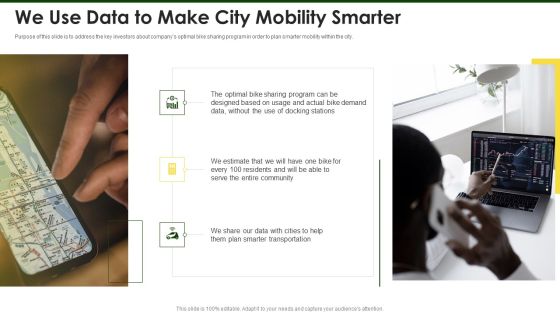
Lime Investor Fundraising Elevator We Use Data To Make City Mobility Smarter Ppt Pictures Master Slide PDF
Purpose of this slide is to address the key investors about companys optimal bike sharing program in order to plan smarter mobility within the city. This is a lime investor fundraising elevator we use data to make city mobility smarter ppt pictures master slide pdf template with various stages. Focus and dispense information on three stages using this creative set, that comes with editable features. It contains large content boxes to add your information on topics like entire community, demand data, designed based. You can also showcase facts, figures, and other relevant content using this PPT layout. Grab it now.
Targeted Marketing Campaigns To Improve Buyers Experience Tools To Gather Data From Social Media Platforms Icons PDF
This slide showcases social media tools that can be used to gather data about consumers to formulate personalized marketing campaigns. Twitter analytics, facebook audience insight and instagram insights are the internal tools that can be used. If your project calls for a presentation, then Slidegeeks is your go to partner because we have professionally designed, easy to edit templates that are perfect for any presentation. After downloading, you can easily edit Targeted Marketing Campaigns To Improve Buyers Experience Tools To Gather Data From Social Media Platforms Icons PDF and make the changes accordingly. You can rearrange slides or fill them with different images. Check out all the handy templates

Clinical Trial Phases With Data Focus And Design Features Medical Research Phases For Clinical Tests Designs PDF
This slide shows the tabulation of key objectives of multiple phases of the clinical research process. It also provides information regarding factors to be identified while investigating the new drug. Take your projects to the next level with our ultimate collection of Clinical Trial Phases With Data Focus And Design Features Medical Research Phases For Clinical Tests Designs PDF. Slidegeeks has designed a range of layouts that are perfect for representing task or activity duration, keeping track of all your deadlines at a glance. Tailor these designs to your exact needs and give them a truly corporate look with your own brand colors they will make your projects stand out from the rest.
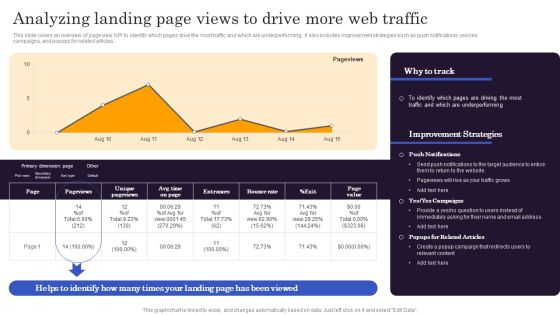
Marketers Guide To Data Analysis Optimization Analyzing Landing Page Views To Drive More Web Traffic Rules PDF
This slide covers an overview of page view KPI to identify which pages drive the most traffic and which are underperforming. It also includes improvement strategies such as push notifications, yes yes campaigns, and popups for related articles. Do you have an important presentation coming up Are you looking for something that will make your presentation stand out from the rest Look no further than Marketers Guide To Data Analysis Optimization Analyzing Landing Page Views To Drive More Web Traffic Rules PDF. With our professional designs, you can trust that your presentation will pop and make delivering it a smooth process. And with Slidegeeks, you can trust that your presentation will be unique and memorable. So why wait Grab Marketers Guide To Data Analysis Optimization Analyzing Landing Page Views To Drive More Web Traffic Rules PDF today and make your presentation stand out from the rest.
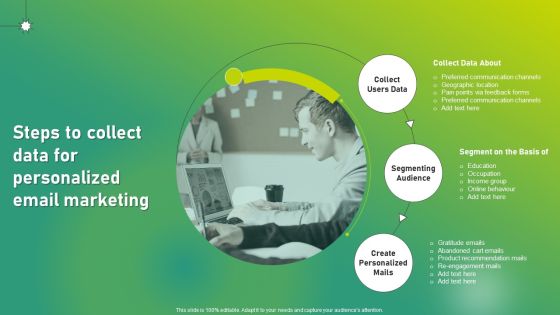
Targeted Marketing Strategic Plan For Audience Engagement Steps To Collect Data For Personalized Email Marketing Designs PDF
Whether you have daily or monthly meetings, a brilliant presentation is necessary. Targeted Marketing Strategic Plan For Audience Engagement Steps To Collect Data For Personalized Email Marketing Designs PDF can be your best option for delivering a presentation. Represent everything in detail using Targeted Marketing Strategic Plan For Audience Engagement Steps To Collect Data For Personalized Email Marketing Designs PDF and make yourself stand out in meetings. The template is versatile and follows a structure that will cater to your requirements. All the templates prepared by Slidegeeks are easy to download and edit. Our research experts have taken care of the corporate themes as well. So, give it a try and see the results.

Selecting And Developing An Effective Target Market Strategy Analyze Online And Offline Marketing Campaigns Data Template PDF
This template covers dashboard to measure and analyze target marketing campaign performance. It also helps in tracking and reporting online and offline marketing campaigns through kpis such as traffic sources, lead generation metrics, offline product sales, store visitations, customer acquisition, and offline retention and advocacy If you are looking for a format to display your unique thoughts, then the professionally designed Selecting And Developing An Effective Target Market Strategy Analyze Online And Offline Marketing Campaigns Data Template PDF is the one for you. You can use it as a Google Slides template or a PowerPoint template. Incorporate impressive visuals, symbols, images, and other charts. Modify or reorganize the text boxes as you desire. Experiment with shade schemes and font pairings. Alter, share or cooperate with other people on your work. Download Selecting And Developing An Effective Target Market Strategy Analyze Online And Offline Marketing Campaigns Data Template PDF and find out how to give a successful presentation. Present a perfect display to your team and make your presentation unforgettable.

Business Analytics Application BI Architectural Framework For Modern Businesses Portrait PDF
This slide represents a blueprint for how an organization would go about its business intelligence initiatives. It includes six components of BI architecture such as data collection, data integration, storage of data, data analysis, distribution of data and reaction based on insights. Get a simple yet stunning designed Business Analytics Application BI Architectural Framework For Modern Businesses Portrait PDF. It is the best one to establish the tone in your meetings. It is an excellent way to make your presentations highly effective. So, download this PPT today from Slidegeeks and see the positive impacts. Our easy-to-edit Business Analytics Application BI Architectural Framework For Modern Businesses Portrait PDF can be your go-to option for all upcoming conferences and meetings. So, what are you waiting for Grab this template today.

Business Diagram Infographics Design With Five Options Presentation Template
Five staged info graphics has been used to craft this power point template diagram. This PPT diagram contains the concept of data flow and data technology. Use this PPT for business and data related presentations.

Business Diagram 3d Pencil With Text Boxes For Representation PowerPoint Slide
This Power Point diagram displays graphic of pencil with icons and text spaces. It contains diagram of colorful pencil for data display. Use this diagram to build professional presentations for your viewers.

Corporate Intelligence Business Analysis Technology And Product Architectures Access Inspiration PDF
Presenting corporate intelligence business analysis technology and product architectures access inspiration pdf to provide visual cues and insights. Share and navigate important information on four stages that need your due attention. This template can be used to pitch topics like data sources, enterprise data warehouse, analytics, user access. In addition, this PPT design contains high-resolution images, graphics, etc, that are easily editable and available for immediate download.
Business Diagram Human Icons With Bubbles And Different Icons Inside PowerPoint Slide
This diagram displays graph with percentage value growth. This business slide is suitable to present and compare business data. Use this diagram to build professional presentations for your viewers.
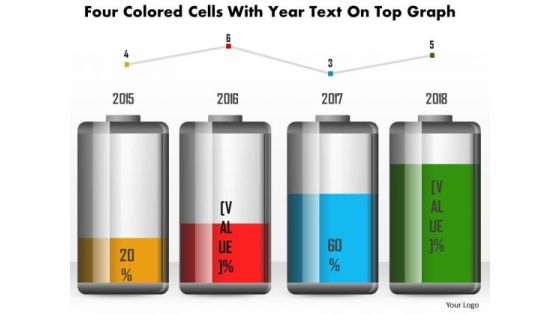
Business Diagram Four Colored Cells With Year Text On Top Graph PowerPoint Slide
This business diagram has been designed with battery cell graphic for business timeline. This slide can be used for business planning and management. Use this diagram for your business and success milestones related presentations.
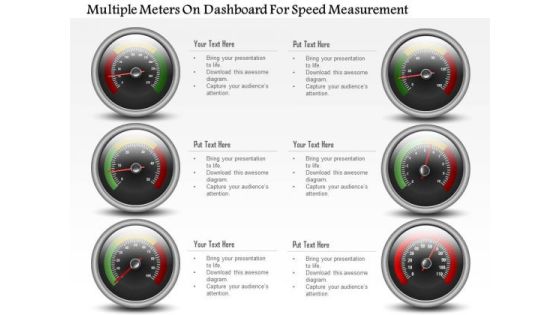
Business Diagram Multiple Meters On Dashboard For Speed Measurement PowerPoint Slide
This business diagram has been designed with multiple meters on dashboard. This slide can be used for business planning and progress. Use this diagram for your business and success milestones related presentations.

Business Diagram Four Steps With 3d Business Person Standing Over It PowerPoint Slide
This business diagram displays bar graph with business person standing on it. This Power Point template has been designed to display personal growth. You may use this diagram to impart professional appearance to your presentations.
Business Diagram Globe With Colorful Arrows And Icons Presentation Template
This business diagram has been designed with graphic of globe with arrow and icons. Use our diagram slide to organize data and to display data analysis. This diagram is suitable for global business and marketing related presentations.

Business Diagram Infographics Design With Three Options Presentation Template
Three staged info graphics has been used to craft this power point template diagram. This PPT diagram contains the concept of data flow and storage. Use this PPT for business and data related presentations.
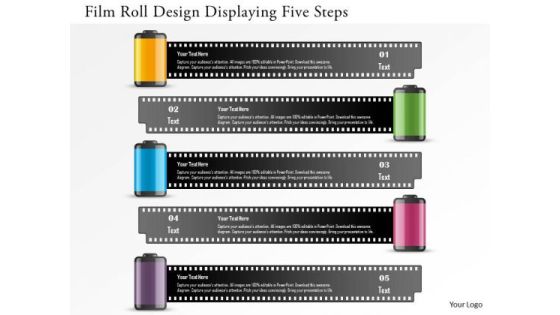
Business Diagram Film Roll Design Displaying Five Steps Presentation Template
Graphic of five staged film roll diagram has been used to craft this power point template diagram. This PPT contains the concept of data representation. Use this PPT for business and marketing data related presentations.

Circular Diagram Of Agile Software Development Powerpoint Templates
This PowerPoint template has been designed with circular diagram This diagram is a data visualization tool that gives you a simple way to present statistical information. This slide helps your audience examine and interpret the data you present.

Business Diagram Infographics Design With Six Options Presentation Template
Graphic of six staged info graphics has been used to design this power point template. This PPT diagram contains the concept of data flow and representation. Use this PPT for data technology related presentations.
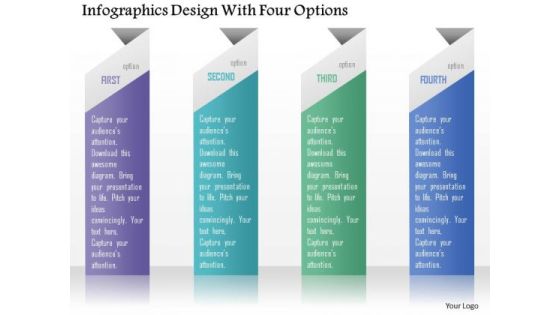
Business Diagram Infographics Design With Four Options Presentation Template
Four staged info graphics has been used to design this power point template. This PPT diagram contains the concept of data flow. Use this PPT for business and marketing data related topics in any presentation.

Business Diagram Five Staged Torn Paper Text Boxes PowerPoint Template
Five staged torn paper design text box diagram has been used to craft this power point template slide. This PPT slide contains the concept of data representation. Use this PPT for your business and marketing data related presentations.
Business Diagram Four Steps With Icons Presentation Template
This power point template diagram has been crafted with graphic of four staged text boxes. This PPT contains the concept of text and data representation. Use this PPT for your business and data related presentations.
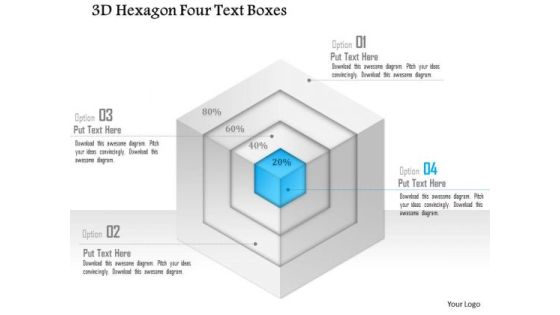
Business Diagram 3d Hexagon Four Text Boxes PowerPoint Template
Graphic of 3d hexagon diagram and text boxes are used to craft this power point template slide. This PPT slide contains the concept of data representation. Use this PPT for your business and marketing data flow related presentations.
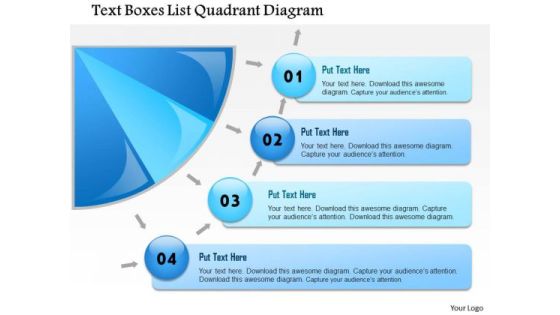
Business Framework Text Boxes List Quadrant Diagram PowerPoint Presentation
A semi circle diagram with text boxes are used to design this power point template slide. This PPT slide contains the concept of displaying business data. This PPT slide may be used for business data representations.
Business Diagram Three Staged Sequential Infographics With Icons PowerPoint Template
Three staged sequential info graphic with icons has been used to design this power point template. This PPT contains the concept of data flow. Use this PPT diagram to show marketing and business data in any presentation.
Factors Of Online Marketing Sample Diagram Ppt Icons
This is a factors of online marketing sample diagram ppt icons. This is a nine stage process. The stages in this process are factors of online marketing, campaign management, campaign design, campaign setup, campaign automation, lead management, lead routing, lead scoring, lead scoring, data segmentation, data quality, data management, marketing database.
Business Diagram Four Staged Torn Paper Text Boxes PowerPoint Template
Four staged torn paper style text boxes are used to craft this power point template. This PPT contains the concept of data representation for business process. Use this PPT and build an innovative presentation for data based topics.

Business Diagram Five Staged Infographics With Stand Design PowerPoint Template
Five staged info graphics with stand has been used to craft this power point template. This PPT contains the concept of data flow. Use this PPT slide for your sales and business data related presentations.

Business Diagram Design Of Five Pen Drives Presentation Template
Graphic of five colored pen drives has been used to craft this power point template. This PPT contains the concept of data storage. Use this PPT for data technology related presentations.

Business Diagram Four Steps For Process Improvement Presentation Template
Graphic of four sequential text boxes are used to design this power point template. This PPT contains the concept of data flow in any process. Use this PPT for your data and process flow related topics in any presentation.

Business Diagram Three Interconnected Circles With Text Boxes Presentation Template
Three interconnected circles and text boxes are used to design this business diagram. This slide contains the concept of data and process flow. Use this amazing slide for your business and data related presentations.

Business Diagram Three Triangles To Present Business Information Presentation Template
Three interconnected triangles are used to design this business diagram. This slide contains the concept of data and process flow. Use this slide for your business and data related presentations.

Business Diagram Four Steps Flag Design Presentation Template
Graphic of four vertical colorful flags are used to design this power point template. This PPT contains the concept of data representation. Use this PPT for your data related topics in any presentation.
Business Diagram Five Staged Multiple Icons Text Boxes Presentation Template
Five staged multiple icons style text boxes has been used to design this power point template. This PPT contains the concept of data representation. Display all data flow related topics in your business presentation with this PPT.
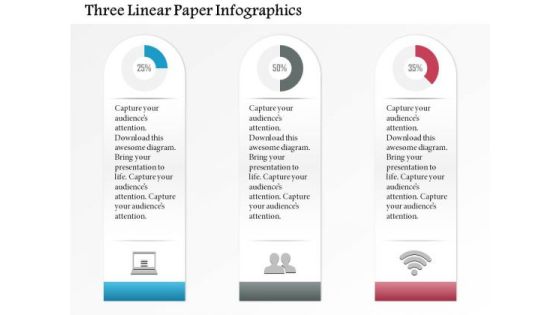
Business Diagram Three Linear Paper Infographics Presentation Template
Three linear paper info graphics has been used to design this power point template slide. This PPT slide contains the concept of data analysis and business data flow. Use this PPT slide for your business and marketing related presentations.

Business Diagram Five Business Steps In Numeric Order Presentation Template
Five colored linear text boxes are used to design this power point template. This PPT contains the concept of data flow updation. Display any data in your business presentation with this unique PPT.

Business Diagram Five Steps In Concentric Circle Presentation Template
Five staged colorful circular text boxes in linear flow has been used to design this power point template. This PPT contains the concept of data representation. Use this PPT for your data related topics in any business or sales presentation.

Naas Architectural Framework Importance Of Network As A Service Inspiration PDF
This slide represents why a network as a service is essential for businesses. It includes increasing distributed applications, movement of data beyond data centers, accessing new technologies, distributed workforces trend, and flexibility and performance. If you are looking for a format to display your unique thoughts, then the professionally designed Naas Architectural Framework Importance Of Network As A Service Inspiration PDF is the one for you. You can use it as a Google Slides template or a PowerPoint template. Incorporate impressive visuals, symbols, images, and other charts. Modify or reorganize the text boxes as you desire. Experiment with shade schemes and font pairings. Alter, share or cooperate with other people on your work. Download Naas Architectural Framework Importance Of Network As A Service Inspiration PDF and find out how to give a successful presentation. Present a perfect display to your team and make your presentation unforgettable.

Business Diagram Triangle For Business Process Presentation Template
Use this business slide for data representation. This diagram contains the graphic of triangle text box. Amplify your thoughts via this appropriate business template.
Four Circles Venn Diagram With Icons Powerpoint Slides
Four circles Venn diagram has been used to design this power point template. This PPT helps to portray the concept of business data analysis. Use this PPT for your business and marketing related presentations.
Two Circles Venn Diagram With Icons Powerpoint Slides
Venn diagram of two circles has been used to design this power point template. This PPT helps to portray the concept of business data analysis. Use this PPT for your business and marketing related presentations.
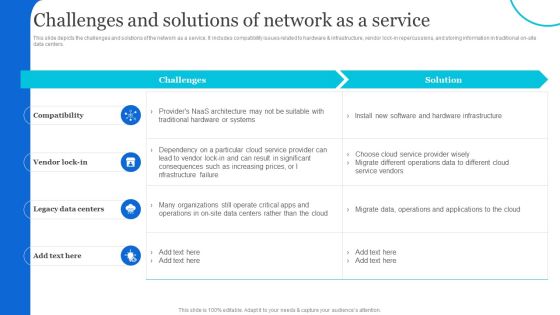
Naas Architectural Framework Challenges And Solutions Of Network As A Service Themes PDF
This slide depicts the challenges and solutions of the network as a service. It includes compatibility issues related to hardware and infrastructure, vendor lock-in repercussions, and storing information in traditional on-site data centers. There are so many reasons you need a Naas Architectural Framework Challenges And Solutions Of Network As A Service Themes PDF. The first reason is you cant spend time making everything from scratch, Thus, Slidegeeks has made presentation templates for you too. You can easily download these templates from our website easily.

Business Diagram Design Of Four Business Options Presentation Template
Graphic of four staged colorful text boxes has been used to craft this power point template. This PPT contains the concept of data representation and flow. This PPT can be used for your data flow related topics in any business and sales presentation.
Business Diagram Loudspeaker With Icons Dialogue Box Presentation Template
Graphic of loudspeaker and icons of dialogue box has been used to design this business diagram. This diagram contains the concept of business information communication. Use this diagram for data communication related presentation.
Business Diagram Loudspeaker With Web Icons Dialogue Box Presentation Template
Graphics of loudspeaker and icons of web with dialogue box have been used to design this business diagram. This diagram contains the concept of business information communication. Use this diagram for data communication related presentation.
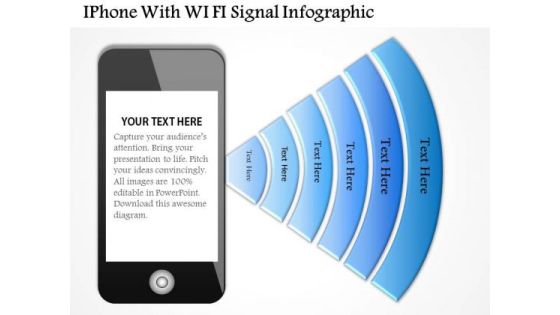
Business Diagram Iphone With Wi Fi Signal Infographic Presentation Template
This business diagram has been designed with graphic of iphone and wi-fi symbol. This diagram template contains the concept of data communication and technology. Use this diagram template for your business and technology related presentations.

Business Diagram Fishes In Ocean With Four Options Presentation Template
This power point diagram template has been designed with graphic of ocean and fish. This PPT diagram contains the concept of idea generation and data representation. Use this PPT diagram for business and marketing related presentations.

Naas Architectural Framework Network As A Service Naas Introduction Ideas PDF
This slide represents the overview of the network as a service, including its structure and various components such as remote users, branch offices, data centers, public internet, software as a service, and different internet applications. Whether you have daily or monthly meetings, a brilliant presentation is necessary. Naas Architectural Framework Network As A Service Naas Introduction Ideas PDF can be your best option for delivering a presentation. Represent everything in detail using Naas Architectural Framework Network As A Service Naas Introduction Ideas PDF and make yourself stand out in meetings. The template is versatile and follows a structure that will cater to your requirements. All the templates prepared by Slidegeeks are easy to download and edit. Our research experts have taken care of the corporate themes as well. So, give it a try and see the results.
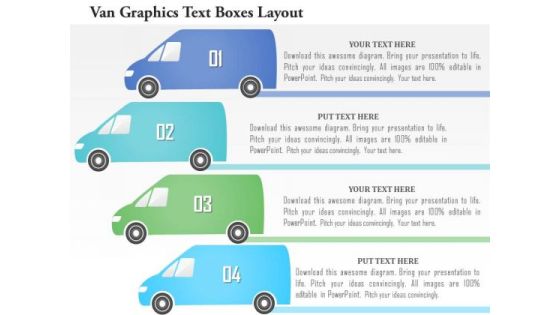
Business Diagram Van Graphics Text Boxes Layout Presentation Template
This business diagram has been designed with graphic of van style four text boxes. These text boxes are used to display data for any process. Download this diagram to build an exclusive presentation for your views.
Three Options Puzzle Diagram With Icons Powerpoint Slides
Our above slide contains graphics of three options puzzle diagram with icons. It helps to display concepts in visual manner. Use this diagram to impart more clarity to data and to create more sound impact on viewers.
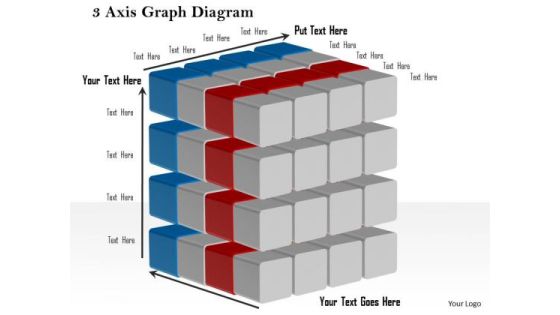
Business Framework 3 Axis Graph Diagram PowerPoint Presentation
This business diagram displays 3 axis graphs with cubes. This editable slide contains the concept of business and success. Use this diagram in your business presentations to display data in graphical manner.
Linear Arrow Process Diagram With Icons Powerpoint Template
This business slide has been designed with infographic of linear arrow. This arrow infographic can be used for data representation. Use this diagram for your business presentations. Build a quality presentation for your viewers with this unique diagram.

Busines Diagram Four Bulb Design For Text Representation Presentation Template
Four bulb design text diagram has been used to design this business slide. Use this diagram to display data in visual manner. This slide offers an excellent background to build professional presentations.

Business Diagram Four Thermometer For Entrepreneurship Statistics Presentation Template
Graphic of thermometers have been used to design this business diagram. Thermometers can be used to display entrepreneurship statistics. Use this diagram your data and information related topics in any presentation.

Business Diagram Four Colored Tablets With Text Boxes Presentation Template
Graphic of four colored tablets has been used to design this power point template diagram. This PPT diagram contains the concept of data and text representation. Use this PPT for marketing and business related presentations.
Business Diagram Navigation Icon Around Circle Presentation Template
Five staged business info graphics been used to design this power point template. This diagram contains the concept of data representation. Use this diagram for business and finance related presentations
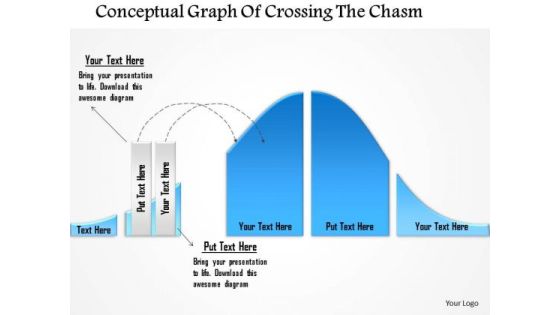
Business Diagram Conceptual Graph Of Crossing The Chasm Presentation Template
This business diagram has been designed with graphic of 3d graph. This slide contains the concept of chasm and data calculation. Use this slide to display chasm crossing condition. This business diagram adds value to your ideas.

Business Diagram Human Hand Indicating On Multiple Apps PowerPoint Template
Graphic of human hand with multiple apps has been used to craft this PPT. This PPT diagram contains the concept of app usage. Use this PPT for your technology and data related topics in any presentation.

Business Diagram Circles With Pencils For Business Structures Presentation Template
This business diagram has been designed with graphic of pencils with text circles. This slide helps to depict business data and process. Use this slide to build quality presentations for your viewers.
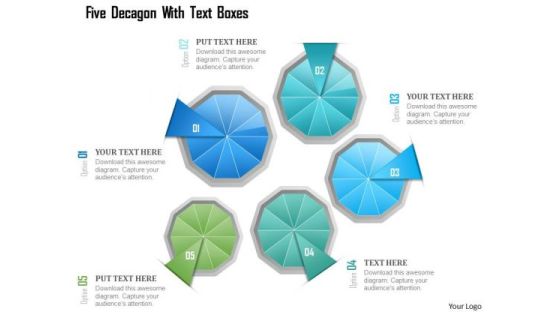
Busines Diagram Five Decagon With Text Boxes Presentation Template
This business diagram has been designed with graphic of five decagon and text boxes. This slide contains the concept of business data flow. Deliver amazing presentations to mesmerize your audience.
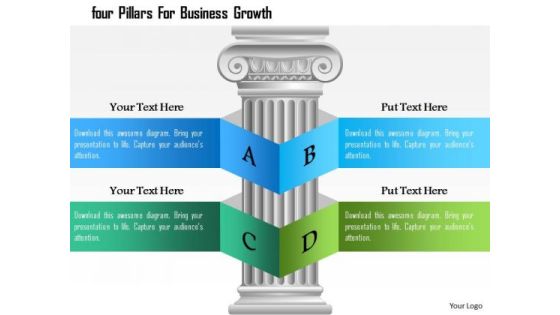
Business Diagram Four Pillars For Business Growth Presentation Template
Concept of text and data representation with business growth has been displayed in this power point template. This PPT contains the graphic of pillar and alphabet ribbons. Use this PPT diagram and get good comments from your viewers.

Business Diagram Four Design For Concept Coding Presentation Template
Four colorful text boxes has been used to craft this power point template. This PPT diagram contains the concept of coding and data representation. Use this PPT for business and technology related presentations.
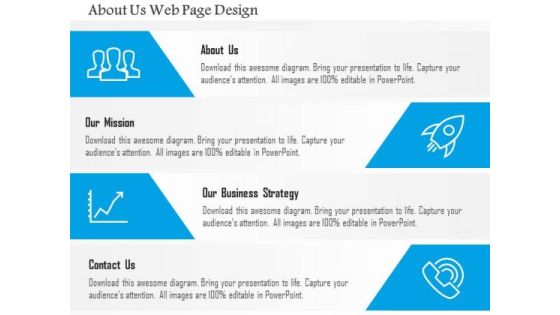
Business Diagram About Us Web Page Design Presentation Template
This power point template diagram has been designed with graphic of four icons. This PPT can represent the concept of building about us. This PPT is suitable for business and data related presentations.

Sop Strategic Plan Ppt Diagram Powerpoint Templates Microsoft
This is a sop strategic plan ppt diagram powerpoint templates microsoft. This is a six stage process. The stages in this process are production, construction, supplier, gather data and analyze, demand and supply, demand planning.

B2b Integration Design Sample Diagram Example Ppt Presentation
This is a b2b integration design sample diagram example ppt presentation. This is a four stage process. The stages in this process are adapter, protocol conversion, interaction framework, data translation.
Four Sequential Boxes And Icons Diagram Powerpoint Template
This PowerPoint template has been designed with four sequential boxes and icons. This diagram is excellent visual tools for business presentations. Download this PPT slide to explain complex data immediately and clearly.
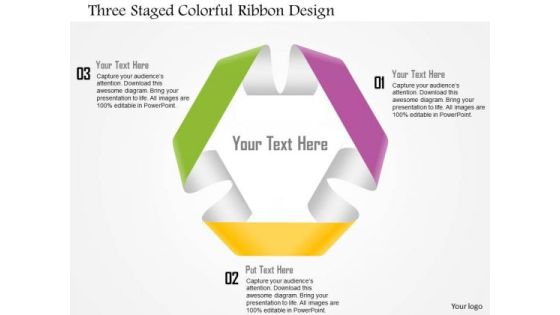
Business Diagram Three Staged Colorful Ribbon Design Presentation Template
This business diagram displays three staged circular ribbon. This Power Point slide can be used for data representation. Use this PPT slide to show flow of activities in circular manner. Get professional with this exclusive business slide.
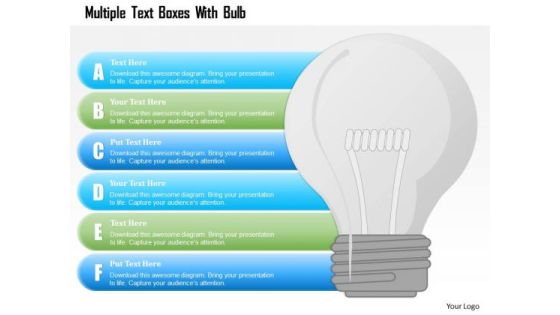
Busines Diagram Multiple Text Boxes With Bulb Presentation Template
This business diagram has been designed with graphic of multiple text boxes and bulb. This slide can be used for data representation and idea generation. Use this slide for your business and technology related presentations.

Business Diagram Four Balloons With Text Boxes PowerPoint Template
Graphic of four balloons style text box diagram has been used to design this power point template slide. This PPT slide contains the concept of business data flow. Use this PPT for your business and marketing related presentations.

Business Diagram Three Colored Text Boxes Representation PowerPoint Template
Three colored text boxes diagram has been used to design this power point template. This PPT contains the concept of process based data representation. This PPT is suitable for business and sales related presentations.

Business Diagram Six Staged Ribbon Style Text Boxes Presentation Template
Graphic of four staged diagram has been used to design this power point template slide. This PPT slide contains the data flow. This PPT slide can be used for business and marketing related presentations.
Business Diagram Three Arrows With Human Icons Presentation Template
This power point template diagram has been designed with graphic of three arrows. This PPT contains the concept of text representation. Use this PPT for business and marketing data related presentations.

Business Diagram Colorful Boxes For Business Options Presentation Template
Graphics of colorful text boxes have been used to design this power point template. This diagram contains the concept of data representation. Illustrate your ideas and imprint them in the minds of your team with this template.

Business Diagram Graphics Of Three Pen Drives Presentation Template
Graphic of three pen drives has been sued to craft this power point template diagram. This PPT contain the concept of data storage and safety. Use this PPT for business and technology related presentations.

Business Diagram Of Two Text Boxes With Globe Presentation Template
This power point template has been designed with graphic of two text boxes and globe. This PPT contains the concept of global business data representation. Use this PPT for your global business related topics in any presentation.
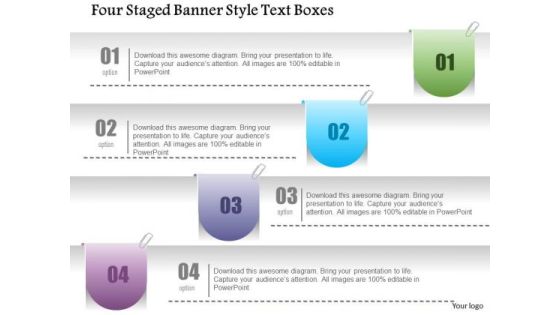
Business Diagram Four Staged Banner Style Text Boxes PowerPoint Template
Four staged banner style text boxes are used to craft this power point template slide. This PPT slide contains the concept of data updating and representation. Use this PPT and crate an impact on your viewers.
Business Diagram Five Steps With Icons Presentation Template
Five staged text boxes are used to design this power point template. This PPT contains the concept of data and text representation. Use this PPT for your business and marketing related presentations.

Business Diagram Three Paper Clips For Text Representation Presentation Template
Three paper clips are used to design this power point template slide. This PPT slide has been crafted for data representation techniques. Use this PPT slide for your business and marketing related presentations.
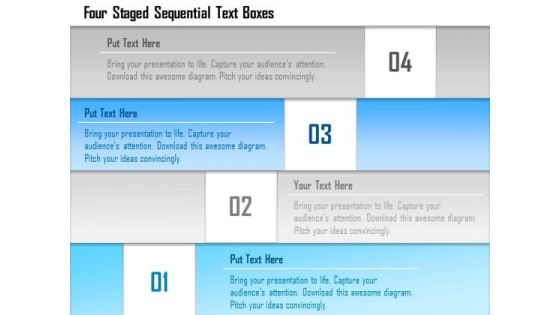
Business Diagram Four Staged Sequential Text Boxes Presentation Template
Four staged sequential stair designed text boxes are used to design this power point template. This PPT contains the concept of data flow. Use this PPT for your business and finance related presentations.
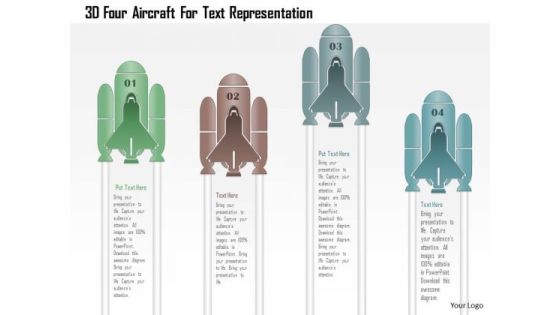
Business Diagram 3d Four Aircraft For Text Representation PowerPoint Template
Graphic of 3d four aircraft text boxes has been used to design this power point template. This PPT slide contains the concept of data flow. Use this PPT slide for business and sales related presentations.
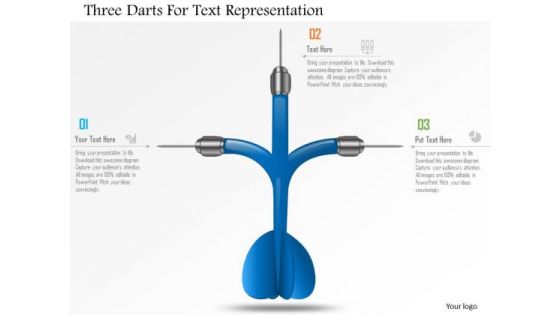
Business Diagram Three Darts For Text Representation Presentation Template
Graphic of three darts has been used to design this power point template. This PPT contains the concept of data representation. Use this PPT and build an exclusive presentation for your viewers.

Business Diagram Business People Over Bar Chart PowerPoint Template
This Power Point template has been designed with graphic of business people and bar chart. This PPT contains the concept of result analysis and business data display. Use this PPT slide for your business and marketing related presentations.

Business Diagram Three Circular Financial Pie Chart PowerPoint Template
This power point template has been designed with graphic of three circular pie chart. This pie chart is suitable for financial data representation. Use this PPt for your business and finance related presentations.

Circle Diagram For Business Marketing Mix Powerpoint Slides
This PowerPoint template has been designed with nine steps circle chart. This PPT slide can be used to prepare presentations for profit growth report and also for financial data analysis. You can download finance PowerPoint template to prepare awesome presentations.

Driver Attention Monitoring Software Block Diagram Demonstration PDF
This slide represents block diagram of driver monitoring system. It depicts data related to NXP and Non-NXP and other technology and shows transfer of data from motion sensor and PMIC to MCU MPU etc. Pitch your topic with ease and precision using this Driver Attention Monitoring Software Block Diagram Demonstration PDF. This layout presents information on Optional Technology, NXP Technology, Non NXP Technology. It is also available for immediate download and adjustment. So, changes can be made in the color, design, graphics or any other component to create a unique layout.
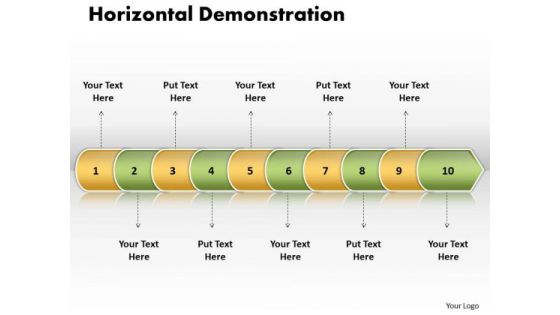
Ppt Linear Arrow 10 Phase Diagram PowerPoint Templates
PPT linear arrow 10 phase diagram PowerPoint Templates-Use this PowerPoint diagram to define basic work and data flow and quality management processes to increase efficiency of your business.-PPT linear arrow 10 phase diagram PowerPoint Templates-Arrow, Background, Collection, Completed, Concept, Confirmation, Design, Flow, Graph, Graphic, Illustration, Indication, Indicator, Information, Instruction, Interface, Internet, Layout, Measurement, Order, Phase, Pointer, Process, Progress, Reflection, Scale, Shape, Sign

Ppt Linear Arrow 9 State Diagram PowerPoint Templates
PPT linear arrow 9 state diagram PowerPoint Templates-Use this PowerPoint diagram to define basic work and data flow and quality management processes to increase efficiency of your business.-PPT linear arrow 9 state diagram PowerPoint Templates-Arrow, Background, Collection, Completed, Concept, Confirmation, Design, Flow, Graph, Graphic, Illustration, Indication, Indicator, Information, Instruction, Interface, Internet, Layout, Measurement, Order, Phase, Pointer, Process, Progress, Reflection, Scale, Shape, Sign

Business Diagram Seven Staged Banner Style Text Boxes Presentation Template
Seven staged horizontal cut has been used to design this business diagram. This slide is useful for data display. Use this rainbow colored diagram to depict seven steps of any business process. It helps in clearly conveying your message to clients and audience

Business Diagram Six Staged Multicolored Linear Text Boxes Presentation Template
Six staged horizontal cut has been used to design this business diagram. This slide is useful for data display. Use this rainbow colored diagram to depict six steps of any business process. It helps in clearly conveying your message to clients and audience
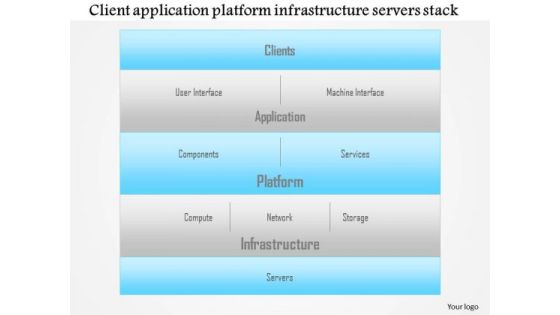
Business Diagram Client Application Platform Infrastructure Servers Stack Presentation Template
This business diagram displays client application platform infrastructure servers stack. This power point slide has been designed with graphic of vertical text box design. This text box can be used for displaying client application and platform infrastructure of servers. Use this diagram for data technology and communication related topics.

Process Of B2b Integration Framework Diagram Ppt Examples
This is a process of b2b integration framework diagram ppt examples. This is a ten stage process. The stages in this process are content development, customer development, technologies and tools, network community development, reusable industry content, implementation methodology, data transformation accelerators, enterprise email framework, enterprise logger, custom program.

Investment Management And Administration Sample Diagram Ppt Ideas
This is a investment management and administration sample diagram ppt ideas. This is a ten stage process. The stages in this process are investment analysis, portfolio and blend construction, transition management, execution, risk control, corporation actions, custody and fees, performance reporting, web reporting data feed, portfolio updates, investment management and administration.

Design And Consulting Process Diagram Powerpoint Slide Deck
This is a design and consulting process diagram powerpoint slide deck. This is a three stage process. The stages in this process are workflow, wireframes, technical design, visual design, discovery, planning, development, project brief, user profiles, asset inventory, technical specifications, implement, integration, data entry, quality assurance.
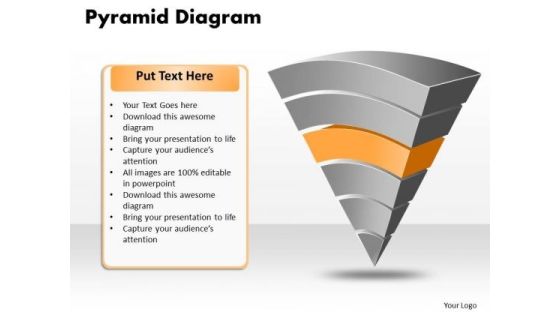
Ppt Pyramid Diagram Model Templates PowerPoint Free Download Trial
PPT pyramid diagram model templates powerpoint free download trial-The PowerPoint Presentations with pyramid diagrams can be to its best use when items in the template are arranged in such a way to represent the proportional, interconnected and hierarchical structure, quantity and size. Use our creative template to lay down your views.-PPT pyramid diagram model templates powerpoint free download trial-Business, Chart, Color, Data Pyramid, Diagram, Graph, Group, Growth, Hierarchy, Illustration, Layer, Layered, Layered Pyramid, Level, Multicolor, Object, Performance, Presentation, Progress, Pyramid, Rank, Seam, Segment, Set, Shape, Stage, Structure, Symbol, System, Top

Ppt Pyramid Diagram Design PowerPoint Presentation Layout Templates
PPT pyramid diagram design powerpoint presentation layout Templates-Your ideas are fundamentally stable with a broad base of workable possibilities. Illustrate these thoughts with this slide. Discuss each one and slowly but surely move up the pyramid narrowing down to the best and most success oriented project.-PPT pyramid diagram design powerpoint presentation layout Templates-Business, Chart, Color, Data Pyramid, Diagram, Graph, Group, Growth, Hierarchy, Illustration, Layer, Layered, Layered Pyramid, Level, Multicolor, Object, Performance, Presentation, Progress, Pyramid, Rank, Seam, Segment, Set, Shape, Stage, Structure, Symbol, System, Top
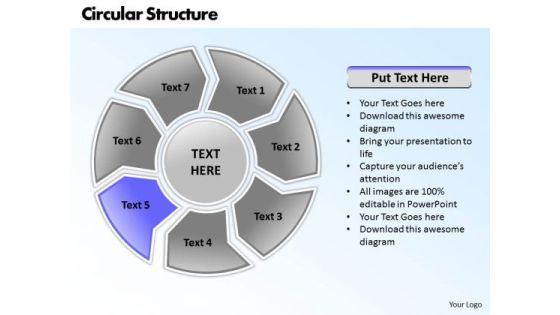
Ppt PowerPoint Presentation Circular Structure 7 Phase Diagram Templates
PPT powerpoint presentation circular structure 7 phase diagram Templates-This Diagram makes information accessible throughout the organization with a collective, visible view of critical data from different perspectives and providing the tools to upcoming business scenarios and plan for change. -PPT powerpoint presentation circular structure 7 phase diagram Templates-Arrow, Art, Blue, Business, Button, Circular, Clip, Design, Diagram, Drop, Element, Glowing, Graph, Graphic, Icon, Illustration, Isolated, Process, Round, Set, Shadow, Sphere, Symbol

Recommendation Techniques Content Based Recommendation Systems Flow Diagram Demonstration PDF
This slide demonstrate the working of content-based recommendation system. The purpose of this slide is to illustrate the flow diagram of content-based filtering. The steps include data storage, data processing, model training, deploy and visualize. This Recommendation Techniques Content Based Recommendation Systems Flow Diagram Demonstration PDF is perfect for any presentation, be it in front of clients or colleagues. It is a versatile and stylish solution for organizing your meetings. The Recommendation Techniques Content Based Recommendation Systems Flow Diagram Demonstration PDF features a modern design for your presentation meetings. The adjustable and customizable slides provide unlimited possibilities for acing up your presentation. Slidegeeks has done all the homework before launching the product for you. So, do not wait, grab the presentation templates today

Performance Challenges In Multi Cloud Architectures And Strategies To Mitigate Problem Themes PDF
This slide covers the performance challenges in multi cloud architecture and solutions to overcome the challenges such as networking between clouds and scaling limitations. This is a Performance Challenges In Multi Cloud Architectures And Strategies To Mitigate Problem Themes PDF template with various stages. Focus and dispense information on one stages using this creative set, that comes with editable features. It contains large content boxes to add your information on topics like Networking Between Clouds, Cloud Monitoring Tools, Performance Challenge. You can also showcase facts, figures, and other relevant content using this PPT layout. Grab it now.

Pyramid Guidelines Diagram To Increase Product Sales Structure PDF
The slide highlights a diagram of pyramid principle to increase product sales and business growth. It includes key elements like business objective, arguments and supporting facts. Showcasing this set of slides titled Pyramid Guidelines Diagram To Increase Product Sales Structure PDF. The topics addressed in these templates are Arguments, Data Supporting Arguments. All the content presented in this PPT design is completely editable. Download it and make adjustments in color, background, font etc. as per your unique business setting.

Ppt Continuous Process Social Presentation Startegy Diagram PowerPoint Templates
PPT continuous process social presentation startegy diagram PowerPoint Templates-This Diagram makes information accessible throughout the organization with a collective, visible view of critical data from different perspectives and providing the tools to upcoming business scenarios and plan for change. This image has been professionally designed to emphasize the concept of sequential process using layers represented through arrow. -PPT continuous process social presentation startegy diagram PowerPoint Templates-3d, Air, Arrow, Art, Business, Chart, Clip, Clipart, Cooling, Diagram, Drip, Drop, Dry, Energy, Eps10, Evaporate, Evaporating, Evaporation, Graphic, Heat, Icon, Illustration, Isolated, Isometric, Layers, Material, Moisture, Process
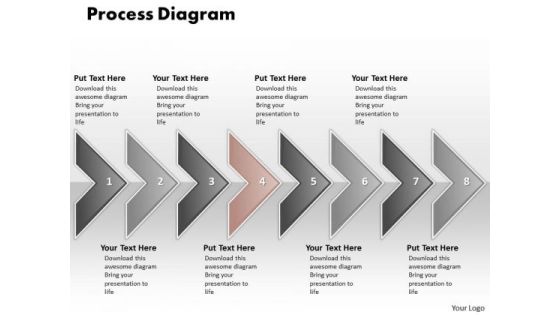
Ppt Eight Phase Diagram Social Media PowerPoint Presentation Process Templates
PPT eight phase diagram social media powerpoint presentation process Templates-This Diagram is used to illustrate how information will move between interrelated systems in the accomplishment of a given function, task or process. The visual description of this information flow with each given level showing how data is fed into a given process step and subsequently passed along at the completion of that step.-PPT eight phase diagram social media powerpoint presentation process Templates-Aim, Arrow, Badge, Border, Color, Connection, Curve, Design, Direction, Download, Icon, Illustration, Indicator, Internet, Label, Link, Magenta, Mark, Next, Object, Orientation, Paper, Peeling, Pointer, Rounded, Set, Shadow, Shape, Sign

Information Protection Risk Management Committee Diagram Information PDF
This slide shows flow chart of cyber protection risk management team of an organization. It includes cyber protection system deployment team, data center management, network member, etc. Persuade your audience using this Information Protection Risk Management Committee Diagram Information PDF. This PPT design covers four stages, thus making it a great tool to use. It also caters to a variety of topics including Information Security Head, Information Security Audit Scan, Network Member. Download this PPT design now to present a convincing pitch that not only emphasizes the topic but also showcases your presentation skills.
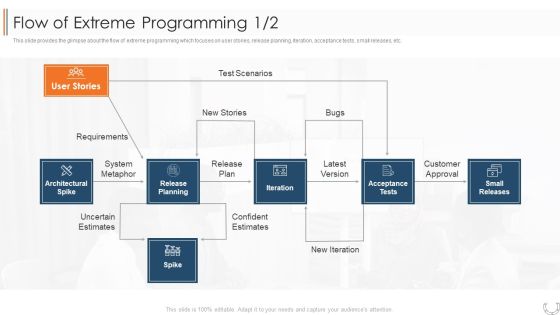
Various Agile Methodologies Flow Of Extreme Programming Architectural Ppt Styles Design Ideas PDF
This slide provides the glimpse about the flow of extreme programming which focuses on user stories, release planning, iteration, acceptance tests, small releases, etc. Presenting various agile methodologies flow of extreme programming architectural ppt styles design ideas pdf to provide visual cues and insights. Share and navigate important information on seven stages that need your due attention. This template can be used to pitch topics like user stories, architectural spike, release planning, iteration, acceptance tests, small releases, spike. In addtion, this PPT design contains high resolution images, graphics, etc, that are easily editable and available for immediate download.
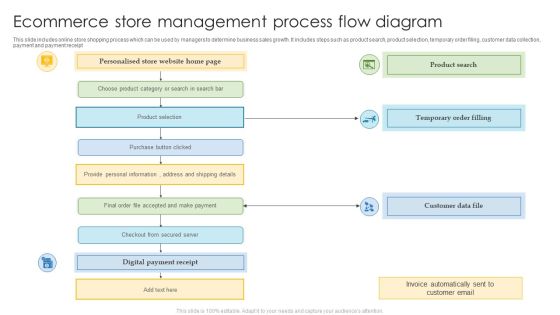
Ecommerce Store Management Process Flow Diagram Structure PDF
This slide includes online store shopping process which can be used by managers to determine business sales growth. It includes steps such as product search, product selection, temporary order filing, customer data collection, payment and payment receipt. Showcasing this set of slides titled Ecommerce Store Management Process Flow Diagram Structure PDF. The topics addressed in these templates are Invoice Automatically, Digital Payment, Personal Information. All the content presented in this PPT design is completely editable. Download it and make adjustments in color, background, font etc. as per your unique business setting.

5G Evolution Architectural Technology Determine SA Vs NSA In 5G And Their Equipment Readiness Icons PDF
This slide provides details regarding comparative assessment of SA and NSA in 5G and addressing their equipment readiness. Deliver an awe inspiring pitch with this creative 5G Evolution Architectural Technology Determine SA Vs NSA In 5G And Their Equipment Readiness Icons PDF bundle. Topics like Rendering Enhanced, Broadband Services, Configuration Is Feasible can be discussed with this completely editable template. It is available for immediate download depending on the needs and requirements of the user.

5G Evolution Architectural Technology Determine Competitive Landscape Of 5G Icons PDF
This slide provides details regarding competitive landscape of 5G along with other technologies in terms of latency, mobility, coverage and bandwidth. Deliver an awe inspiring pitch with this creative 5G Evolution Architectural Technology Determine Competitive Landscape Of 5G Icons PDF bundle. Topics like Reasonably Secured, Several Seconds, Coverage can be discussed with this completely editable template. It is available for immediate download depending on the needs and requirements of the user.

 Home
Home