Data Architecture Diagram
Five Banners With Communication And Technology Icons Powerpoint Template
This PowerPoint template has been designed with five banners and communication technology icons. This diagram is excellent visual tools for business presentations. Download this PPT slide to explain complex data immediately and clearly.
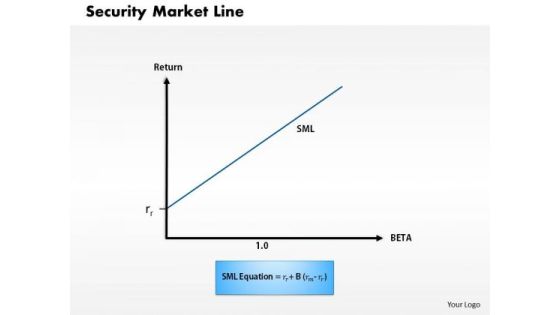
Business Framework Security Market Line 1 PowerPoint Presentation
This diagram displays graph of security market line. You can use line graph to plot changes in data over time, such as monthly revenue and earnings changes or daily changes in stock market prices.

Business Framework Security Market Line 11 PowerPoint Presentation
This diagram displays graph of security market line. You can use line graph to plot changes in data over time, such as monthly revenue and earnings changes or daily changes in stock market prices.

Five Banners For Management Development Process Powerpoint Template
This PowerPoint template has been designed with graphics of five text banners and icons. This diagram may be sued to display management development process. Download this PPT slide to explain complex data immediately and clearly.
Navigation Point Four Banners And Icons Powerpoint Template
This PowerPoint template has been designed with four banners icons. This diagram is excellent visual tools for business presentations. Download this PPT slide to explain complex data immediately and clearly.
Four Staged Numeric Banners With Icons Powerpoint Template
This PowerPoint template has been designed with four staged numeric banners icons. This diagram is excellent visual tools for business presentations. Download this PPT slide to explain complex data immediately and clearly.

Business Team About Us Page Powerpoint Slides
This PowerPoint template has been designed with team pictures and business icons. This diagram is excellent visual tools to present teams strategic planning. Download this PPT slide to explain complex data immediately and clearly.
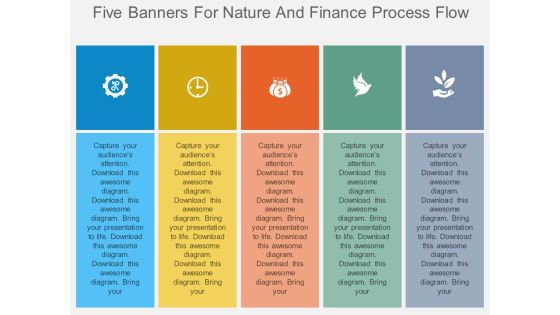
Five Banners For Nature And Finance Process Flow Powerpoint Template
This PowerPoint template has been designed with five banners nature, finance icons. This diagram is excellent visual tools for business presentations. Download this PPT slide to explain complex data immediately and clearly.

Team Pictures With Names And Profile Powerpoint Slides
This PowerPoint template has been designed with team pictures and profile information. This diagram is excellent visual tools to present team profile. Download this PPT slide to explain complex data immediately and clearly.
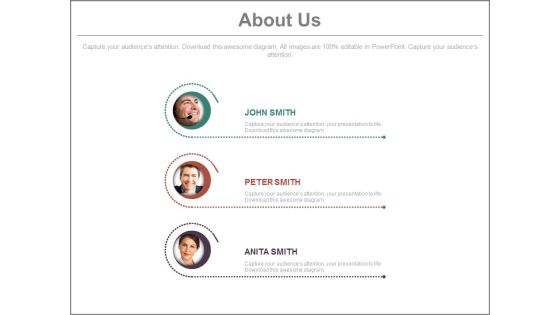
Team Profiles For About Us Slide Powerpoint Slides
This PowerPoint template has been designed with team pictures and profile information. This diagram is excellent visual tools to present team profile. Download this PPT slide to explain complex data immediately and clearly.

Business People Profile For Social Media Powerpoint Slides
This PowerPoint template has been designed with business people profile information. This diagram is excellent visual tools to present team profile with social media. Download this PPT slide to explain complex data immediately and clearly.

Three Arrow For Team Members Profile Powerpoint Slides
This PowerPoint template has been designed with three arrows and team pictures. This diagram is excellent visual tools for business presentations. Download this PPT slide to explain complex data immediately and clearly.
Four Arrows For Different Process Representation Powerpoint Template
This PowerPoint template has been designed with graphics of four arrows This diagram is excellent visual tools for business presentations. Download this PPT slide to explain complex data immediately and clearly.

Ppt Linear Process Flow PowerPoint Template Arrow-4 Stages Templates
PPT linear process flow powerpoint template arrow-4 stages Templates-Use this diagram as a method of graphically representing the flow of data through an information processing system.-PPT linear process flow powerpoint template arrow-4 stages Templates-Abstract, Arrow, Arrow Chart, Business, Design, Development, Diagram, Direction, Element, Flow, Flow Chart, Flow Diagram, Flowchart, Graph, Linear, Management, Model, Motion, Organization, Plan, Process, Process Arrows, Process Chart, Process Diagram, Process Flow, Program, Section, Segment, Set, Sign, Solution, Strategy, Symbol, Technology

PowerPoint Design Gear Process Company Ppt Template
PowerPoint Design Gear Process Company PPT Template-This PowerPoint diagram shows three gears that represent three processes. You can add data depending on the number of processes you want to include in your presentation.-PowerPoint Design Gear Process Company PPT Template

Pie Charts For Financial Ratio Analysis Powerpoint Slides
This PowerPoint template has been designed with diagram of pie charts. This PPT slide can be used to prepare presentations for profit growth report and also for financial data analysis. You can download finance PowerPoint template to prepare awesome presentations.

Bar Graph For Marketing Research Process Powerpoint Slides
This PowerPoint template has been designed with diagram of bar graph. This PPT slide can be used to prepare presentations for profit growth report and also for financial data analysis. You can download finance PowerPoint template to prepare awesome presentations.

PowerPoint Designs Process Chart Strategy Ppt Slide
PowerPoint Designs process Chart Strategy PPT Slide-This Process Chart can be used as data flow diagram to show the flow of the data as it moves from beginning process to end result.-3d, arrow, art, business, chart, circle, concept, connection, cycle, development, diagram, direction, element, environment, finance, financial, flow, graphic, group, investment, isolated, market,, movement, organization, passive income, perspective, presentation, process chart, recycle, report, sign, step, success, symbol, teamwork-PowerPoint Designs process Chart Strategy PPT Slide

PowerPoint Slide Designs Process Chart Company Ppt Slides
PowerPoint Slide Designs process chart Company PPT Slides-This Process Chart can be used as data flow diagram to show the flow of the data as it moves from beginning process to end result.-3d, art, business, chart, circle, concept, connection, cycle, development, diagram, direction, element, environment, finance, financial, flow, graphic, group, investment, isolated, market,, movement, organization, passive income, perspective, presentation, process chart, recycle, report, sign, step, success, symbol, teamwork-PowerPoint Slide Designs process chart Company PPT Slides

Bar Chart Analytics Vector Icon With Text Holders Ppt Powerpoint Presentation File Background Designs
This is a bar chart analytics vector icon with text holders ppt powerpoint presentation file background designs. The topics discussed in this diagram are data management icon, big data icon. This is a completely editable PowerPoint presentation, and is available for immediate download.

Perspective Performance Indicator Ppt Powerpoint Slide Designs
This is a perspective performance indicator ppt powerpoint slide designs. This is a seven stage process. The stages in this process are performance indicator, perspective, unit, description formula, data source, measurement instrument, method of test how, frequency when, decision criteria, data collector who, owner, baseline, target, process diagram or drawings.
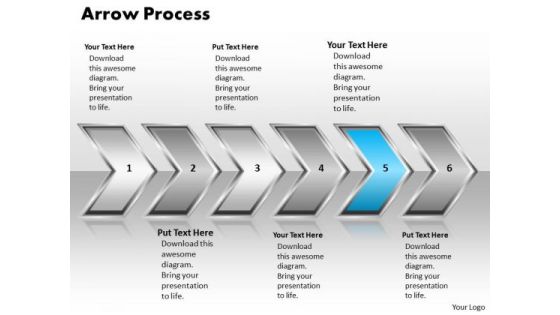
Ppt Pointing Arrow Process 6 Create PowerPoint Macro Templates
PPT pointing arrow process 6 create powerpoint macro Templates-Use this diagram as a method of graphically representing the flow of data as an information processing system. Use this PPT to represent data that is easy to comprehend and analyze. This PowerPoint diagram can be used in strategy, consulting and marketing presentations.-PPT pointing arrow process 6 create powerpoint macro Templates-Aim, Arrow, Arrowheads, Badge, Border, Click, Connection, Curve, Design, Direction, Download, Element, Fuchsia, Icon, Illustration, Indicator, Internet, Magenta, Mark, Object, Orientation, Pointer, Shadow, Shape, Sign

4 Interrelated Components Displaying Concepts Circular Flow Chart PowerPoint Slides
We present our 4 interrelated components displaying concepts Circular Flow Chart PowerPoint Slides.Download our Circle Charts PowerPoint Templates because your brain is always churning out ideas like cogs in a wheel. Download and present our Abstract PowerPoint Templates because you have what it takes to grow. Download and present our Arrows PowerPoint Templates because this slide illuminates the spiritual brilliance of Jesus and showers the love for mankind he showed even while being crucified. Present our Business PowerPoint Templates because the great Bald headed Eagle embodies your personality. the eagle eye to seize upon the smallest of opportunities. Present our Flow Charts PowerPoint Templates because your quicksilver ideas are the arrows in your quiver.Use these PowerPoint slides for presentations relating to 3d, architecture, blue, business, chat, chatting, communication, community, component, computer, concept, connection, contact, digital, display, equipment, global, globalization, group, information, internet, interrelation, isolated, link, media, medium, network,organization, scope, social, society, sphere, spherical, structure, symbol, technology, telecommunication, television, union, unity, virtual, web, white, www. The prominent colors used in the PowerPoint template are Red, Yellow, Green. Presenters tell us our 4 interrelated components displaying concepts Circular Flow Chart PowerPoint Slides are Charming. You can be sure our component PowerPoint templates and PPT Slides are Detailed. Professionals tell us our 4 interrelated components displaying concepts Circular Flow Chart PowerPoint Slides are Quaint. People tell us our business PowerPoint templates and PPT Slides are Spiffy. People tell us our 4 interrelated components displaying concepts Circular Flow Chart PowerPoint Slides are Elevated. Professionals tell us our blue PowerPoint templates and PPT Slides are Cheerful.

1 Global Communication With Globe In The Middle And Customers With Mobile Devices Ppt Slides
This diagram has been designed with concept of global communication. This diagram displays 3D people standing around globe with communication icons. This diagram is perfect to signify concepts of business and technology.

1 Global Communication With Wireless Devices Connected To The Cloud Shown By The Globe Ppt Slides
This diagram has a design of wireless devices connected to globe. Concept of wireless network can be explained with this diagram. This diagram with graphics of wireless devices is appropriate for technology related concepts.

1 Global Communication With Interconnected Devices Connected To A Centralized Cloud Ppt Slides
Captivate the attention of your audience with the help of professionally designed diagram of devices connected to globe. Use this professional diagram in presentations related to global communication. Special effects of this diagram will surely interest the audience.
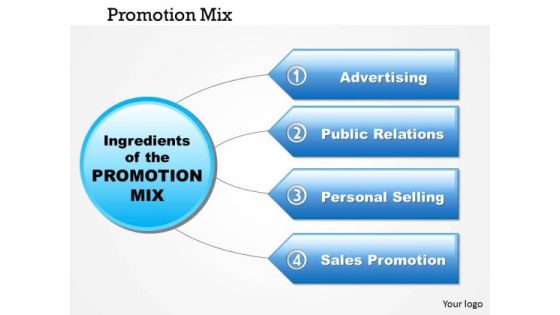
Business Framework Promotion Mix PowerPoint Presentation
This innovative diagram has been designed to display project management data. Use this diagram in business and marketing presentations. This diagram will enhance the quality of your presentations.

Four Layered Venn Design For Business Powerpoint Slides
This power point template has been designed with graphic of four layered Venn diagram. Use this Venn diagram for business strategy and analysis. Illustrate your ideas and imprint them in the minds of your team with this template.

Tablet For Finance Planning And Analysis PowerPoint Template
Our professionally designed business diagram is as an effective tool for communicating ideas and planning. It contains graphics of tablet with various symbols. Convey your views with this diagram slide. It will amplify the strength of your logic.
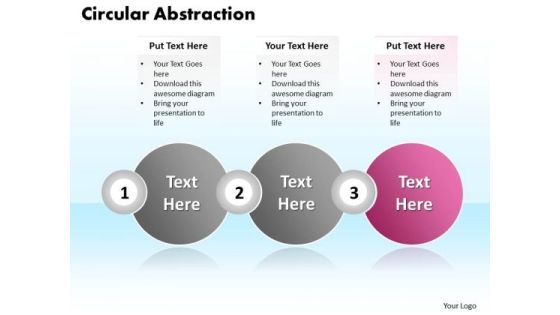
Ppt Circular Motion PowerPoint Abstraction Of Three Text Boxes Templates
PPT circular motion powerpoint abstraction of three text boxes Templates-Use this 3D PowerPoint Diagram to describe three steps to make efficient use of Limited resources through circular Boxes. This diagram shows the Pink Circular box explaining its significance. It can be used to represent global business issues such as financial data, stock market Exchange, increase in sales, corporate presentations and more. PowerPoint text boxes diagrams are designed to help you place your text in a professional layout. You can change color, size and orientation of any icon to your liking.-PPT circular motion powerpoint abstraction of three text boxes Templates-Abstract, Art, Artistic, Backdrop, Background, Bend, Black, Business, Circle, Copy-Space, Create, Design, Dot, Dotted, Draw, Element, Flower, Gradient, Grid, Icon, Illustration, Leaf, Leaves, Logo, Mold, Motif, Nature, Pattern, Petal, Radiate, Retro, Round
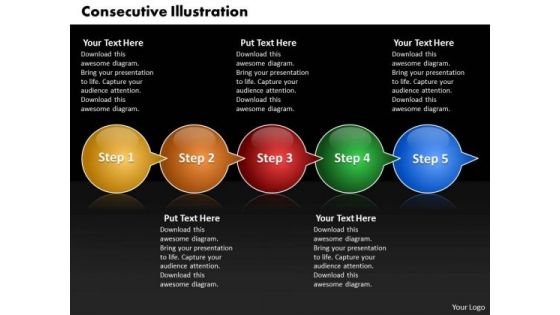
Ppt Consecutive Example Of 5 PowerPoint Slide Numbers Through Arrows Templates
PPT consecutive example of 5 powerpoint slide numbers through arrows Templates-The above template displays a diagram of circles connected with arrows. This is a graphic organizer for recording related ideas about a concept. It can be used to emphasize direction of movement and interconnections of stages in a flow. Deliver amazing presentations to mesmerize your audience.-PPT consecutive example of 5 powerpoint slide numbers through arrows Templates-3d, Abstract, Arrow, Circle, Circular, Click, Computer, Data, Direction, Graphic, Icon, Illustration, Insignia, Intention, Internet, Isolated, Label, Mail, Mascot, Media, Menu, Motion, Page, Pushing, Search, Shiny, Sign, Simple, Symbol
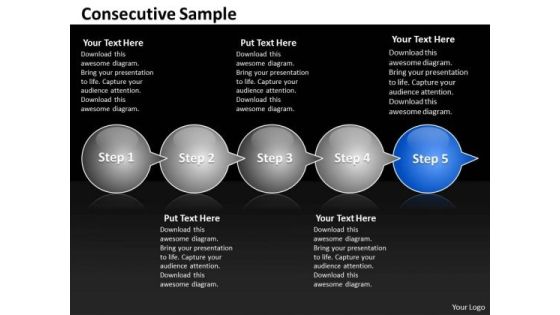
Ppt Consecutive Sample Of 5 Steps Through Curved Arrows PowerPoint 2010 Templates
PPT consecutive sample of 5 steps through curved arrows powerpoint 2010 Templates-The above template displays a diagram of circles connected with arrows. This is a graphic organizer for recording related ideas about a concept. It can be used to emphasize direction of movement and interconnections of stages in a flow. Deliver amazing presentations to mesmerize your audience.-PPT consecutive sample of 5 steps through curved arrows powerpoint 2010 Templates-3d, Abstract, Arrow, Circle, Circular, Click, Computer, Data, Direction, Graphic, Icon, Illustration, Insignia, Intention, Internet, Isolated, Label, Mail, Mascot, Media, Menu, Motion, Page, Pushing, Search, Shiny, Sign, Simple, Symbol
Ppt Design PowerPoint Presentation Of Confused Emoticon Templates
PPT design powerpoint presentation of confused emoticon Templates-This PowerPoint Diagram shows you the Designs of Confused emoticons expressing their Situation. This Diagram signifies the concept of frustration, fuddle, mess up, mislead, mortify, muddle, mystify, obscure, perplex, perturb, puzzle, shame, stir up, trouble, unhinge, unsettle, upset, and worry.-PPT design powerpoint presentation of confused emoticon Templates
Ppt PowerPoint Design Download 2009 Of Confused Emoticon Templates
PPT powerpoint design download 2009 of confused emoticon Templates-This PowerPoint Diagram shows you the Designs of Confused emoticons expressing their Situation. This Diagram signifies the concept of frustration, fuddle, mess up, mislead, mortify, muddle, mystify, obscure, perplex, perturb, puzzle, shame, stir up, trouble, unhinge, unsettle, upset, and worry.-PPT powerpoint design download 2009 of confused emoticon Templates

Ppt Design PowerPoint 2007 Of A Cheerful Smiley Templates
PPT design powerpoint 2007 of a cheerful smiley Templates-Use this Astonishing 3D PowerPoint Diagram to express the Cheerful Situation. This Diagram symbolizes Victory, Happiness, enjoyment, joviality, joy, jubilation, laughter, lightheartedness, merriment, mirth, optimism, paradise, peace of mind. -PPT design powerpoint 2007 of a cheerful smiley Templates
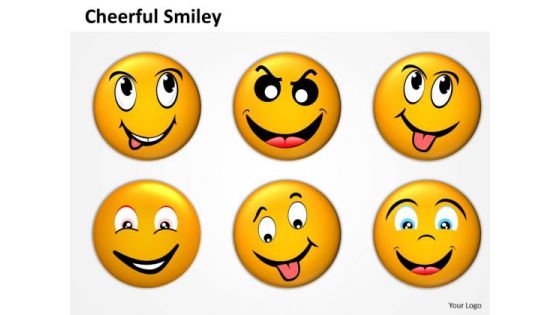
Ppt Interior Design PowerPoint Presentation Of Cheerful Smiley Templates
PPT interior design powerpoint presentation of cheerful smiley Templates-Use this Astonishing 3D PowerPoint Diagram to express the Cheerful Situation. This Diagram symbolizes Victory, Happiness, enjoyment, joviality, joy, jubilation, laughter, lightheartedness, merriment, mirth, optimism, paradise, peace of mind. -PPT interior design powerpoint presentation of cheerful smiley Templates
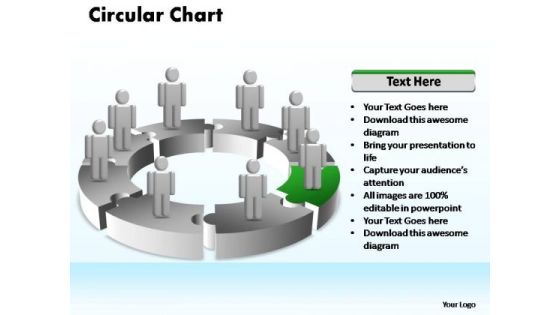
PowerPoint Backgrounds Process Circular Ppt Designs
PowerPoint Backgrounds Process Circular PPT Designs-Precision is what the users demand and seek for in a market that is getting increasingly complex. use this diagram to expalin this complex marketing process-PowerPoint Backgrounds Process Circular PPT Designs

3D Brain On Human Hand Powerpoint Templates
Our above PPT slide contains graphics of 3d brain on human hand. This business diagram may be used to display concepts like strategy and creativity. Use this diagram to impart more clarity to data and to create more sound impact on viewers.

Business Framework Kaiser Ideo Analysis Synthesis Bridge Model PowerPoint Presentation
This diagram displays Kaiser IDEO analysis synthesis bridge model. It contains circular diagram in four segments. The bridge model illustrates storytelling and analysis, brainstorming and concept generation, design research and data gathering, prototyping and concept generation. Use this model to frame research results to act as a basis for framing future possibilities.
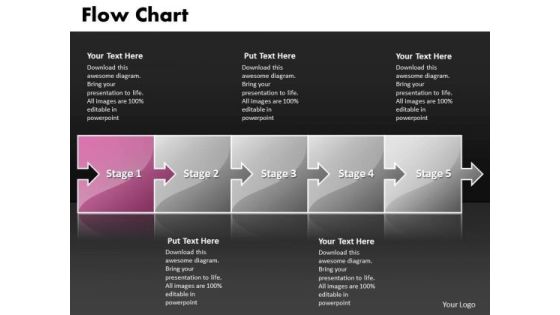
Ppt Puzzle Communication Process PowerPoint Presentation Business Layout Templates
PPT puzzle communication process powerpoint presentation business layout Templates-Our above Puzzle diagram template is a schematic representation of a process.Employ the right colours for your brilliant ideas. Help your viewers automatically empathise with your thoughts. Our cleverly selected background hues are guaranteed to achieve this aim.-PPT puzzle communication process powerpoint presentation business layout Templates-Abstract, Arrow, Arrow, Chart, Business, Design, Development, Diagram, Direction, Element, Flow, Flow, Chart, Flow, Diagram, Flowchart, Graph, Linear, Management, Model, Motion, Organization, Plan, Process, Process, Arrows, Process, Chart, Process, Diagram, Process, Flow, Program, Section, Segment, Set, Sign, Solution, Strategy, Symbol, Technology
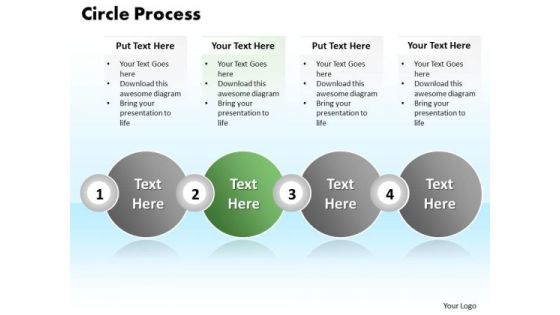
Ppt 4 Stages Text Circle Diamond Mining Process PowerPoint Presentation Templates
PPT 4 stages text circle diamond mining process powerpoint presentation Templates-Use this Circular Operation Chart Diagram in Business Presentations. This PowerPoint diagram can be used for information flow, business process automation, business process re-engineering and other business related issues.-PPT 4 stages text circle diamond mining process powerpoint presentation Templates-Abstract, Art, Artistic, Backdrop, Background, Bend, Black, Business, Circle, Copy-Space, Create, Design, Dot, Dotted, Draw, Element, Flower, Gradient, Grid, Icon, Illustration, Leaf, Leaves, Logo, Mold, Motif, Nature, Pattern, Petal, Radiate, Retro, Round

PowerPoint Backgrounds Cycle Process Graphic Ppt Designs
PowerPoint Backgrounds Cycle Process Graphic PPT Designs-Represent your data on this diagram in a meaningful and concise manner. This Cycle Process Diagram is type of graphic organizer that shows how items are related to one another in time-oriented cycle.-PowerPoint Backgrounds Cycle Process Graphic PPT Designs

PowerPoint Backgrounds Marketing Circular Ppt Slides
PowerPoint Backgrounds Marketing Circular PPT Slides-Precision is what the users demand and seek for in a market that is getting increasingly complex. use this diagram to expalin this complex marketing process-PowerPoint Backgrounds Marketing Circular PPT Slides
Three Overlapping Circles With Business Icons Powerpoint Slides
This power point template has been designed with three overlapping circles and business icons. Use this Venn diagram for business planning and strategy analysis. Illustrate your ideas and imprint them in the minds of your team with this template.
Ppt PowerPoint Design Download Of An Emoticon Showing Angry Face Templates
PPT powerpoint design download of an emoticon showing angry face Templates-Use this Business PowerPoint Diagram to represent different types of angry faces. It portrays the concept of animosity, annoyance, antagonism, ill humor, ill temper, impatience, indignation, infuriation, irascibility, ire, irritability, vexation, violence.-PPT powerpoint design download of an emoticon showing angry face Templates
Ppt PowerPoint Design Download Of An Emoticon Showing Angry Faces Templates
PPT powerpoint design download of an emoticon showing angry faces Templates-Use this Business PowerPoint Diagram to represent different types of angry faces. It portrays the concept of animosity, annoyance, antagonism, ill humor, ill temper, impatience, indignation, infuriation, irascibility, ire, irritability, vexation, violence.-PPT powerpoint design download of an emoticon showing angry faces Templates

Ppt Vertical 6 Steps Downward PowerPoint Templates
PPT vertical 6 steps downward PowerPoint Templates-This PowerPoint Diagram shows six arrows placed Vertically to give an effective way to present your views. This Diagram can be used to show complex processes. This can be used for Presentations on circuitous, complicated, composite, compound, compounded, confused, conglomerate, convoluted, elaborate, entangled etc. An excellent graphic to attract the attention of your audience to improve earnings.-PPT vertical 6 steps downward PowerPoint Templates-Arrow, Background, Process, Business, Chart, Diagram, Financial, Graphic, Gray, Icon, Illustration, Management, Orange, Perspective, Planning Process, Stages, Steps, Text
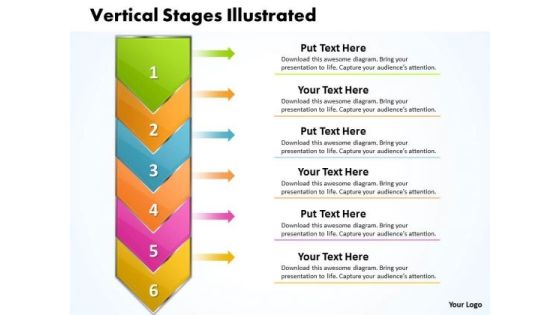
Ppt Vertical Stages Illustrated Through Arrow PowerPoint Templates
PPT vertical stages illustrated through arrow PowerPoint Templates-Use this Sequentially based PowerPoint Diagram to represent six different approaches arranged in vertical manner. It portrays the concept of convert, reclaim, recondition, recover, recycle , redeem, regenerate, remodel, reoccupy, repossess, rescue, restore, retake, salvage etc.-PPT vertical stages illustrated through arrow PowerPoint Templates-Arrow, Background, Process, Business, Chart, Diagram, Financial, Graphic, Gray, Icon, Illustration, Management, Orange, Perspective, Planning Process, Stages, Steps, Text

Pie Chart With Map Background Presentation Template
The above slide has been designed pie charts and world map in background. This slide helps to represent concept of global economy. Our unique diagram makes your presentations more professional.
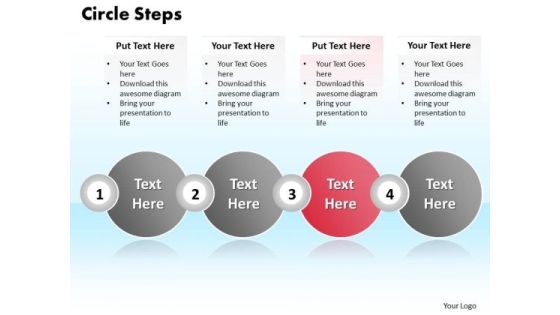
Ppt Four Practice The PowerPoint Macro Steps Text Circle Process Templates
PPT four practice the powerpoint macro steps text circle process Templates-This PowerPoint Diagram shows the Consecutive Description of Business Process explaining its 3rd stage. Use This Sequentially Described PowerPoint Diagram having four stages displayed by circular boxes pointing towards east direction signifying the completion of the procedure and attaining success.-PPT four practice the powerpoint macro steps text circle process Templates-Abstract, Art, Artistic, Backdrop, Background, Bend, Black, Business, Circle, Copy-Space, Create, Design, Dot, Dotted, Draw, Element, Flower, Gradient, Grid, Icon, Illustration, Leaf, Leaves, Logo, Mold, Motif, Nature, Pattern, Petal, Radiate, Retro, Round

Integrating Iiot To Improve Operational Efficiency Platform For Edge And Cloud Computing Infographics PDF
This slide covers block diagram of the industrial internet of things iiot platform for edge and cloud computing services. It includes elements such as data acquisition, data transfer and processing and analysis and service apps. Showcasing this set of slides titled Integrating Iiot To Improve Operational Efficiency Platform For Edge And Cloud Computing Infographics PDF. The topics addressed in these templates are Data Processing And Cleaning, Processed Data, Machine Learning. All the content presented in this PPT design is completely editable. Download it and make adjustments in color, background, font etc. as per your unique business setting.

7 Stages Complex Representation Of The Process Ppt Business Plan Wiki PowerPoint Slides
We present our 7 stages complex representation of the process ppt business plan wiki PowerPoint Slides.Download and present our Business PowerPoint Templates because Our PowerPoint Templates and Slides will bullet point your ideas. See them fall into place one by one. Download our Venn Diagrams PowerPoint Templates because You are working at that stage with an air of royalty. Let our PowerPoint Templates and Slides be the jewels in your crown. Download and present our Layers PowerPoint Templates because You can Channelise the thoughts of your team with our PowerPoint Templates and Slides. Urge them to focus on the goals you have set. Download our Circle Charts PowerPoint Templates because You can Double your output with our PowerPoint Templates and Slides. They make beating deadlines a piece of cake. Use our Shapes PowerPoint Templates because Our PowerPoint Templates and Slides will help you be quick off the draw. Just enter your specific text and see your points hit home.Use these PowerPoint slides for presentations relating to diagram, process, business, graphic, design, ideas, model, data, chart, project, schema, corporate, implementation, tag, plan, engineering, concept, vector, success, symbol, stack, circle, guide, work flow, development, shape, team, management, cycle, steps, illustration, system, strategy, objects, phase, professional, organization, implement, background, image, detail, structure, product. The prominent colors used in the PowerPoint template are Blue, Gray, White.

7 Stages Complex Representation Of The Process Business Plan Samples PowerPoint Slides
We present our 7 stages complex representation of the process business plan samples PowerPoint Slides.Download and present our Business PowerPoint Templates because You can Zap them with our PowerPoint Templates and Slides. See them reel under the impact. Present our Venn Diagrams PowerPoint Templates because Our PowerPoint Templates and Slides will let you Illuminate the road ahead to Pinpoint the important landmarks along the way. Use our Layers PowerPoint Templates because our PowerPoint Templates and Slides are the string of your bow. Fire of your ideas and conquer the podium. Use our Circle Charts PowerPoint Templates because You can Bait your audience with our PowerPoint Templates and Slides. They will bite the hook of your ideas in large numbers. Download our Shapes PowerPoint Templates because You should Ascend the ladder of success with ease. Our PowerPoint Templates and Slides will provide strong and sturdy steps.Use these PowerPoint slides for presentations relating to diagram, process, business, graphic, design, ideas, model, data, chart, project, schema, corporate, implementation, tag, plan, engineering, concept, vector, success, symbol, stack, circle, guide, work flow, development, shape, team, management, cycle, steps, illustration, system, strategy, objects, phase, professional, organization, implement, background, image, detail, structure, product. The prominent colors used in the PowerPoint template are Blue light, Black, White.
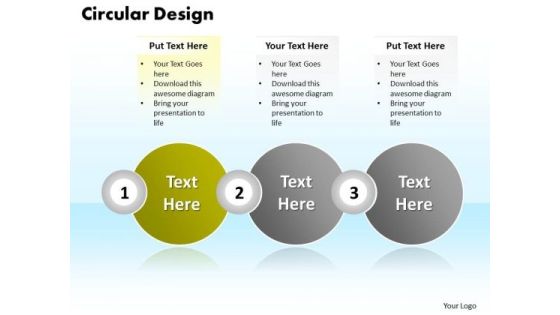
Ppt Circular Design Of Three Text Link Boxes PowerPoint 2007 Templates
PPT circular design of three text link boxes powerpoint 2007 Templates-The above Diagram displays a Picture of the Interlinked Process through three Circular Text Boxes. This image represents the steps included in the continuous process. Adjust the above image in your PPT presentations to visually support your content in your Business PPT slideshows, Marketing PPT and Financial PPT. Our PPT images are so perfectly designed that it reveals the very basis of our PPT diagrams and are an effective tool to make your clients understand. You can apply other 3D Styles and shapes to the slide to enhance your presentations.-PPT circular design of three text link boxes powerpoint 2007 Templates-Abstract, Art, Artistic, Backdrop, Background, Bend, Black, Business, Circle, Copy-Space, Create, Design, Dot, Dotted, Draw, Element, Flower, Gradient, Grid, Icon, Illustration, Leaf, Leaves, Logo, Mold, Motif, Nature, Pattern, Petal, Radiate, Retro, Round

Ppt Four Scientific Method Steps PowerPoint Presentation Text Circle Templates
PPT four scientific method steps powerpoint presentation text circle Templates-An excellent graphics that help you convey your ideas successfully - no matter what they are. Use this PowerPoint diagram to show either related or contrasting concepts with some connection.-PPT four scientific method steps powerpoint presentation text circle Templates-Abstract, Art, Artistic, Backdrop, Background, Bend, Black, Business, Circle, Copy-Space, Create, Design, Dot, Dotted, Draw, Element, Flower, Gradient, Grid, Icon, Illustration, Leaf, Leaves, Logo, Mold, Motif, Nature, Pattern, Petal, Radiate, Retro, Round
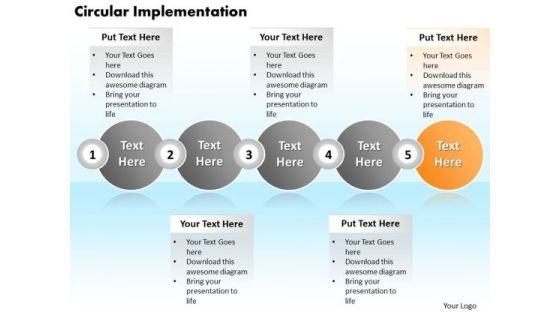
Ppt Circular Implementation Of 5 Create PowerPoint Macro Involved Procedure Templates
PPT circular implementation of 5 create powerpoint macro involved procedure Templates-The above template displays a diagram of five Circular text boxes arranged in Horizontal manner. The Orange Circular Box Highlighted in the Diagram Implies that fifth stage is under processing. Use this diagram to make your Business PPT more attractive and interesting. Deliver this amazing presentation slide to mesmerize your audience. You can change color, size and orientation of any icon to your liking.-PPT circular implementation of 5 create powerpoint macro involved procedure Templates-Abstract, Art, Artistic, Backdrop, Background, Bend, Black, Business, Circle, Copy-Space, Create, Design, Dot, Dotted, Draw, Element, Flower, Gradient, Grid, Icon, Illustration, Leaf, Leaves, Logo, Mold, Motif, Nature, Pattern, Petal, Radiate, Retro, Round

Business Framework Statistical Process Control And Quality Improvement Ppt Presentation
Multileveled process flow diagram has been used to design this business framework diagram. This diagram contains the process control and quality improvement concept. Use this diagram for marketing and business related presentations.

Ppt Circle Process Using Text Align Boxes PowerPoint 2010 4 Stages Templates
PPT circle process using text align boxes powerpoint 2010 4 stages Templates-This PowerPoint Diagram allows you to rate items by placing them in one out of four circular text boxes. Business goals can be explained more effectively with this design.-PPT circle process using text align boxes powerpoint 2010 4 stages Templates-Abstract, Art, Artistic, Backdrop, Background, Bend, Black, Business, Circle, Copy-Space, Create, Design, Dot, Dotted, Draw, Element, Flower, Gradient, Grid, Icon, Illustration, Leaf, Leaves, Logo, Mold, Motif, Nature, Pattern, Petal, Radiate, Retro, Round

Digital Competency Evaluation And Modification Venn Ppt Model Objects PDF
The Digital Competency Evaluation And Modification Venn Ppt Model Objects PDF is a compilation of the most recent design trends as a series of slides. It is suitable for any subject or industry presentation, containing attractive visuals and photo spots for businesses to clearly express their messages. This template contains a variety of slides for the user to input data, such as structures to contrast two elements, bullet points, and slides for written information. Slidegeeks is prepared to create an impression.
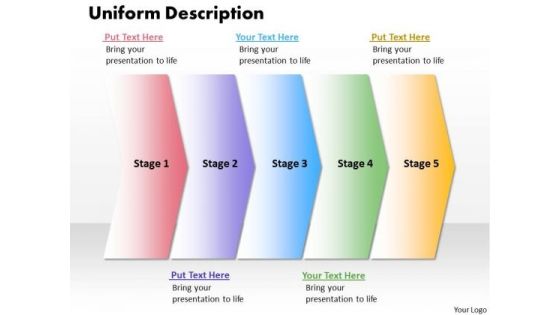
Ppt Uniform Description Of 5 Steps Working With Slide Numbers PowerPoint Templates
PPT uniform description of 5 steps working with slide numbers PowerPoint Templates-The above Diagram displays a picture of five Arrows placed in sequential manner. This image has been professionally designed to emphasize the concept of Operations performed in Circular process. Adjust the above image in your PPT presentations to visually support your content in your Business PPT slideshows.-PPT uniform description of 5 steps working with slide numbers PowerPoint Templates-Linear, Flow, Arrow, Background, Process, Business, Chart, Diagram, Financial, Graphic, Gray, Icon, Illustration, Management, Orange, Perspective, Process, Reflection, Stage, Spheres, Text,
 Home
Home