AI PPT Maker
Templates
PPT Bundles
Design Services
Business PPTs
Business Plan
Management
Strategy
Introduction PPT
Roadmap
Self Introduction
Timelines
Process
Marketing
Agenda
Technology
Medical
Startup Business Plan
Cyber Security
Dashboards
SWOT
Proposals
Education
Pitch Deck
Digital Marketing
KPIs
Project Management
Product Management
Artificial Intelligence
Target Market
Communication
Supply Chain
Google Slides
Research Services
 One Pagers
All Categories
-
Home
- Customer Favorites
- Data Architect
Data Architect
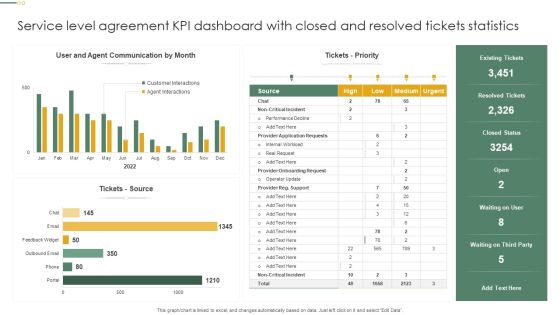
Service Level Agreement KPI Dashboard With Closed And Resolved Tickets Statistics Inspiration PDF
This graph or chart is linked to excel, and changes automatically based on data. Just left click on it and select Edit Data. Showcasing this set of slides titled Service Level Agreement KPI Dashboard With Closed And Resolved Tickets Statistics Inspiration PDF. The topics addressed in these templates are Tickets Priority, Tickets Source, Resolved Tickets. All the content presented in this PPT design is completely editable. Download it and make adjustments in color, background, font etc. as per your unique business setting.

Business Diagram Circles For Percentage Growth Presentation Template
This business slide has been designed with graphics of circles. You may download this diagram to display percentage growth data. This template is innovatively designed to highlight your worthy views
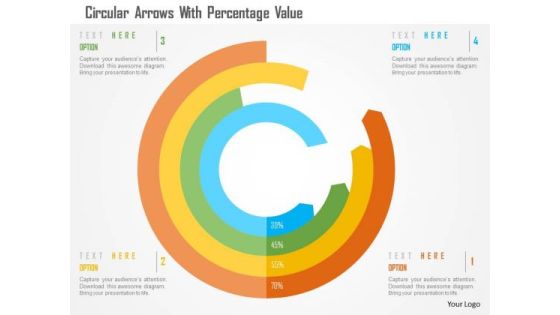
Business Diagram Circular Arrows With Percentage Value Presentation Template
This business slide has been designed with circular arrows. You may download this diagram to display percentage growth data. This template is innovatively designed to highlight your worthy views

Cloud Based Product Development Process Ppt Idea
This is a cloud based product development process ppt idea. This is a five stage process. The stages in this process are make, design, visualize, collaborate, use, design data.
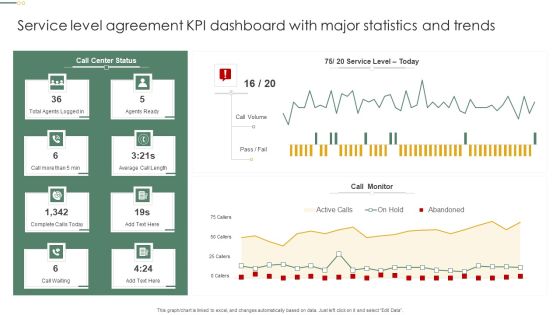
Service Level Agreement KPI Dashboard With Major Statistics And Trends Pictures PDF
This graph or chart is linked to excel, and changes automatically based on data. Just left click on it and select Edit Data. Pitch your topic with ease and precision using this Service Level Agreement KPI Dashboard With Major Statistics And Trends Pictures PDF. This layout presents information on Call Monitor, Call Volume, Agents Ready. It is also available for immediate download and adjustment. So, changes can be made in the color, design, graphics or any other component to create a unique layout.

Website Traffic Analysis Diagram Presentation Layouts
This is a website traffic analysis diagram presentation layouts. This is a four stage process. The stages in this process are keywords used, design analysis, define goals, collect data, web analysis process.

Business Framework Matrix Analysis PowerPoint Presentation
Display the matrix analysis with our new business framework power point template. This PPT has been designed with matrix graphic. Add this matrix in your analysis presentation for business or marketing data.

3 Modern Practices Of Human Resource Management Functions Designs PDF
This slide depicts 3 modern practices of human resource functions beneficial for self development and career growth of employees. This includes information about empathetic, focus on data, analyzing and strategizing. Presenting 3 modern practices of human resource management functions designs pdf to dispense important information. This template comprises three stages. It also presents valuable insights into the topics including empathetic, analyzing and strategizing, focus on data. This is a completely customizable PowerPoint theme that can be put to use immediately. So, download it and address the topic impactfully.

Six Months Roadmap To Develop Mobile Seo Strategy Mobile Search Engine Optimization Guide Background PDF
The Six Months Roadmap To Develop Mobile Seo Strategy Mobile Search Engine Optimization Guide Background PDF is a compilation of the most recent design trends as a series of slides. It is suitable for any subject or industry presentation, containing attractive visuals and photo spots for businesses to clearly express their messages. This template contains a variety of slides for the user to input data, such as structures to contrast two elements, bullet points, and slides for written information. Slidegeeks is prepared to create an impression.

Four Arrows Tags Infographics Powerpoint Template
The above PowerPoint slide displays four arrows design with icons. This PowerPoint diagram helps to summarize complex business data. Adjust the above diagram in your business presentations to visually support your content.
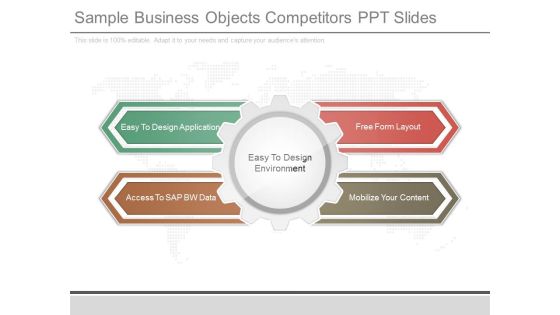
Sample Business Objects Competitors Ppt Slides
This is a sample business objects competitors ppt slides. This is a four stage process. The stages in this process are easy to design application, free form layout, access to sap bw data, mobilize your content.
Stock Photo Card Board Download Arrow Icon PowerPoint Slide
This image slide is designed with cardboard and download arrow. This image contains the graphic of download icon with cardboard depicting downloading and storage of data. Use this image to make outstanding presentations.

Business Framework Shed Light On Topic Flashlight PowerPoint Presentation
This Power Point template slide has been designed with graphic of torch. This flash light has been used to display the concept of highlighting the any business data. Use this business slide for your technical presentation.

Business Diagram Four Options Layout Diagram For Business Presentation Template
Four options circular diagram is used to design this power point template. This business diagram can be used to compare and present data. Use this diagram to make your presentations more effective.
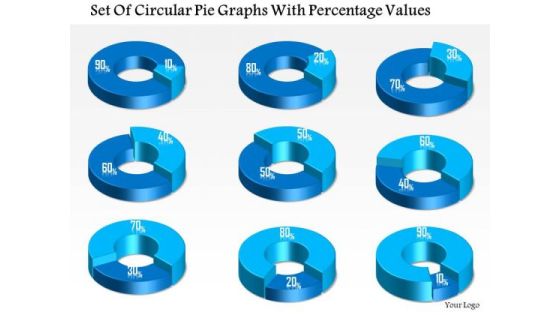
Business Diagram Set Of Circular Pie Graphs With Percentage Values Presentation Template
This business diagram displays set of pie charts. This Power Point template has been designed to compare and present business data. Download this diagram to represent stages of business growth.
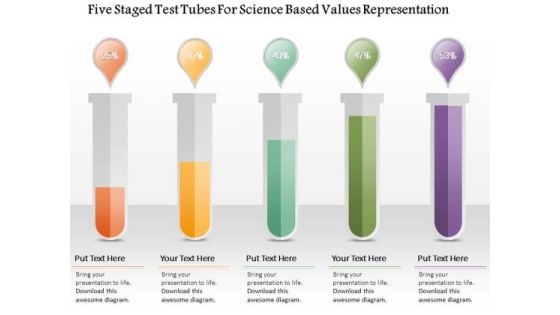
Busines Diagram Five Staged Test Tubes For Science Based Values Representation Ppt Template
Five staged test tubes are used to design this business diagram. This business slide contains the concept of value representation based on scientific data. Ideas are best expressed easily with the help of this diagram slide
Four Staged Pie Chart With Icons Powerpoint Templates
A good quality PowerPoint template is the foundation for every presentation. This PPT slide contains graphics of pie chart. Download this slide to outline business data. This slide is innovatively designed to highlight your worthy views.

Market Research Analyst Layout Ppt Templates
This is a market research analyst layout ppt templates. This is a five stage process. The stages in this process are problem definition, specifying research objectives, creating the research design, collect the data, analyze and evaluate result.
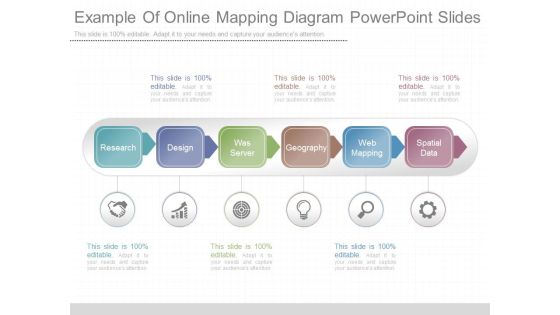
Example Of Online Mapping Diagram Powerpoint Slides
This is a example of online mapping diagram powerpoint slides. This is a six stage process. The stages in this process are research, design, was server, geography, web mapping, spatial data.
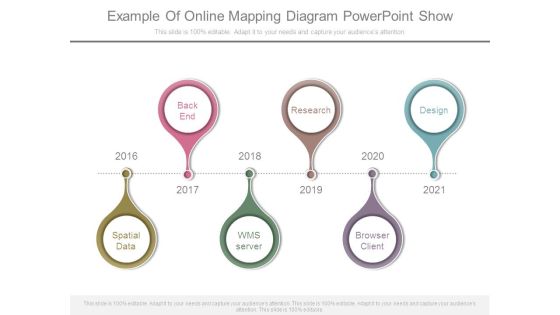
Example Of Online Mapping Diagram Powerpoint Show
This is a example of online mapping diagram powerpoint show. This is a six stage process. The stages in this process are back end, research, design, spatial data, wms server, browser client.

Search Engine Marketing Campaign Keyword Optimization Research Report Pictures PDF
The following slide depicts the projected keyword improvement report to evaluate increase or decrease outcomes due to campaign efforts. It includes key elements such as impression, clicks, click through rate CTR, average ranking etc. The Search Engine Marketing Campaign Keyword Optimization Research Report Pictures PDF is a compilation of the most recent design trends as a series of slides. It is suitable for any subject or industry presentation, containing attractive visuals and photo spots for businesses to clearly express their messages. This template contains a variety of slides for the user to input data, such as structures to contrast two elements, bullet points, and slides for written information. Slidegeeks is prepared to create an impression.
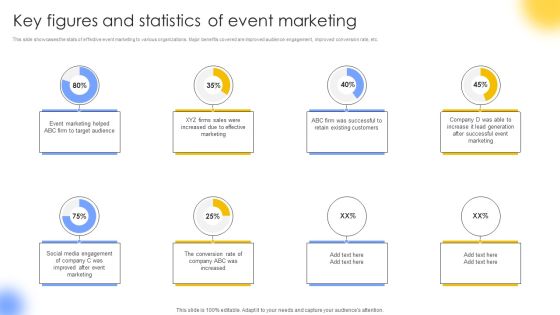
Key Figures And Statistics Of Event Marketing Portrait PDF
This slide showcases the stats of effective event marketing to various organizations. Major benefits covered are improved audience engagement, improved conversion rate, etc. If you are looking for a format to display your unique thoughts, then the professionally designed Key Figures And Statistics Of Event Marketing Portrait PDF is the one for you. You can use it as a Google Slides template or a PowerPoint template. Incorporate impressive visuals, symbols, images, and other charts. Modify or reorganize the text boxes as you desire. Experiment with shade schemes and font pairings. Alter, share or cooperate with other people on your work. Download Key Figures And Statistics Of Event Marketing Portrait PDF and find out how to give a successful presentation. Present a perfect display to your team and make your presentation unforgettable.
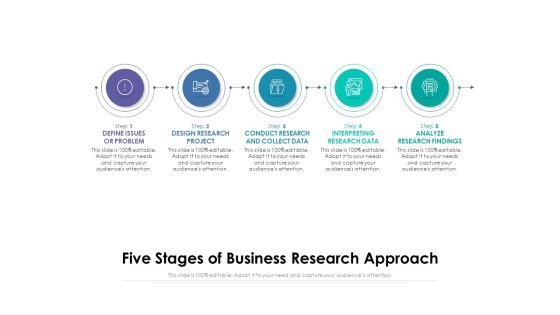
Five Stages Of Business Research Approach Ppt PowerPoint Presentation Summary Tips PDF
Persuade your audience using this five stages of business research approach ppt powerpoint presentation summary tips pdf. This PPT design covers five stages, thus making it a great tool to use. It also caters to a variety of topics including define issues or problem, design research project, conduct research and collect data, interpreting research data, analyze research findings. Download this PPT design now to present a convincing pitch that not only emphasizes the topic but also showcases your presentation skills.

Jigsaw Depicting 4 Stages Of Continual Service Improvement Process Slides PDF
Persuade your audience using this Jigsaw Depicting 4 Stages Of Continual Service Improvement Process Slides PDF. This PPT design covers four stages, thus making it a great tool to use. It also caters to a variety of topics including Measured, Gather Data, Process Data. Download this PPT design now to present a convincing pitch that not only emphasizes the topic but also showcases your presentation skills.

Comparative Assessment Of Chatgpt And AI Enabled Search Engines Sample PDF
This slide provides information regarding the comparative assessment of ChatGPT in the context to AI-enabled search engines. Both models are compared on various features such as training data, pre-training type, fine-tuning, and API availability, etc. The best PPT templates are a great way to save time, energy, and resources. Slidegeeks have 100 percent editable powerpoint slides making them incredibly versatile. With these quality presentation templates, you can create a captivating and memorable presentation by combining visually appealing slides and effectively communicating your message. Download Comparative Assessment Of Chatgpt And AI Enabled Search Engines Sample PDF from Slidegeeks and deliver a wonderful presentation.

Kanban Structure For Task Management Ppt Summary Information PDF
This graph or chart is linked to excel, and changes automatically based on data. Just left click on it and select Edit Data. Showcasing this set of slides titled Kanban Structure For Task Management Ppt Summary Information PDF. The topics addressed in these templates are Backlog, In Progress, New Epic Added. All the content presented in this PPT design is completely editable. Download it and make adjustments in color, background, font etc. as per your unique business setting.
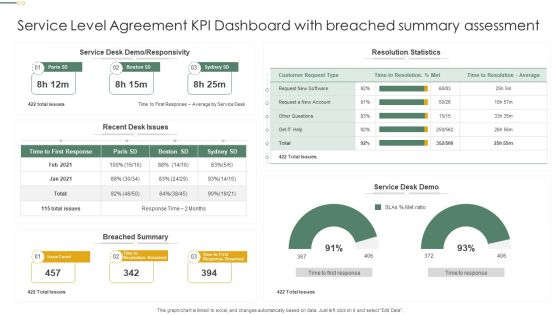
Service Level Agreement KPI Dashboard With Breached Summary Assessment Professional PDF
This graph or chart is linked to excel, and changes automatically based on data. Just left click on it and select Edit Data. Pitch your topic with ease and precision using this Service Level Agreement KPI Dashboard With Breached Summary Assessment Professional PDF. This layout presents information on Resolution Statistics, Service Desk Demo, Breached Summary. It is also available for immediate download and adjustment. So, changes can be made in the color, design, graphics or any other component to create a unique layout.

Post It Note 6 Stages Business Strategy Consultants Ppt Plan Builder PowerPoint Slides
We present our post it note 6 stages business strategy consultants ppt plan builder PowerPoint Slides.Download our Arrows PowerPoint Templates because It will mark the footprints of your journey. Illustrate how they will lead you to your desired destination. Use our Business PowerPoint Templates because Our PowerPoint Templates and Slides help you pinpoint your timelines. Highlight the reasons for your deadlines with their use. Download and present our Flow Charts PowerPoint Templates because You will get more than you ever bargained for. Download and present our Marketing PowerPoint Templates because Our PowerPoint Templates and Slides will fulfill your every need. Use them and effectively satisfy the desires of your audience. Download our Shapes PowerPoint Templates because Our PowerPoint Templates and Slides will let you Clearly mark the path for others to follow.Use these PowerPoint slides for presentations relating to Diagram, flyer, design, business, workflow, sequence, square, layout, presentation, circle, description, boxes, marketing, abstract, team, three, chart, strategy, shiny, segments, winner, run, text, sections, competition, banner, rush, progress, background, pattern. The prominent colors used in the PowerPoint template are Blue, Yellow, Green.

Business Network Design Powerpoint Slides Templates Download
This is a business network design powerpoint slides templates download. This is a ten stage process. The stages in this process are revenue from enrolled brand partners, it systems, data, it infrastructure, suppliers, monthly residual and hosting, direct sales, trading partners, web design services, customer.
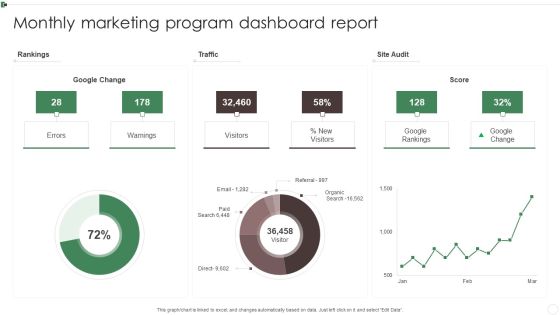
Monthly Marketing Program Dashboard Report Ppt Inspiration Information PDF
This graph or chart is linked to excel, and changes automatically based on data. Just left click on it and select Edit Data. Pitch your topic with ease and precision using this Monthly Marketing Program Dashboard Report Ppt Inspiration Information PDF. This layout presents information on Rankings, Traffic, Site Audit, Warnings. It is also available for immediate download and adjustment. So, changes can be made in the color, design, graphics or any other component to create a unique layout.

Financial Investment Process Diagram Ppt Design
This is a financial investment process diagram ppt design. This is a eight stage process. The stages in this process are identify investment goal, determine risk tolerance and time horizon, written investment policy statement, accounts established, investments allocated, quarterly investment reports, monitor portfolio and provide tax planning data, annual portfolio review and re optimize portfolio.
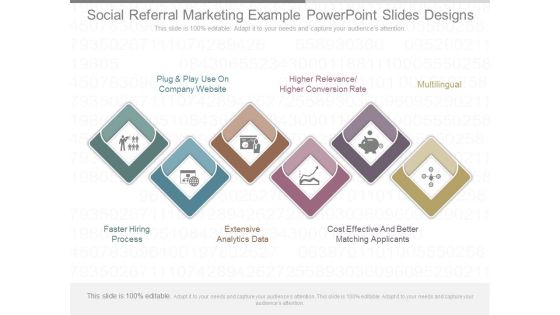
Social Referral Marketing Example Powerpoint Slides Designs
This is a social referral marketing example powerpoint slides designs. This is a six stage process. The stages in this process are plug and play use on company website, higher relevance higher conversion rate, multilingual, faster hiring process, extensive analytics data, cost effective and better matching applicants.

Analytical Research Report Ppt Background Designs
This is a analytical research report ppt background designs. This is a six stage process. The stages in this process are reflection and implementation, act to implement your plan, devise a plan, reflect and share, observe collect and analyze your data, identify the problem.

Kanban Structure For Product Quality Assurance Ppt Portfolio Deck PDF
This graph or chart is linked to excel, and changes automatically based on data. Just left click on it and select Edit Data. Pitch your topic with ease and precision using this Kanban Structure For Product Quality Assurance Ppt Portfolio Deck PDF. This layout presents information on Product Deployment, Quality Assurance, Product, Designing And Development. It is also available for immediate download and adjustment. So, changes can be made in the color, design, graphics or any other component to create a unique layout.
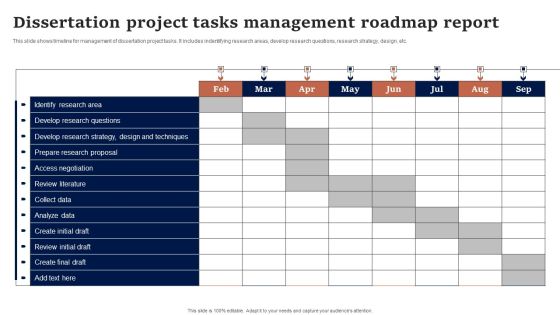
Dissertation Project Tasks Management Roadmap Report Mockup PDF
This slide shows timeline for management of dissertation project tasks. It includes indentifying research areas, develop research questions, research strategy, design, etc. Pitch your topic with ease and precision using this Dissertation Project Tasks Management Roadmap Report Mockup PDF. This layout presents information on Access Negotiation, Analyze Data, Collect Data. It is also available for immediate download and adjustment. So, changes can be made in the color, design, graphics or any other component to create a unique layout.

Supplier Quality Optimization Program Framework Portrait PDF
This slide provide information about supplier quality improvement framework to build trust and develop long-term relationships. It includes elements such as communication, data, proceed to next issue etc. Showcasing this set of slides titled Supplier Quality Optimization Program Framework Portrait PDF. The topics addressed in these templates are Testing Inward Goods, Analyze Data, Review Positive Test. All the content presented in this PPT design is completely editable. Download it and make adjustments in color, background, font etc. as per your unique business setting.

Seven Steps Of Financial Plan With Establishing Goals Ppt PowerPoint Presentation File Outline PDF
Persuade your audience using this seven steps of financial plan with establishing goals ppt powerpoint presentation file outline pdf. This PPT design covers seven stages, thus making it a great tool to use. It also caters to a variety of topics including monitoring plan, developing plan, analyzing the data, establishing goal, gathering data, plan implementation. Download this PPT design now to present a convincing pitch that not only emphasizes the topic but also showcases your presentation skills.

Weekly Sales Performance Highlights With Product Share Ppt File Information PDF
This graph or chart is linked to excel, and changes automatically based on data. Just left click on it and select Edit Data. Pitch your topic with ease and precision using this Weekly Sales Performance Highlights With Product Share Ppt File Information PDF. This layout presents information on Dashboard Summary, Weekly Sale, Product Share. It is also available for immediate download and adjustment. So, changes can be made in the color, design, graphics or any other component to create a unique layout.

Annual Training Schedule Bar Chart For Business Ppt PowerPoint Presentation File Infographics PDF
This graph chart is linked to excel, and changes automatically based on data. Just left click on it and select Edit Data. Showcasing this set of slides titled annual training schedule bar chart for business ppt powerpoint presentation file infographics pdf. The topics addressed in these templates are trainings, employees, competent officers. All the content presented in this PPT design is completely editable. Download it and make adjustments in color, background, font etc. as per your unique business setting.

Request For Proposal Process For Voice Over Internet Protocol System Selection Infographics PDF
This slide illustrates preparation of RFP response for selection of VoIP phone calls. It includes data, response creation, evaluation preparation, close, etc. Showcasing this set of slides titled Request For Proposal Process For Voice Over Internet Protocol System Selection Infographics PDF. The topics addressed in these templates are Data, Response Creation, Evaluation Preparation. All the content presented in this PPT design is completely editable. Download it and make adjustments in color, background, font etc. as per your unique business setting.

Characteristics Of Managers Scorecard Model Formats PDF
This slide mentions 4 major aspects on the basis of which executive balanced scorecard is formulated. Key considerations are financial data, customer perspective, business process and learning growth. Pitch your topic with ease and precision using this Characteristics Of Managers Scorecard Model Formats PDF. This layout presents information on Financial Data, Growth, Business Processes. It is also available for immediate download and adjustment. So, changes can be made in the color, design, graphics or any other component to create a unique layout.

Circles Infographic Design For Strategic Thinking Powerpoint Template
This PowerPoint template has been designed with circles infographic diagram. You may use this slide to display strategic thinking process. This diagram provides an effective way of displaying information you can edit text, color, shade and style as per you need.

Chart Showing Outline Of Online Drug Delivery Systems Market Ppt PowerPoint Presentation File Clipart PDF
This graph or chart is linked to excel, and changes automatically based on data. Just left click on it and select edit data. Showcasing this set of slides titled chart showing outline of online drug delivery systems market ppt powerpoint presentation file clipart pdf. The topics addressed in these templates are technological, development, growth. All the content presented in this PPT design is completely editable. Download it and make adjustments in color, background, font etc. as per your unique business setting.
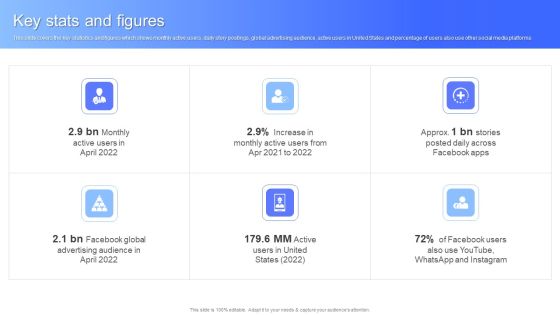
Key Stats And Figures Facebook Business Outline Sample PDF
This slide covers the key statistics and figures which shows monthly active users, daily story postings, global advertising audience, active users in United States and percentage of users also use other social media platforms. Presenting Key Stats And Figures Facebook Business Outline Sample PDF to provide visual cues and insights. Share and navigate important information on six stages that need your due attention. This template can be used to pitch topics like Key Stats And Figures. In addtion, this PPT design contains high resolution images, graphics, etc, that are easily editable and available for immediate download.

Why Is Agile Cost Effective IT Determining The Software Development Cost Agile Demonstration PDF
This graph or chart is linked to excel, and changes automatically based on data. Just left click on it and select Edit Data. Deliver and pitch your topic in the best possible manner with this Why Is Agile Cost Effective IT Determining The Software Development Cost Agile Demonstration PDF. Use them to share invaluable insights on Analysis And Design, Development, Project Management, Quality Assurance and impress your audience. This template can be altered and modified as per your expectations. So, grab it now.
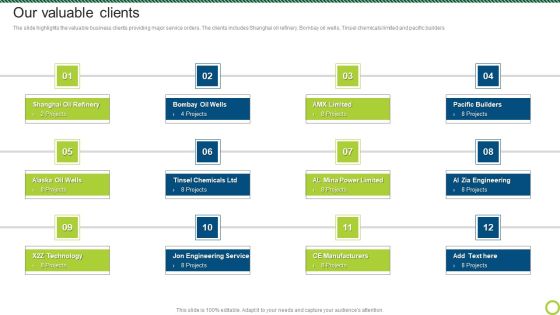
Engineering Solutions Company Detail Our Valuable Clients Background PDF
The slide highlights the valuable business clients providing major service orders. The clients includes Shanghai oil refinery, Bombay oil wells, Tinsel chemicals limited and pacific builders.This is a Engineering Solutions Company Detail Our Valuable Clients Background PDF template with various stages. Focus and dispense information on twelve stages using this creative set, that comes with editable features. It contains large content boxes to add your information on topics like Shanghai Oil Refinery, Pacific Builders, Engineering Service. You can also showcase facts, figures, and other relevant content using this PPT layout. Grab it now.

Bar Graph Showing Revenues Generated By Sales Department Ppt Portfolio Graphics Example PDF
This graph or chart is linked to excel, and changes automatically based on data. Just left click on it and select edit data. Showcasing this set of slides titled bar graph showing revenues generated by sales department ppt portfolio graphics example pdf. The topics addressed in these templates are yearly sales revenues, sales team, profits. All the content presented in this PPT design is completely editable. Download it and make adjustments in color, background, font etc. as per your unique business setting.

Online Advertising And Promotion Plan Management Dashboard Ppt PowerPoint Presentation Show Tips PDF
This graph chart is linked to excel, and changes automatically based on data. Just left click on it and select Edit Data. Showcasing this set of slides titled online advertising and promotion plan management dashboard ppt powerpoint presentation show tips pdf. The topics addressed in these templates are source techniques, social media channels, traffic targets. All the content presented in this PPT design is completely editable. Download it and make adjustments in color, background, font etc. as per your unique business setting.

Chart Showing Food Branding Platforms Ppt Summary Gridlines PDF
This graph or chart is linked to excel, and changes automatically based on data. Just left click on it and select Edit Data. Showcasing this set of slides titled chart showing food branding platforms ppt summary gridlines pdf. The topics addressed in these templates are chart showing food branding platforms. All the content presented in this PPT design is completely editable. Download it and make adjustments in color, background, font etc. as per your unique business setting.
Finance Metrics Dashboard Illustrating Gross And Operating Profit Margin Icons PDF
This graph or chart is linked to excel, and changes automatically based on data. Just left click on it and select edit data. Showcasing this set of slides titled Finance Metrics Dashboard Illustrating Gross And Operating Profit Margin Icons PDF. The topics addressed in these templates are Gross Profit Margin, Operating Profit Margin, Net Profit Margin. All the content presented in this PPT design is completely editable. Download it and make adjustments in color, background, font etc. as per your unique business setting.

Finance Metrics Dashboard Illustrating Monthly Gross Profit Formats PDF
This graph or chart is linked to excel, and changes automatically based on data. Just left click on it and select edit data. Showcasing this set of slides titled Finance Metrics Dashboard Illustrating Monthly Gross Profit Formats PDF. The topics addressed in these templates are Profit Metrics Gross, Profit Target Cum, Actual Cum Target. All the content presented in this PPT design is completely editable. Download it and make adjustments in color, background, font etc. as per your unique business setting.
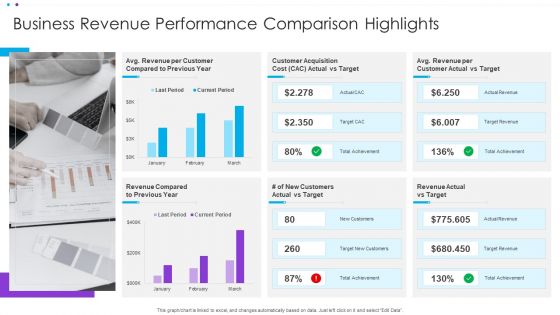
Business Revenue Performance Comparison Highlights Ppt Summary Rules PDF
This graph or chart is linked to excel, and changes automatically based on data. Just left click on it and select Edit Data. Showcasing this set of slides titled Business Revenue Performance Comparison Highlights Ppt Summary Rules PDF. The topics addressed in these templates are Customer Acquisition, Customer Actual, Revenue Compared. All the content presented in this PPT design is completely editable. Download it and make adjustments in color, background, font etc. as per your unique business setting.
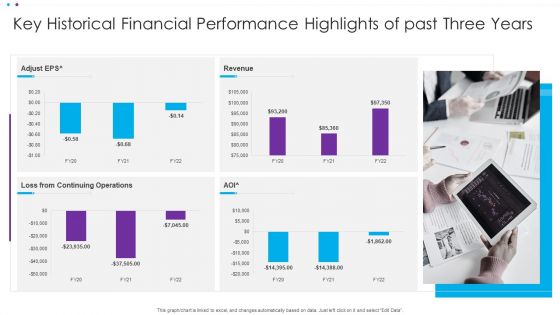
Key Historical Financial Performance Highlights Of Past Three Years Ppt Ideas Background PDF
This graph or chart is linked to excel, and changes automatically based on data. Just left click on it and select Edit Data. Showcasing this set of slides titled Key Historical Financial Performance Highlights Of Past Three Years Ppt Ideas Background PDF. The topics addressed in these templates are Continuing Operations, Adjust EP. All the content presented in this PPT design is completely editable. Download it and make adjustments in color, background, font etc. as per your unique business setting.
Social Media Marketing Performance Highlights With Key Campaign Results Ppt Icon PDF
This graph or chart is linked to excel, and changes automatically based on data. Just left click on it and select Edit Data. Showcasing this set of slides titled Social Media Marketing Performance Highlights With Key Campaign Results Ppt Icon PDF. The topics addressed in these templates are Profit Per, Overall Campaign, Total Budget. All the content presented in this PPT design is completely editable. Download it and make adjustments in color, background, font etc. as per your unique business setting.

Client Helpline Dashboard Average Time To Solve Issue Ppt Portfolio Visuals PDF
This graph or chart is linked to excel, and changes automatically based on data. Just left click on it and select Edit Data. Showcasing this set of slides titled Client Helpline Dashboard Average Time To Solve Issue Ppt Portfolio Visuals PDF. The topics addressed in these templates are Cost Per Support, Customer Satisfaction, Costs To Revenue. All the content presented in this PPT design is completely editable. Download it and make adjustments in color, background, font etc. as per your unique business setting.

Client Helpline Dashboard With Average Talk Time Distribution Ppt Gallery Backgrounds PDF
This graph or chart is linked to excel, and changes automatically based on data. Just left click on it and select Edit Data. Showcasing this set of slides titled Client Helpline Dashboard With Average Talk Time Distribution Ppt Gallery Backgrounds PDF. The topics addressed in these templates are External Incoming Call, Occupancy, Break Time, Sales. All the content presented in this PPT design is completely editable. Download it and make adjustments in color, background, font etc. as per your unique business setting.

Client Helpline Dashboard With Resolution And Response Rate Ppt File Example Topics PDF
This graph or chart is linked to excel, and changes automatically based on data. Just left click on it and select Edit Data. Showcasing this set of slides titled Client Helpline Dashboard With Resolution And Response Rate Ppt File Example Topics PDF. The topics addressed in these templates are Resolutions, Response Time, Response Time Weekday. All the content presented in this PPT design is completely editable. Download it and make adjustments in color, background, font etc. as per your unique business setting.

Client Helpline Dashboard With Support Status Ppt Portfolio Rules PDF
This graph or chart is linked to excel, and changes automatically based on data. Just left click on it and select Edit Data. Showcasing this set of slides titled Client Helpline Dashboard With Support Status Ppt Portfolio Rules PDF. The topics addressed in these templates are Total Number, Support Requests, Total Resolved, Support Status. All the content presented in this PPT design is completely editable. Download it and make adjustments in color, background, font etc. as per your unique business setting.
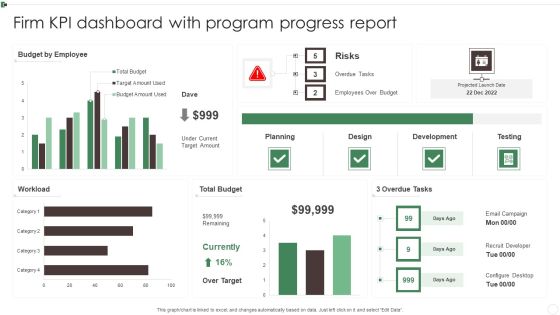
Firm KPI Dashboard With Program Progress Report Ppt Pictures Deck PDF
This graph or chart is linked to excel, and changes automatically based on data. Just left click on it and select Edit Data. Showcasing this set of slides titled Firm KPI Dashboard With Program Progress Report Ppt Pictures Deck PDF. The topics addressed in these templates are Budget By Employee, Total Budget, 3 Overdue Tasks, Workload. All the content presented in this PPT design is completely editable. Download it and make adjustments in color, background, font etc. as per your unique business setting.
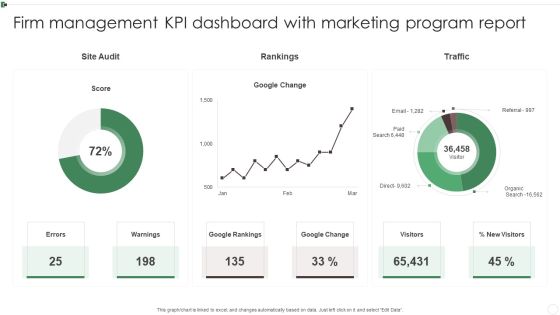
Firm Management KPI Dashboard With Marketing Program Report Ppt Styles Introduction PDF
This graph or chart is linked to excel, and changes automatically based on data. Just left click on it and select Edit Data. Showcasing this set of slides titled Firm Management KPI Dashboard With Marketing Program Report Ppt Styles Introduction PDF. The topics addressed in these templates are Google Rankings, Google Change, Warnings, Visitors. All the content presented in this PPT design is completely editable. Download it and make adjustments in color, background, font etc. as per your unique business setting.
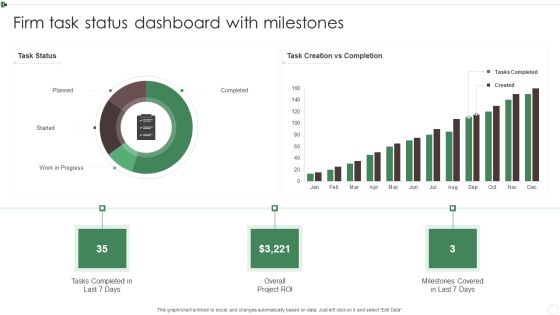
Firm Task Status Dashboard With Milestones Ppt Show Sample PDF
This graph or chart is linked to excel, and changes automatically based on data. Just left click on it and select Edit Data. Showcasing this set of slides titled Firm Task Status Dashboard With Milestones Ppt Show Sample PDF. The topics addressed in these templates are Tasks Completed, Planned, Work Progress, Overall Project ROI. All the content presented in this PPT design is completely editable. Download it and make adjustments in color, background, font etc. as per your unique business setting.

Help Desk Call Centre Service Level Agreement KPI Dashboard Pictures PDF
This graph or chart is linked to excel, and changes automatically based on data. Just left click on it and select Edit Data. Showcasing this set of slides titled Help Desk Call Centre Service Level Agreement KPI Dashboard Pictures PDF. The topics addressed in these templates are Call Type Today, Occupancy Today, Call Summary Today. All the content presented in this PPT design is completely editable. Download it and make adjustments in color, background, font etc. as per your unique business setting.

Service Level Agreement KPI Dashboard With Sales And Product Report Clipart PDF
This graph or chart is linked to excel, and changes automatically based on data. Just left click on it and select Edit Data. Showcasing this set of slides titled Service Level Agreement KPI Dashboard With Sales And Product Report Clipart PDF. The topics addressed in these templates are Total Accounts YTD, Conversion Rate, Mthly MRR Retention. All the content presented in this PPT design is completely editable. Download it and make adjustments in color, background, font etc. as per your unique business setting.

5 Year Gender Based Group Demographics Of Organization Background PDF
This graph or chart is linked to excel, and changes automatically based on data. Just left click on it and select Edit Data. Showcasing this set of slides titled 5 Year Gender Based Group Demographics Of Organization Background PDF. The topics addressed in these templates are Total Employees, Male, Female. All the content presented in this PPT design is completely editable. Download it and make adjustments in color, background, font etc. as per your unique business setting.

Business Hiring Group Diversity Demographics Dashboard Guidelines PDF
This graph or chart is linked to excel, and changes automatically based on data. Just left click on it and select Edit Data. Showcasing this set of slides titled Business Hiring Group Diversity Demographics Dashboard Guidelines PDF. The topics addressed in these templates are Hiring Trends, Current Period, Previous Period. All the content presented in this PPT design is completely editable. Download it and make adjustments in color, background, font etc. as per your unique business setting.
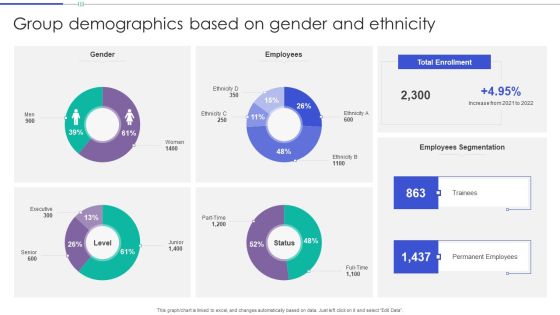
Group Demographics Based On Gender And Ethnicity Themes PDF
This graph or chart is linked to excel, and changes automatically based on data. Just left click on it and select Edit Data. Showcasing this set of slides titled Group Demographics Based On Gender And Ethnicity Themes PDF. The topics addressed in these templates are Gender, Employees, Total Enrollment. All the content presented in this PPT design is completely editable. Download it and make adjustments in color, background, font etc. as per your unique business setting.

Group Diversity Demographics Based On Salary Range Portrait PDF
This graph or chart is linked to excel, and changes automatically based on data. Just left click on it and select Edit Data. Showcasing this set of slides titled Group Diversity Demographics Based On Salary Range Portrait PDF. The topics addressed in these templates are Salary Breakdown Team, Number Employees, Per Team. All the content presented in this PPT design is completely editable. Download it and make adjustments in color, background, font etc. as per your unique business setting.

Multiple Organizational Group Demographics Based On Gender Download PDF
This graph or chart is linked to excel, and changes automatically based on data. Just left click on it and select Edit Data. Showcasing this set of slides titled Multiple Organizational Group Demographics Based On Gender Download PDF. The topics addressed in these templates are Total Employees, Team, Female. All the content presented in this PPT design is completely editable. Download it and make adjustments in color, background, font etc. as per your unique business setting.

Helpdesk SLA KPL Dashboard Illustrating Calls Details Ppt Slides Show PDF
This graph or chart is linked to excel, and changes automatically based on data. Just left click on it and select Edit Data. Showcasing this set of slides titled Helpdesk SLA KPL Dashboard Illustrating Calls Details Ppt Slides Show PDF. The topics addressed in these templates are Call Type Today, Trunk Utilization Today, Call Summery Today. All the content presented in this PPT design is completely editable. Download it and make adjustments in color, background, font etc. as per your unique business setting.

SLA KPL Dashboard Indicating Compliance Priority With KPI Ppt File Format PDF
This graph or chart is linked to excel, and changes automatically based on data. Just left click on it and select Edit Data. Showcasing this set of slides titled SLA KPL Dashboard Indicating Compliance Priority With KPI Ppt File Format PDF. The topics addressed in these templates are KPI Graph, Insights Here, SLA Compliance Priority. All the content presented in this PPT design is completely editable. Download it and make adjustments in color, background, font etc. as per your unique business setting.

SLA KPL Dashboard Indicating Top Week Performers Ppt Infographics Examples PDF
This graph or chart is linked to excel, and changes automatically based on data. Just left click on it and select Edit Data. Showcasing this set of slides titled SLA KPL Dashboard Indicating Top Week Performers Ppt Infographics Examples PDF. The topics addressed in these templates are Active Slas Risk, Active Slas Breached, Active Slas. All the content presented in this PPT design is completely editable. Download it and make adjustments in color, background, font etc. as per your unique business setting.

Doughnut Graph Depicting Time Spent On Multiple Project Activities Microsoft PDF
This graph or chart is linked to excel, and changes automatically based on data. Just left click on it and select Edit Data. Showcasing this set of slides titled Doughnut Graph Depicting Time Spent On Multiple Project Activities Microsoft PDF. The topics addressed in these templates are Website Development, IT Incident Management, Portfolio Management. All the content presented in this PPT design is completely editable. Download it and make adjustments in color, background, font etc. as per your unique business setting.
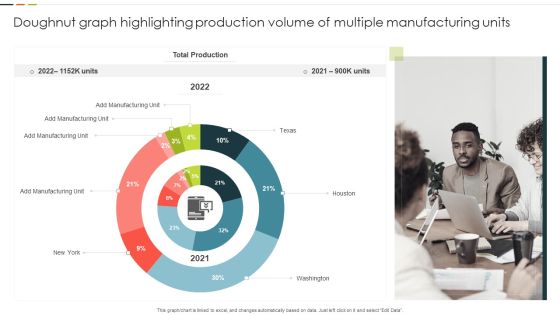
Doughnut Graph Highlighting Production Volume Of Multiple Manufacturing Units Guidelines PDF
This graph or chart is linked to excel, and changes automatically based on data. Just left click on it and select Edit Data. Showcasing this set of slides titled Doughnut Graph Highlighting Production Volume Of Multiple Manufacturing Units Guidelines PDF. The topics addressed in these templates are Total Production, Manufacturing Unit, Washington. All the content presented in this PPT design is completely editable. Download it and make adjustments in color, background, font etc. as per your unique business setting.

Doughnut Graph With Multiple Construction Project Detail Structure PDF
This graph or chart is linked to excel, and changes automatically based on data. Just left click on it and select Edit Data. Showcasing this set of slides titled Doughnut Graph With Multiple Construction Project Detail Structure PDF. The topics addressed in these templates are Corporate Buildings, Residential Houses, Commercial Buildings. All the content presented in this PPT design is completely editable. Download it and make adjustments in color, background, font etc. as per your unique business setting.

Kanban Structure For Monitor Weekly Issues Resolving Progress Ppt Professional Outline PDF
This graph or chart is linked to excel, and changes automatically based on data. Just left click on it and select Edit Data. Showcasing this set of slides titled Kanban Structure For Monitor Weekly Issues Resolving Progress Ppt Professional Outline PDF. The topics addressed in these templates are Issues Resolved, Progress To Resolved, Issues To Resolved. All the content presented in this PPT design is completely editable. Download it and make adjustments in color, background, font etc. as per your unique business setting.
Kanban Structure For Yearly Project Progress Tracking Ppt File Example Introduction PDF
This graph or chart is linked to excel, and changes automatically based on data. Just left click on it and select Edit Data. Showcasing this set of slides titled Kanban Structure For Yearly Project Progress Tracking Ppt File Example Introduction PDF. The topics addressed in these templates are Number Projects, Backlog Approved, Final Review. All the content presented in this PPT design is completely editable. Download it and make adjustments in color, background, font etc. as per your unique business setting.
Kanban Structure To Track Cycle Time For Project Execution Ppt Icon Images PDF
This graph or chart is linked to excel, and changes automatically based on data. Just left click on it and select Edit Data. Showcasing this set of slides titled Kanban Structure To Track Cycle Time For Project Execution Ppt Icon Images PDF. The topics addressed in these templates are Lead Time, Cycle Time, WIP Limit. All the content presented in this PPT design is completely editable. Download it and make adjustments in color, background, font etc. as per your unique business setting.

Kanban Structure With Process Lead Time Ppt Gallery Template PDF
This graph or chart is linked to excel, and changes automatically based on data. Just left click on it and select Edit Data. Showcasing this set of slides titled Kanban Structure With Process Lead Time Ppt Gallery Template PDF. The topics addressed in these templates are Lead Time, In Realization, Requirements. All the content presented in this PPT design is completely editable. Download it and make adjustments in color, background, font etc. as per your unique business setting.
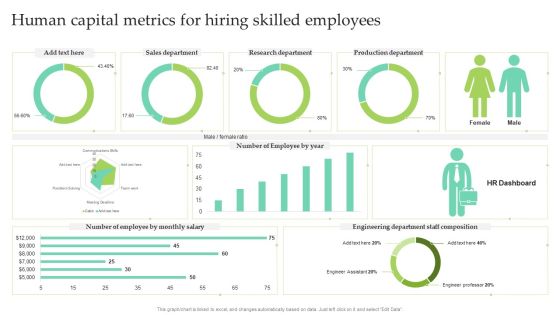
Human Capital Metrics For Hiring Skilled Employees Ppt Slides Themes PDF
This graph or chart is linked to excel, and changes automatically based on data. Just left click on it and select Edit Data. Showcasing this set of slides titled Human Capital Metrics For Hiring Skilled Employees Ppt Slides Themes PDF. The topics addressed in these templates are Sales Department, Research Department, Production Department. All the content presented in this PPT design is completely editable. Download it and make adjustments in color, background, font etc. as per your unique business setting.

Human Capital Metrics For Proper Management Ppt Show Inspiration PDF
This graph or chart is linked to excel, and changes automatically based on data. Just left click on it and select Edit Data. Showcasing this set of slides titled Human Capital Metrics For Proper Management Ppt Show Inspiration PDF. The topics addressed in these templates are Candidates Per Position, Hired Per Source, Location. All the content presented in this PPT design is completely editable. Download it and make adjustments in color, background, font etc. as per your unique business setting.
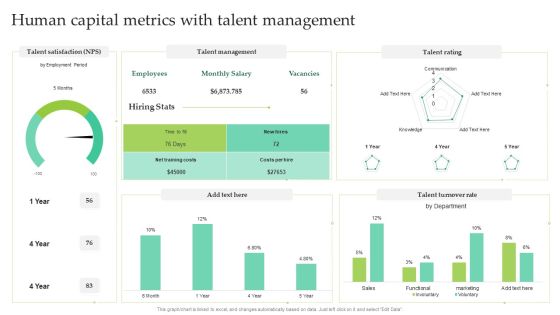
Human Capital Metrics With Talent Management Ppt Layouts Mockup PDF
This graph or chart is linked to excel, and changes automatically based on data. Just left click on it and select Edit Data. Showcasing this set of slides titled Human Capital Metrics With Talent Management Ppt Layouts Mockup PDF. The topics addressed in these templates are Talent Management, Talent Rating, Talent Turnover Rate. All the content presented in this PPT design is completely editable. Download it and make adjustments in color, background, font etc. as per your unique business setting.

Resource Opportunity Evaluation And Assessment Framework Background PDF
The following slide showcases sourcing opportunity assessment report that identifies gaps and success factors. It includes gathering data, identifying opportunities and implementing plan. Showcasing this set of slides titled Resource Opportunity Evaluation And Assessment Framework Background PDF. The topics addressed in these templates are Gathering Data, Identifying Opportunities, Implementing Plan. All the content presented in this PPT design is completely editable. Download it and make adjustments in color, background, font etc. as per your unique business setting.

Automobile Sales Scorecard Percentage Scorecard For Auto Sales Based On Fuel Usage Graphics PDF
This graph or chart is linked to excel, and changes automatically based on data. Just left click on it and select Edit Data. Deliver and pitch your topic in the best possible manner with this Automobile Sales Scorecard Percentage Scorecard For Auto Sales Based On Fuel Usage Graphics PDF. Use them to share invaluable insights on Petrol Engine Vehicles, Diesel Engine Vehicles, Electric Vehicles Sales and impress your audience. This template can be altered and modified as per your expectations. So, grab it now.
Energy Tracking Device Assess Performance Ppt PowerPoint Presentation Infographic Template Aids PDF
Presenting energy tracking device assess performance ppt powerpoint presentation infographic template aids pdf to provide visual cues and insights. Share and navigate important information on six stages that need your due attention. This template can be used to pitch topics like gather and track data, energy conservation projects tracking, establish baselines, benchmarking, analyze data, conduct technical assessments and audits. In addtion, this PPT design contains high-resolution images, graphics, etc, that are easily editable and available for immediate download.

Eco Friendly And Feasibility Management Assess Performance Download PDF
Presenting eco friendly and feasibility management assess performance download pdf. to provide visual cues and insights. Share and navigate important information on six stages that need your due attention. This template can be used to pitch topics like gather and track data, establish baselines, benchmarking, analyze data, conservation projects tracking. In addtion, this PPT design contains high-resolution images, graphics, etc, that are easily editable and available for immediate download.

Hiring Agency Profile With Financial Charts Ppt Model Example PDF
This graph or chart is linked to excel, and changes automatically based on data. Just left click on it and select edit data. Pitch your topic with ease and precision using this hiring agency profile with financial charts ppt model example pdf. This layout presents information on revenue, operating income, operating margin, satisfaction rate. It is also available for immediate download and adjustment. So, changes can be made in the color, design, graphics or any other component to create a unique layout.
Supply Chain Management Operational Metrics Company Timeline Ppt Icon Skills PDF
Presenting supply chain management operational metrics company timeline ppt icon skills pdf. to provide visual cues and insights. Share and navigate important information on seven stages that need your due attention. This template can be used to pitch topics like inbound storage transport data, outbound storage transport data, operation. In addtion, this PPT design contains high resolution images, graphics, etc, that are easily editable and available for immediate download.
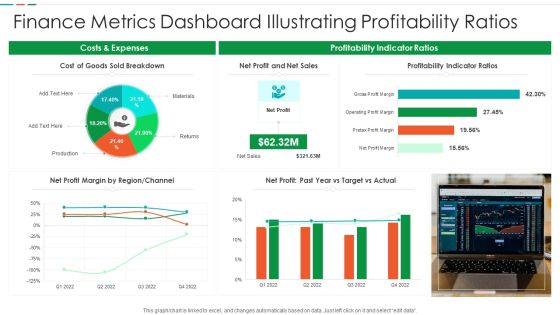
Finance Metrics Dashboard Illustrating Profitability Ratios Diagrams PDF
This graph or chart is linked to excel, and changes automatically based on data. Just left click on it and select edit data. Pitch your topic with ease and precision using this Finance Metrics Dashboard Illustrating Profitability Ratios Diagrams PDF. This layout presents information on Cost Goods Sold, Net Profit Net, Sales Profitability Indicator. It is also available for immediate download and adjustment. So, changes can be made in the color, design, graphics or any other component to create a unique layout.

Finance Metrics Dashboard Indicating Portfolio Performance Microsoft PDF
This graph or chart is linked to excel, and changes automatically based on data. Just left click on it and select edit data. Pitch your topic with ease and precision using this Finance Metrics Dashboard Indicating Portfolio Performance Microsoft PDF. This layout presents information on Portfolio Performance Portfolio, Asset Management Manager, Top 10 Assets. It is also available for immediate download and adjustment. So, changes can be made in the color, design, graphics or any other component to create a unique layout.

Finance Metrics Dashboard Indicating Short Term Assets Download PDF
This graph or chart is linked to excel, and changes automatically based on data. Just left click on it and select edit data. Pitch your topic with ease and precision using this Finance Metrics Dashboard Indicating Short Term Assets Download PDF. This layout presents information on Short Term Assets, Global Financial Performance, Revenue YTD 2022. It is also available for immediate download and adjustment. So, changes can be made in the color, design, graphics or any other component to create a unique layout.
Cash Performance Highlights With Turnover Rate Ppt Ideas Icon PDF
This graph or chart is linked to excel, and changes automatically based on data. Just left click on it and select Edit Data. Pitch your topic with ease and precision using this Cash Performance Highlights With Turnover Rate Ppt Ideas Icon PDF. This layout presents information on Working Capital, Cash Balance, Current Ratio. It is also available for immediate download and adjustment. So, changes can be made in the color, design, graphics or any other component to create a unique layout.

Financial Performance Highlights With Net Profit Margin Ppt Model Ideas PDF
This graph or chart is linked to excel, and changes automatically based on data. Just left click on it and select Edit Data. Pitch your topic with ease and precision using this Financial Performance Highlights With Net Profit Margin Ppt Model Ideas PDF. This layout presents information on Net Profit, Accounts Receivable, Accounts Payable. It is also available for immediate download and adjustment. So, changes can be made in the color, design, graphics or any other component to create a unique layout.

Client Helpline Dashboard Performance Key Metrics Ppt Outline Deck PDF
This graph or chart is linked to excel, and changes automatically based on data. Just left click on it and select Edit Data. Pitch your topic with ease and precision using this Client Helpline Dashboard Performance Key Metrics Ppt Outline Deck PDF. This layout presents information on Key Metrics, Trend, Compare. It is also available for immediate download and adjustment. So, changes can be made in the color, design, graphics or any other component to create a unique layout.

Client Helpline Dashboard With Product Customer Satisfaction Ppt Slides Graphics Template PDF
This graph or chart is linked to excel, and changes automatically based on data. Just left click on it and select Edit Data. Pitch your topic with ease and precision using this Client Helpline Dashboard With Product Customer Satisfaction Ppt Slides Graphics Template PDF. This layout presents information on Customer Satisfaction, Product, Compare. It is also available for immediate download and adjustment. So, changes can be made in the color, design, graphics or any other component to create a unique layout.
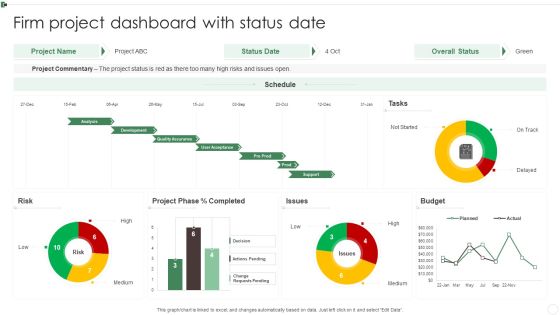
Firm Project Dashboard With Status Date Ppt Infographics Slides PDF
This graph or chart is linked to excel, and changes automatically based on data. Just left click on it and select Edit Data. Pitch your topic with ease and precision using this Firm Project Dashboard With Status Date Ppt Infographics Slides PDF. This layout presents information on Project Commentary, Budget, Project Phase, Risk. It is also available for immediate download and adjustment. So, changes can be made in the color, design, graphics or any other component to create a unique layout.
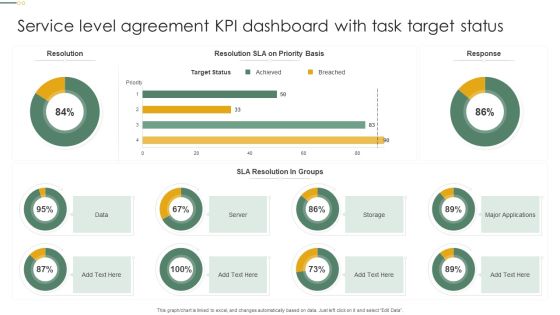
Service Level Agreement KPI Dashboard With Task Target Status Microsoft PDF
This graph or chart is linked to excel, and changes automatically based on data. Just left click on it and select Edit Data. Pitch your topic with ease and precision using this Service Level Agreement KPI Dashboard With Task Target Status Microsoft PDF. This layout presents information on Target Status, Sla Resolution, Groups, Server. It is also available for immediate download and adjustment. So, changes can be made in the color, design, graphics or any other component to create a unique layout.

Company Group Members Demographics Dashboard Overview Clipart PDF
This graph or chart is linked to excel, and changes automatically based on data. Just left click on it and select Edit Data. Pitch your topic with ease and precision using this Company Group Members Demographics Dashboard Overview Clipart PDF. This layout presents information on Headcount Office, Headcount Tenure Range, Headcount Age Range. It is also available for immediate download and adjustment. So, changes can be made in the color, design, graphics or any other component to create a unique layout.

Service SLA KPL Changes And Incidents Dashboard Ppt Inspiration Infographics PDF
This graph or chart is linked to excel, and changes automatically based on data. Just left click on it and select Edit Data. Pitch your topic with ease and precision using this Service SLA KPL Changes And Incidents Dashboard Ppt Inspiration Infographics PDF. This layout presents information on Time Spent Department, Incidents Closed, Operator Group. It is also available for immediate download and adjustment. So, changes can be made in the color, design, graphics or any other component to create a unique layout.

SLA KPL Overview Dashboard Depicting Service Targets Ppt Slides Maker PDF
This graph or chart is linked to excel, and changes automatically based on data. Just left click on it and select Edit Data. Pitch your topic with ease and precision using this SLA KPL Overview Dashboard Depicting Service Targets Ppt Slides Maker PDF. This layout presents information on Monthly Trend, Service Target, Quarterly Trend. It is also available for immediate download and adjustment. So, changes can be made in the color, design, graphics or any other component to create a unique layout.

Doughnut Graph Depicting ROI From Multiple Marketing Activities Rules PDF
This graph or chart is linked to excel, and changes automatically based on data. Just left click on it and select Edit Data. Pitch your topic with ease and precision using this Doughnut Graph Depicting ROI From Multiple Marketing Activities Rules PDF. This layout presents information on Total ROI, Field Campaigns, Print Media, Display Ads. It is also available for immediate download and adjustment. So, changes can be made in the color, design, graphics or any other component to create a unique layout.

Doughnut Graph With Online Employee Recruitment Via Multiple Portals Mockup PDF
This graph or chart is linked to excel, and changes automatically based on data. Just left click on it and select Edit Data. Pitch your topic with ease and precision using this Doughnut Graph With Online Employee Recruitment Via Multiple Portals Mockup PDF. This layout presents information on ABC Employment, Multiple Portals, 2020 To 2022. It is also available for immediate download and adjustment. So, changes can be made in the color, design, graphics or any other component to create a unique layout.
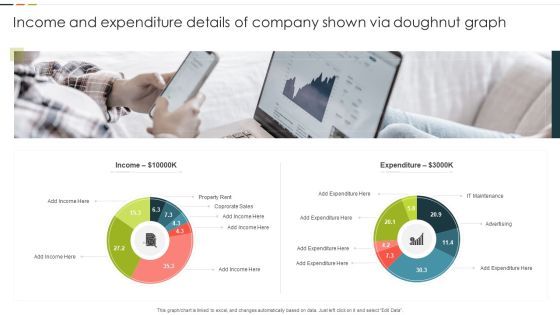
Income And Expenditure Details Of Company Shown Via Doughnut Graph Graphics PDF
This graph or chart is linked to excel, and changes automatically based on data. Just left click on it and select Edit Data. Pitch your topic with ease and precision using this Income And Expenditure Details Of Company Shown Via Doughnut Graph Graphics PDF. This layout presents information on Property Rent, Corporate Sales, Expenditure. It is also available for immediate download and adjustment. So, changes can be made in the color, design, graphics or any other component to create a unique layout.
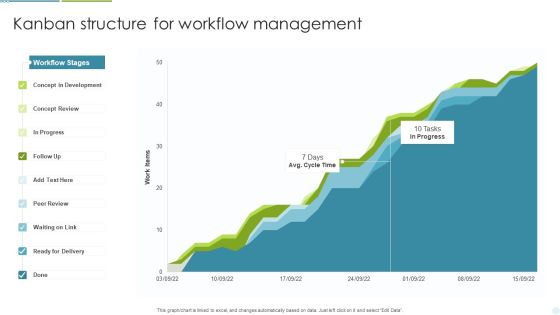
Kanban Structure For Workflow Management Ppt Inspiration Template PDF
This graph or chart is linked to excel, and changes automatically based on data. Just left click on it and select Edit Data. Pitch your topic with ease and precision using this Kanban Structure For Workflow Management Ppt Inspiration Template PDF. This layout presents information on Concept Development, Concept Review, Ready For Delivery. It is also available for immediate download and adjustment. So, changes can be made in the color, design, graphics or any other component to create a unique layout.

Kanban Structure To Manage Weekly Work Activities Ppt Professional Aids PDF
This graph or chart is linked to excel, and changes automatically based on data. Just left click on it and select Edit Data. Pitch your topic with ease and precision using this Kanban Structure To Manage Weekly Work Activities Ppt Professional Aids PDF. This layout presents information on Legend, Ready To Start, In Progress. It is also available for immediate download and adjustment. So, changes can be made in the color, design, graphics or any other component to create a unique layout.

Human Capital Metrics For New Hire Ppt Pictures Brochure PDF
This graph or chart is linked to excel, and changes automatically based on data. Just left click on it and select Edit Data. Pitch your topic with ease and precision using this Human Capital Metrics For New Hire Ppt Pictures Brochure PDF. This layout presents information on Active Employee Count, New Hire Count, New Hire. It is also available for immediate download and adjustment. So, changes can be made in the color, design, graphics or any other component to create a unique layout.

Human Capital Metrics With Absenteeism Rate Ppt Infographic Template Ideas PDF
This graph or chart is linked to excel, and changes automatically based on data. Just left click on it and select Edit Data. Pitch your topic with ease and precision using this Human Capital Metrics With Absenteeism Rate Ppt Infographic Template Ideas PDF. This layout presents information on Overall Labor Effectiveness, OLE Department, Absenteeism. It is also available for immediate download and adjustment. So, changes can be made in the color, design, graphics or any other component to create a unique layout.
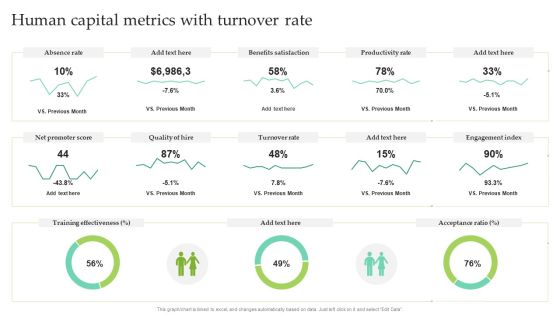
Human Capital Metrics With Turnover Rate Ppt Pictures Outline PDF
This graph or chart is linked to excel, and changes automatically based on data. Just left click on it and select Edit Data. Pitch your topic with ease and precision using this Human Capital Metrics With Turnover Rate Ppt Pictures Outline PDF. This layout presents information on Absence Rate, Benefits Satisfaction, Productivity Rate. It is also available for immediate download and adjustment. So, changes can be made in the color, design, graphics or any other component to create a unique layout.

Product Marketing Leadership Product Marketing Dashboard For Pay Per Microsoft PDF
This graph or chart is linked to excel, and changes automatically based on data. Just left click on it and select Edit Data. Find a pre-designed and impeccable Product Marketing Leadership Product Marketing Dashboard For Pay Per Microsoft PDF. The templates can ace your presentation without additional effort. You can download these easy-to-edit presentation templates to make your presentation stand out from others. So, what are you waiting for Download the template from Slidegeeks today and give a unique touch to your presentation.
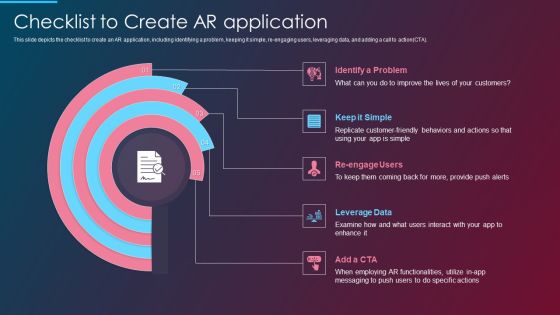
VR And AR IT Checklist To Create AR Application Ppt Summary Background Designs PDF
This slide depicts the checklist to create an AR application, including identifying a problem, keeping it simple, re-engaging users, leveraging data, and adding a call to action CTA. This is a vr and ar it checklist to create ar application ppt summary background designs pdf template with various stages. Focus and dispense information on five stages using this creative set, that comes with editable features. It contains large content boxes to add your information on topics like leverage data, re engage users, keep it simple, identify a problem. You can also showcase facts, figures, and other relevant content using this PPT layout. Grab it now.

Checklist To Create AR Application Ppt PowerPoint Presentation Gallery Graphics Design PDF
This slide depicts the checklist to create an AR application, including identifying a problem, keeping it simple, reengaging users, leveraging data, and adding a call to action CTA. This is a checklist to create ar application ppt powerpoint presentation gallery graphics design pdf template with various stages. Focus and dispense information on five stages using this creative set, that comes with editable features. It contains large content boxes to add your information on topics like identify a problem, re engage users, leverage data. You can also showcase facts, figures, and other relevant content using this PPT layout. Grab it now.
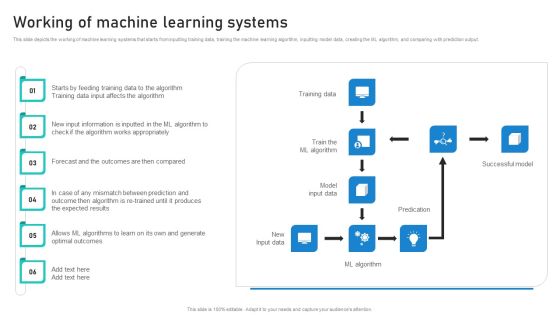
Intelligent Process Automation IPA Working Of Machine Learning Systems Designs PDF
This slide depicts the working of machine learning systems that starts from inputting training data, training the machine learning algorithm, inputting model data, creating the ML algorithm, and comparing with prediction output. Take your projects to the next level with our ultimate collection of Intelligent Process Automation IPA Working Of Machine Learning Systems Designs PDF. Slidegeeks has designed a range of layouts that are perfect for representing task or activity duration, keeping track of all your deadlines at a glance. Tailor these designs to your exact needs and give them a truly corporate look with your own brand colors they will make your projects stand out from the rest
Twitter Company Summary Key Stats And Figures Icons PDF
This slide represents the key stats and figures related to Twitter which includes total active users from United States, average session time, percentage of businesses use Twitter, etc. Presenting Twitter Company Summary Key Stats And Figures Icons PDF to provide visual cues and insights. Share and navigate important information on six stages that need your due attention. This template can be used to pitch topics like Average, digital marketing tool, expand professional network. In addtion, this PPT design contains high resolution images, graphics, etc, that are easily editable and available for immediate download.

Project Management Gap Evaluation Showing Current Status Ppt Styles Graphics Design PDF
This slide contains the project management gap analysis to identity and recognize the difference between the current and the future state on various basis. It includes data, market execution and market analytics. Presenting Project Management Gap Evaluation Showing Current Status Ppt Styles Graphics Design PDF to dispense important information. This template comprises one stages. It also presents valuable insights into the topics including Data, Marketing Execution, Marketing Analytics. This is a completely customizable PowerPoint theme that can be put to use immediately. So, download it and address the topic impactfully.

Kanban Structure With Task Count And Cycle Time Ppt Layouts Background Designs PDF
This graph or chart is linked to excel, and changes automatically based on data. Just left click on it and select Edit Data. Pitch your topic with ease and precision using this Kanban Structure With Task Count And Cycle Time Ppt Layouts Background Designs PDF. This layout presents information on Required Project Design, Project Design Approval, Construct. It is also available for immediate download and adjustment. So, changes can be made in the color, design, graphics or any other component to create a unique layout.

Steps For Developing QA Management Plan Ppt PowerPoint Presentation File Design Ideas PDF
This slide shows the six steps for developing plan for managing the project quality such as understanding quality objectives, gathering and analyzing data, determining deliverables, assigning responsibilities, ensuring quality, designing improvement plan, etc. Persuade your audience using this steps for developing qa management plan ppt powerpoint presentation file design ideas pdf. This PPT design covers six stages, thus making it a great tool to use. It also caters to a variety of topics including understand quality objectives, gather and analyse data, determining quality deliverables. Download this PPT design now to present a convincing pitch that not only emphasizes the topic but also showcases your presentation skills.

SLA KPL Dashboard Illustrating Risk And Active Services Ppt Portfolio Design Inspiration PDF
This graph or chart is linked to excel, and changes automatically based on data. Just left click on it and select Edit Data. Pitch your topic with ease and precision using this SLA KPL Dashboard Illustrating Risk And Active Services Ppt Portfolio Design Inspiration PDF. This layout presents information on My Active SLAs, Database Group, Priority. It is also available for immediate download and adjustment. So, changes can be made in the color, design, graphics or any other component to create a unique layout.

Kaizen Process Timeline With Description Ppt PowerPoint Presentation Gallery Design Ideas PDF
This slide shows the kaizen event timeline which covers event description and responsibility with determining problem statement, assigning roles and responsibilities to team members, defining goals, collecting data, prepare event schedule, securing resources, etc. Persuade your audience using this Kaizen Process Timeline With Description Ppt PowerPoint Presentation Gallery Design Ideas PDF. This PPT design covers one stages, thus making it a great tool to use. It also caters to a variety of topics including Kaizen Event Description, Problem Statement, Collecting Data. Download this PPT design now to present a convincing pitch that not only emphasizes the topic but also showcases your presentation skills.

Product Marketing For Generating Product Marketing Dashboard With Sales Trend Designs PDF
This graph or chart is linked to excel, and changes automatically based on data. Just left click on it and select Edit Data. From laying roadmaps to briefing everything in detail, our templates are perfect for you. You can set the stage with your presentation slides. All you have to do is download these easy-to-edit and customizable templates. Product Marketing For Generating Product Marketing Dashboard With Sales Trend Designs PDF will help you deliver an outstanding performance that everyone would remember and praise you for. Do download this presentation today.

Table Of Contents Digital Currency Extraction Strategy Proposal Designs PDF
Elevate your presentations with our intuitive Table Of Contents Digital Currency Extraction Strategy Proposal Designs PDF template. Whether you are delivering a pitch, sharing data, or presenting ideas, our visually-stunning single-slide PPT template is the perfect tool to captivate your audience. With 100 percent editable features and a user-friendly interface, creating professional presentations has never been easier. Download now and leave a lasting impression.

Netsurf Business Profile Key Statistics And Figures Ppt Infographic Template Graphics Design PDF
This slide showcases the key statistics and figures related to Netsurf company which represents stock points, natural products introduced, total dispatched products, customer base, etc. This is a Netsurf Business Profile Key Statistics And Figures Ppt Infographic Template Graphics Design PDF template with various stages. Focus and dispense information on one stages using this creative set, that comes with editable features. It contains large content boxes to add your information on topics like Product Distribution, Natural Products, Care Products. You can also showcase facts, figures, and other relevant content using this PPT layout. Grab it now.
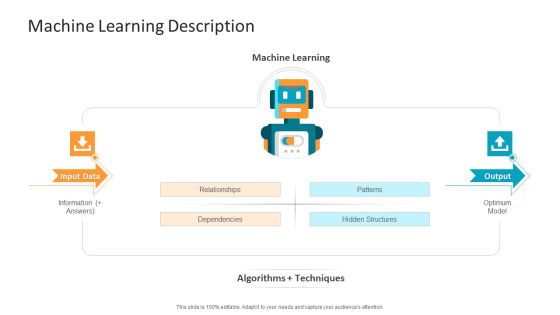
Machine Learning PPT Slides Machine Learning Description Designs PDF
Presenting machine learning ppt slides machine learning description designs pdf to provide visual cues and insights. Share and navigate important information on two stages that need your due attention. This template can be used to pitch topics like input data, output. In addtion, this PPT design contains high resolution images, graphics, etc, that are easily editable and available for immediate download.
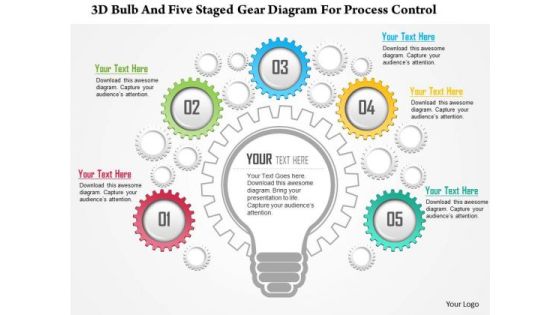
Business Diagram 3d Bulb And Five Staged Gear Diagram For Process Control Presentation Template
This business slide has been designed with graphic of 3d bulb and five staged gear diagram. This business disarm is helpful to depict process controls. Download our above diagram to express information in a visual way.

Key Stats And Figure Movie Editing Company Outline Ideas PDF
This slide showcases the statistics associated with film production house which includes global box office collection, revenue, number of released movies, average hours of production, number of crew members, etc. Retrieve professionally designed Key Stats And Figure Movie Editing Company Outline Ideas PDF to effectively convey your message and captivate your listeners. Save time by selecting pre-made slideshows that are appropriate for various topics, from business to educational purposes. These themes come in many different styles, from creative to corporate, and all of them are easily adjustable and can be edited quickly. Access them as PowerPoint templates or as Google Slides themes. You donot have to go on a hunt for the perfect presentation because Slidegeeks got you covered from everywhere.
Effective NPO Promotional Strategies For Recruit Volunteers Key Statistics And Figures Of Nonprofit Marketing Designs PDF
This slide provides an overview of the nonprofit marketing stats. Major stats covered are marketers find content marketing more effective, funds raised through Instagram, donors use debit and credit cards for donations, etc. Presenting this PowerPoint presentation, titled Effective NPO Promotional Strategies For Recruit Volunteers Key Statistics And Figures Of Nonprofit Marketing Designs PDF, with topics curated by our researchers after extensive research. This editable presentation is available for immediate download and provides attractive features when used. Download now and captivate your audience. Presenting this Effective NPO Promotional Strategies For Recruit Volunteers Key Statistics And Figures Of Nonprofit Marketing Designs PDF. Our researchers have carefully researched and created these slides with all aspects taken into consideration. This is a completely customizable Effective NPO Promotional Strategies For Recruit Volunteers Key Statistics And Figures Of Nonprofit Marketing Designs PDF that is available for immediate downloading. Download now and make an impact on your audience. Highlight the attractive features available with our PPTs.

Tips To Create Compelling Messages For Effective Communication Designs PDF
Presenting tips to create compelling messages for effective communication designs pdf to dispense important information. This template comprises four stages. It also presents valuable insights into the topics including demographic data, interest, communication. This is a completely customizable PowerPoint theme that can be put to use immediately. So, download it and address the topic impactfully.
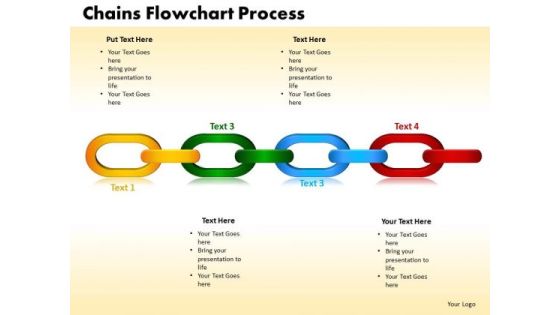
PowerPoint Layouts Chains Flowchart Process Company Ppt Design
PowerPoint Layouts Chains Flowchart Process Company PPT Design-This Chain flowchart is a graphical description of a process. Use it to represent operations, data, threads, etc. relations between which are shown by the interconnected chains.-PowerPoint Layouts Chains Flowchart Process Company PPT Design
Continuous Improvement Process Model For Business Ppt Design
This is a continuous improvement process model for business ppt design. This is a eight stage process. The stages in this process are collect data, process, define problem, develop a solution, test the solution, implement the solution, measure results, feedback variances.

AI High Tech PowerPoint Templates Deep Learning Ppt Designs PDF
Presenting this set of slides with name ai high tech powerpoint templates deep learning ppt designs pdf. This is a five stage process. The stages in this process are understand the problem, identify data, select deep learning algorithm, training the model, test the model. This is a completely editable PowerPoint presentation and is available for immediate download. Download now and impress your audience.
Statistics Graph Business PowerPoint Templates And PowerPoint Themes 0612
Statistics Graph Business PowerPoint Templates And PowerPoint Themes Business PPT-Microsoft Powerpoint Templates and Background with colorful stats icon

Functional Analysis Of Business Operations Infrastructure Industry Key Stats Ppt Gallery Designs Download PDF
Presenting this set of slides with name functional analysis of business operations infrastructure industry key stats ppt gallery designs download pdf. The topics discussed in these slides are networks, capacity, data, servers, utilized. This is a completely editable PowerPoint presentation and is available for immediate download. Download now and impress your audience.

Example Of Digital And Social Crm Ecosystem Diagram Powerpoint Ideas
This is a example of digital and social crm ecosystem diagram powerpoint ideas. This is a thirteen stage process. The stages in this process are customer and production data, web service integration, customer intelligence engine, personalized and predictive recommendations, guide setting, personal content, guided search, behavioral segmentation, integrated solutions, email, mobile, social, web, in store, call center.
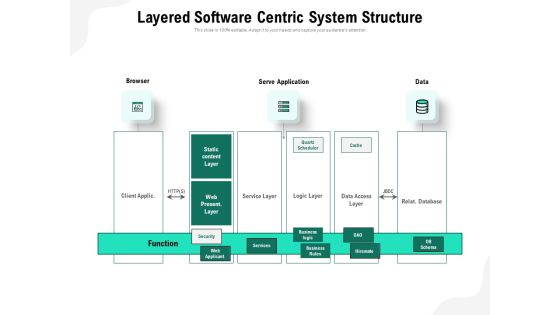
Layered Software Centric System Structure Ppt PowerPoint Presentation Designs Download PDF
Presenting layered software centric system structure ppt powerpoint presentation designs download pdf to dispense important information. This template comprises three stages. It also presents valuable insights into the topics including browser, serve application, data, function. This is a completely customizable PowerPoint theme that can be put to use immediately. So, download it and address the topic impactfully.
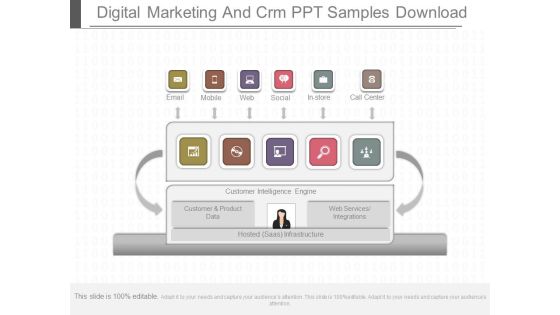
Digital Marketing And Crm Ppt Samples Download
This is a digital marketing and crm ppt samples download. This is a one stage process. The stages in this process are email, mobile, web, social, in store, call center, customer intelligence engine, customer and product data, web services integrations, hosted saas infrastructure.
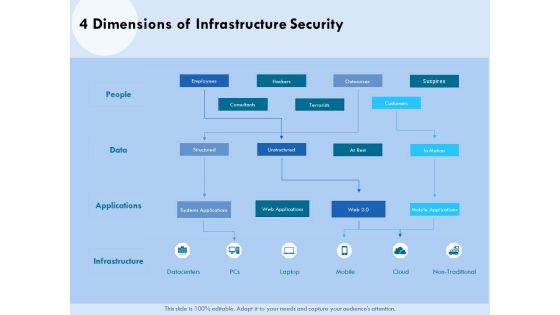
Functional Analysis Of Business Operations 4 Dimensions Of Infrastructure Security Designs PDF
Presenting this set of slides with name functional analysis of business operations 4 dimensions of infrastructure security designs pdf. The topics discussed in these slides are employees, infrastructure, data, mobile, cloud. This is a completely editable PowerPoint presentation and is available for immediate download. Download now and impress your audience.

E Marketing Techniques To Boost Sales Key Stats And Figures Related To Online Marketing Designs PDF
This slide represents the key statistics and figures related to online marketing which includes increase in revenues, reduction in expenses, increases company reputation, etc Want to ace your presentation in front of a live audience Our E Marketing Techniques To Boost Sales Key Stats And Figures Related To Online Marketing Designs PDF can help you do that by engaging all the users towards you. Slidegeeks experts have put their efforts and expertise into creating these impeccable powerpoint presentations so that you can communicate your ideas clearly. Moreover, all the templates are customizable, and easy-to-edit and downloadable. Use these for both personal and commercial use.

Saas Customer Success KPIS Model Ppt PowerPoint Presentation Gallery Designs Download PDF
Pitch your topic with ease and precision using this Saas Customer Success KPIS Model Ppt PowerPoint Presentation Gallery Designs Download PDF. This layout presents information on Customer Surveys, Customer Demographics, Customer Purchase Data. It is also available for immediate download and adjustment. So, changes can be made in the color, design, graphics or any other component to create a unique layout.

5 Riddle For SEO Components For Increasing Website Traffic Designs PDF
Persuade your audience using this 5 Riddle For SEO Components For Increasing Website Traffic Designs PDF. This PPT design covers five stages, thus making it a great tool to use. It also caters to a variety of topics including Data, Visuals, Title. Download this PPT design now to present a convincing pitch that not only emphasizes the topic but also showcases your presentation skills.

Areas Of Improvement For Conflict Resolutions Ppt PowerPoint Presentation Icon Design Inspiration PDF
Presenting areas of improvement for conflict resolutions ppt powerpoint presentation icon design inspiration pdf to dispense important information. This template comprises five stages. It also presents valuable insights into the topics including delay, ego, specialist, advice, data, evaluation. This is a completely customizable PowerPoint theme that can be put to use immediately. So, download it and address the topic impactfully.

Four Stages To Create And Implement Integrated Backup Solution Ppt PowerPoint Presentation Gallery Graphics Design PDF
Presenting four stages to create and implement integrated backup solution ppt powerpoint presentation gallery graphics design pdf to dispense important information. This template comprises four stages. It also presents valuable insights into the topics including monitor, implement, data. This is a completely customizable PowerPoint theme that can be put to use immediately. So, download it and address the topic impactfully.
Contact Details With Name And Designation Ppt PowerPoint Presentation Icon Themes
Presenting this set of slides with name contact details with name and designation ppt powerpoint presentation icon themes. The topics discussed in these slides are contact management, management applications, personal data. This is a completely editable PowerPoint presentation and is available for immediate download. Download now and impress your audience.

Facility Operations Contol Critical Infrastructure Dependencies And Interdependencies Assessment Framework Designs PDF
Presenting this set of slides with name facility operations contol critical infrastructure dependencies and interdependencies assessment framework designs pdf. This is a eight stage process. The stages in this process are expertise, partnership, data, products, tools, infrastructure metrics, agent based and complex adaptive system models. This is a completely editable PowerPoint presentation and is available for immediate download. Download now and impress your audience.

Stages Of Consumer Buying Decision Making Process Ppt PowerPoint Presentation File Design Ideas PDF
Presenting this set of slides with name stages of consumer buying decision making process ppt powerpoint presentation file design ideas pdf. This is a six stage process. The stages in this process are purchase decision, collect data, need recognition. This is a completely editable PowerPoint presentation and is available for immediate download. Download now and impress your audience.

AI High Tech PowerPoint Templates What Is Supervised Machine Learning Ppt Icon Designs PDF
Presenting this set of slides with name ai high tech powerpoint templates what is supervised machine learning ppt icon designs pdf. The topics discussed in these slides are algorithm, processing, output, input raw data. This is a completely editable PowerPoint presentation and is available for immediate download. Download now and impress your audience.
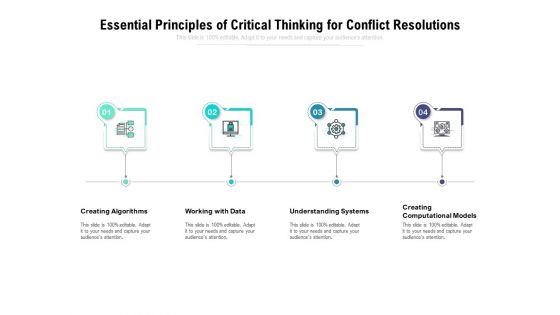
Essential Principles Of Critical Thinking For Conflict Resolutions Ppt PowerPoint Presentation Slides Graphics Design PDF
Presenting this set of slides with name essential principles of critical thinking for conflict resolutions ppt powerpoint presentation slides graphics design pdf. This is a four stage process. The stages in this process are creating algorithms, working with data, understanding systems, creating computational models. This is a completely editable PowerPoint presentation and is available for immediate download. Download now and impress your audience.

Online Marketing With Conversion Rate Optimization Ppt PowerPoint Presentation Gallery Graphics Design PDF
Presenting this set of slides with name online marketing with conversion rate optimization ppt powerpoint presentation gallery graphics design pdf. The topics discussed in these slides are marketing, social media, big data. This is a completely editable PowerPoint presentation and is available for immediate download. Download now and impress your audience.

Civil Infrastructure Designing Services Management 4 Dimensions Of Infrastructure Security Slides PDF
Deliver an awe inspiring pitch with this creative civil infrastructure designing services management 4 dimensions of infrastructure security slides pdf bundle. Topics like applications, data, infrastructure, outsources, employees can be discussed with this completely editable template. It is available for immediate download depending on the needs and requirements of the user.
Ppt Consecutive Example Of 5 PowerPoint Slide Numbers Through Arrows Templates
PPT consecutive example of 5 powerpoint slide numbers through arrows Templates-The above template displays a diagram of circles connected with arrows. This is a graphic organizer for recording related ideas about a concept. It can be used to emphasize direction of movement and interconnections of stages in a flow. Deliver amazing presentations to mesmerize your audience.-PPT consecutive example of 5 powerpoint slide numbers through arrows Templates-3d, Abstract, Arrow, Circle, Circular, Click, Computer, Data, Direction, Graphic, Icon, Illustration, Insignia, Intention, Internet, Isolated, Label, Mail, Mascot, Media, Menu, Motion, Page, Pushing, Search, Shiny, Sign, Simple, Symbol
Ppt Consecutive Sample Of 5 Steps Through Curved Arrows PowerPoint 2010 Templates
PPT consecutive sample of 5 steps through curved arrows powerpoint 2010 Templates-The above template displays a diagram of circles connected with arrows. This is a graphic organizer for recording related ideas about a concept. It can be used to emphasize direction of movement and interconnections of stages in a flow. Deliver amazing presentations to mesmerize your audience.-PPT consecutive sample of 5 steps through curved arrows powerpoint 2010 Templates-3d, Abstract, Arrow, Circle, Circular, Click, Computer, Data, Direction, Graphic, Icon, Illustration, Insignia, Intention, Internet, Isolated, Label, Mail, Mascot, Media, Menu, Motion, Page, Pushing, Search, Shiny, Sign, Simple, Symbol
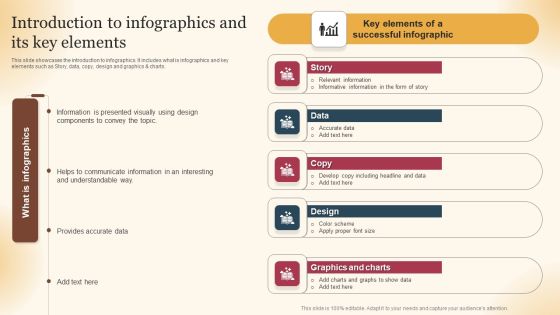
Qualified Traffic Generation Through Search Engines Introduction To Infographics And Its Key Elements Structure PDF
This slide showcases the introduction to infographics. It includes what is infographics and key elements such as Story, data, copy, design and graphics and charts. Presenting this PowerPoint presentation, titled Qualified Traffic Generation Through Search Engines Introduction To Infographics And Its Key Elements Structure PDF, with topics curated by our researchers after extensive research. This editable presentation is available for immediate download and provides attractive features when used. Download now and captivate your audience. Presenting this Qualified Traffic Generation Through Search Engines Introduction To Infographics And Its Key Elements Structure PDF. Our researchers have carefully researched and created these slides with all aspects taken into consideration. This is a completely customizable Qualified Traffic Generation Through Search Engines Introduction To Infographics And Its Key Elements Structure PDF that is available for immediate downloading. Download now and make an impact on your audience. Highlight the attractive features available with our PPTs.
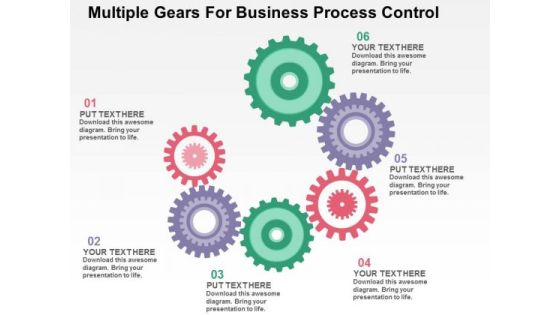
Multiple Gears For Business Process Control PowerPoint Template
This business diagram has been designed with multiple gears. It may use to display task management and process control. Prove the viability of your ideas to help your organization to achieve the quality and success required.
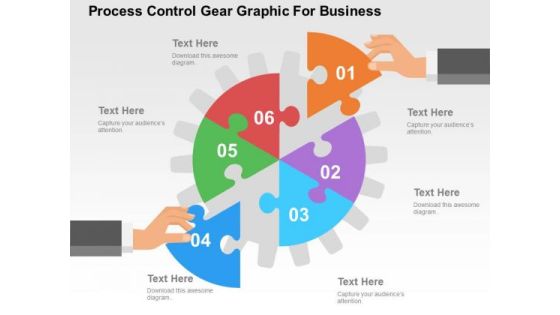
Process Control Gear Graphic For Business PowerPoint Template
Our professionally designed gear diagram is as an effective tool for communicating ideas. It contains graphics of gear with six segments. Convey your views with this diagram slide. It will amplify the strength of your logic.

Engineering Quarterly Roadmap For Blockchain Development Infographics
Introducing our engineering quarterly roadmap for blockchain development infographics. This PPT presentation is Google Slides compatible, therefore, you can share it easily with the collaborators for measuring the progress. Also, the presentation is available in both standard screen and widescreen aspect ratios. So edit the template design by modifying the font size, font type, color, and shapes as per your requirements. As this PPT design is fully editable it can be presented in PDF, JPG and PNG formats.

Quarterly Software Engineering Elearning Program Roadmap Themes
Introducing our quarterly software engineering elearning program roadmap themes. This PPT presentation is Google Slides compatible, therefore, you can share it easily with the collaborators for measuring the progress. Also, the presentation is available in both standard screen and widescreen aspect ratios. So edit the template design by modifying the font size, font type, color, and shapes as per your requirements. As this PPT design is fully editable it can be presented in PDF, JPG and PNG formats.
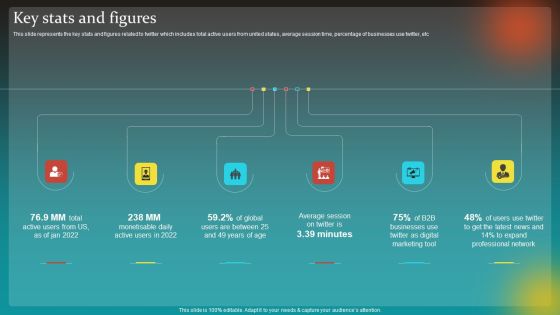
Social Network Business Summary Key Stats And Figures Ideas PDF
This slide represents the key stats and figures related to twitter which includes total active users from united states, average session time, percentage of businesses use twitter, etc Find a pre designed and impeccable Social Network Business Summary Key Stats And Figures Ideas PDF. The templates can ace your presentation without additional effort. You can download these easy to edit presentation templates to make your presentation stand out from others. So, what are you waiting for Download the template from Slidegeeks today and give a unique touch to your presentation.
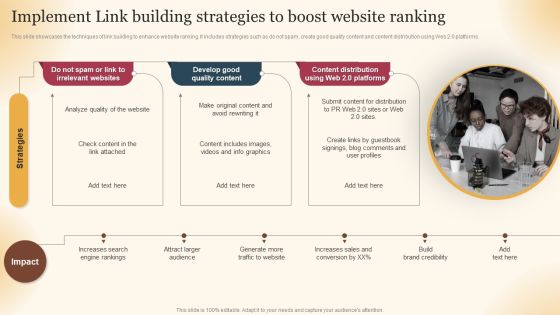
Qualified Traffic Generation Through Search Engines Implement Link Building Strategies Boost Guidelines PDF
This slide showcases the techniques of link building to enhance website ranking. It includes strategies such as do not spam, create good quality content and content distribution using Web 2.0 platforms. The Qualified Traffic Generation Through Search Engines Implement Link Building Strategies Boost Guidelines PDF is a compilation of the most recent design trends as a series of slides. It is suitable for any subject or industry presentation, containing attractive visuals and photo spots for businesses to clearly express their messages. This template contains a variety of slides for the user to input data, such as structures to contrast two elements, bullet points, and slides for written information. Slidegeeks is prepared to create an impression.

Mobile Search Engine Optimization Plan Roles And Responsibilities Of Mobile SEO Team Elements PDF
The purpose of this slide is to outline major roles and responsibilities of key stakeholders involved in mobile search engine optimization SEO team. The stakeholders are senior content manager, SEO manager, paid search manager and technical product team. The Mobile Search Engine Optimization Plan Roles And Responsibilities Of Mobile SEO Team Elements PDF is a compilation of the most recent design trends as a series of slides. It is suitable for any subject or industry presentation, containing attractive visuals and photo spots for businesses to clearly express their messages. This template contains a variety of slides for the user to input data, such as structures to contrast two elements, bullet points, and slides for written information. Slidegeeks is prepared to create an impression.

Apparel Ecommerce Business Strategy Search Engine Optimization Success Pyramid Topics PDF
This slide depicts the SEO success pyramid that includes quality content, keyword research, link building and social media. It further includes impact which are build trust and credibility, understand customer needs, improve conversion and search ranking. The Apparel Ecommerce Business Strategy Search Engine Optimization Success Pyramid Topics PDF is a compilation of the most recent design trends as a series of slides. It is suitable for any subject or industry presentation, containing attractive visuals and photo spots for businesses to clearly express their messages. This template contains a variety of slides for the user to input data, such as structures to contrast two elements, bullet points, and slides for written information. Slidegeeks is prepared to create an impression.

Numeric Design Circle Text Boxes Powerpoint Template

3d Consecutive Flow Process 5 Concepts Tech Support Chart PowerPoint Slides
We present our 3d consecutive flow process 5 concepts tech support chart PowerPoint Slides. Use our Arrows PowerPoint Templates because, are the symbols of human growth. Use our Business PowerPoint Templates because, our template will help pinpoint their viability. Use our Design PowerPoint Templates because, the pyramid is a symbol of the desire to reach the top in a steady manner. Use our Signs PowerPoint Templates because, The foundation stones of many a life. Use our Metaphor PowerPoint Templates because, Listen to ideas and thoughts. Use these PowerPoint slides for presentations relating to Abstract, Action, Attach, Box, Business, Center, Chain, Chart, Color, Communication, Concept, Connection, Cube, Cycle, Data, Diagram, Flow, Globe, Horizontal, Idea, Illustration, Individual, Information, Interaction, Jigsaw, Join, Link, Merge, Missing, Opportunity, Part, People, Piece, Pieces, Process, Puzzle, Relation, Relationship, Search, Shape, Silhouette, Success. The prominent colors used in the PowerPoint template are Green, Gray, and Black
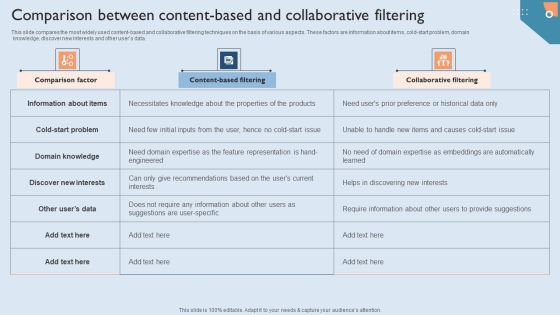
Recommendation Techniques Comparison Between Content Based And Collaborative Filtering Formats PDF
This slide compares the most widely used content-based and collaborative filtering techniques on the basis of various aspects. These factors are information about items, cold-start problem, domain knowledge, discover new interests and other users data. Coming up with a presentation necessitates that the majority of the effort goes into the content and the message you intend to convey. The visuals of a PowerPoint presentation can only be effective if it supplements and supports the story that is being told. Keeping this in mind our experts created Recommendation Techniques Comparison Between Content Based And Collaborative Filtering Formats PDF to reduce the time that goes into designing the presentation. This way, you can concentrate on the message while our designers take care of providing you with the right template for the situation.
PowerPoint Slide Triangle Process Graphic Ppt Designs
PowerPoint Slide triangle process Graphic PPT Designs-This Triangle Process Graphic is an attractive template superbly designed to illustrate various components of a same process effectively.-business, chart, color, concept, conceptual, construction, corporate, creating, data, design, diagram, direction, focus, graph, group, growth, hierarchy, illustration, information, isolated, layer, layered, level, manage, management, model, object, organization, performance, population, presentation, principal, process, progress, pyramid, rank, resource, shape, stage, structure, support, symbol, top, triangle, vector-PowerPoint Slide triangle process Graphic PPT Designs
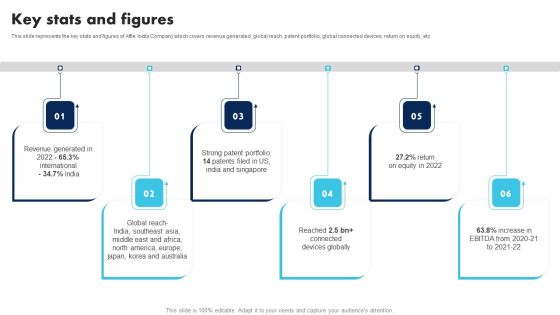
Information Technology Solutions Company Outline Key Stats And Figures Download PDF
This slide represents the key stats and figures of Affle India Company which covers revenue generated, global reach, patent portfolio, global connected devices, return on equity, etc If you are looking for a format to display your unique thoughts, then the professionally designed Information Technology Solutions Company Outline Key Stats And Figures Download PDF is the one for you. You can use it as a Google Slides template or a PowerPoint template. Incorporate impressive visuals, symbols, images, and other charts. Modify or reorganize the text boxes as you desire. Experiment with shade schemes and font pairings. Alter, share or cooperate with other people on your work. Download Information Technology Solutions Company Outline Key Stats And Figures Download PDF and find out how to give a successful presentation. Present a perfect display to your team and make your presentation unforgettable.

Key Statistics And Figures Associated With Sales Automation Summary And Significance Of Sales Automation Designs PDF
This slide represents the key statistics related to sales automation which includes percentage of companies that prefer implementation of sales automation due to prospecting, better customer experience, etc. Coming up with a presentation necessitates that the majority of the effort goes into the content and the message you intend to convey. The visuals of a PowerPoint presentation can only be effective if it supplements and supports the story that is being told. Keeping this in mind our experts created Key Statistics And Figures Associated With Sales Automation Summary And Significance Of Sales Automation Designs PDF to reduce the time that goes into designing the presentation. This way, you can concentrate on the message while our designers take care of providing you with the right template for the situation.

Charity Fundraising Marketing Plan Key Statistics And Figures Of Video Marketing Information PDF
This slide provides an overview of the video marketing stats. Major stats covered are marketers use videos to engage donors, train volunteers, fundraising events, poll sessions, etc. Do you know about Slidesgeeks Charity Fundraising Marketing Plan Key Statistics And Figures Of Video Marketing Information PDF These are perfect for delivering any kind od presentation. Using it, create PowerPoint presentations that communicate your ideas and engage audiences. Save time and effort by using our pre-designed presentation templates that are perfect for a wide range of topic. Our vast selection of designs covers a range of styles, from creative to business, and are all highly customizable and easy to edit. Download as a PowerPoint template or use them as Google Slides themes.
Quarterly Global Engineering Roadmap For Semiconductors Guidelines
Presenting the quarterly global engineering roadmap for semiconductors guidelines. The template includes a roadmap that can be used to initiate a strategic plan. Not only this, the PowerPoint slideshow is completely editable and you can effortlessly modify the font size, font type, and shapes according to your needs. This PPT slide can be easily reached in standard screen and widescreen aspect ratios. The set is also available in various formats like PDF, PNG, and JPG. So download and use it multiple times as per your knowledge.

Career Path Of Software Engineer Designs PDF
Showcasing this set of slides titled career path of software engineer designs pdf. The topics addressed in these templates are technical track, management track, coaching track. All the content presented in this PPT design is completely editable. Download it and make adjustments in color, background, font etc. as per your unique business setting.

Acquiring Clients Through Search Engine And Native Ads Overview And Key Statistics Of Native Advertising Pictures PDF
This slide showcases native advertisement overview and key statistics which can help to evaluate the effectiveness of this ad format. It also include benefits that are - non disruptive advertisement, targeting capabilities and high credibility. The Acquiring Clients Through Search Engine And Native Ads Overview And Key Statistics Of Native Advertising Pictures PDF is a compilation of the most recent design trends as a series of slides. It is suitable for any subject or industry presentation, containing attractive visuals and photo spots for businesses to clearly express their messages. This template contains a variety of slides for the user to input data, such as structures to contrast two elements, bullet points, and slides for written information. Slidegeeks is prepared to create an impression.

Grid Computing In Engineering Oriented Designs PDF
This slide talks about using grid computing in engineering-oriented applications, and it drastically reduces the resource-intensive engineering applications cost. NASAs information power grid also implements it. From laying roadmaps to briefing everything in detail, our templates are perfect for you. You can set the stage with your presentation slides. All you have to do is download these easy to edit and customizable templates. Grid Computing In Engineering Oriented Designs PDF will help you deliver an outstanding performance that everyone would remember and praise you for. Do download this presentation today.
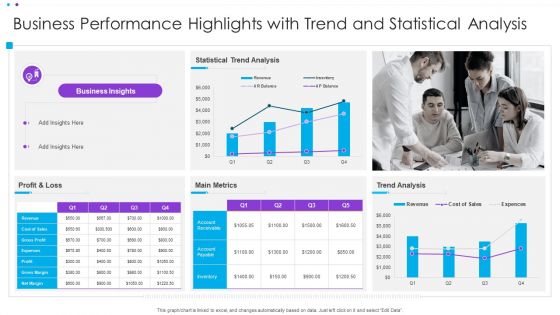
Business Performance Highlights With Trend And Statistical Analysis Ppt Infographic Template Display PDF
This graph or chart is linked to excel, and changes automatically based on data. Just left click on it and select Edit Data. Pitch your topic with ease and precision using this Business Performance Highlights With Trend And Statistical Analysis Ppt Infographic Template Display PDF. This layout presents information on Statistical Trend Analysis, Main Metrics, Profit And Loss. It is also available for immediate download and adjustment. So, changes can be made in the color, design, graphics or any other component to create a unique layout.

Power Plant Energy Production Dashboard For Consumption Statistics Download PDF
This graph or chart is linked to excel, and changes automatically based on data. Just left click on it and select edit data. Pitch your topic with ease and precision using this Multiple Country Energy Consumption Statistics Comparison Dashboard Formats PDF. This layout presents information on August Year 2022, Return on Investments, Power Plan Detail . It is also available for immediate download and adjustment. So, changes can be made in the color, design, graphics or any other component to create a unique layout.

Organizing Security Awareness Major Statistics Of Cyber Security Awareness Formats PDF
This graph or chart is linked to excel, and changes automatically based on data. Just left click on it and select Edit Data. Welcome to our selection of the Organizing Security Awareness Major Statistics Of Cyber Security Awareness Formats PDF. These are designed to help you showcase your creativity and bring your sphere to life. Planning and Innovation are essential for any business that is just starting out. This collection contains the designs that you need for your everyday presentations. All of our PowerPoints are 100 percent editable, so you can customize them to suit your needs. This multi-purpose template can be used in various situations. Grab these presentation templates today.
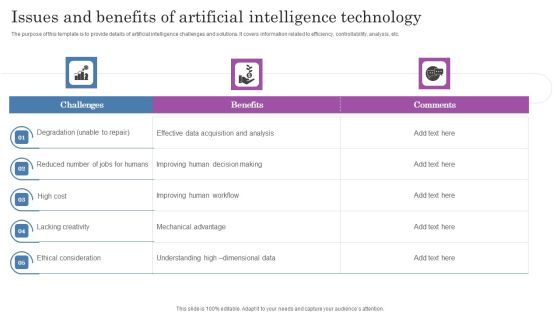
Issues And Benefits Of Artificial Intelligence Technology Designs PDF
The purpose of this template is to provide details of artificial intelligence challenges and solutions. It covers information related to efficiency, controllability, analysis, etc. Showcasing this set of slides titled Issues And Benefits Of Artificial Intelligence Technology Designs PDF. The topics addressed in these templates are High Cost, Dimensional Data, Benefits. All the content presented in this PPT design is completely editable. Download it and make adjustments in color, background, font etc. as per your unique business setting.

Service Level Agreement KPI Dashboard With Current Risk Statistics Topics PDF
This graph or chart is linked to excel, and changes automatically based on data. Just left click on it and select Edit Data. Pitch your topic with ease and precision using this Service Level Agreement KPI Dashboard With Current Risk Statistics Topics PDF. This layout presents information on Current Risk SLAS, Current Breached Slas, Personal Active SLA It is also available for immediate download and adjustment. So, changes can be made in the color, design, graphics or any other component to create a unique layout.
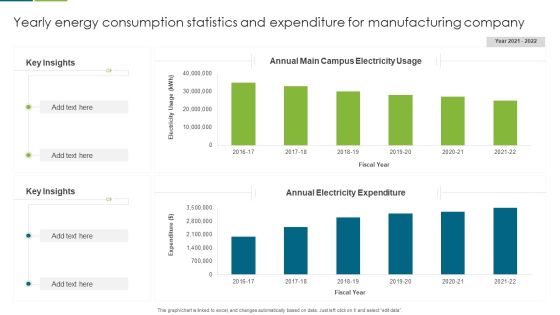
Yearly Energy Consumption Statistics And Expenditure For Manufacturing Company Guidelines PDF
This graph or chart is linked to excel, and changes automatically based on data. Just left click on it and select edit data. Pitch your topic with ease and precision using this Yearly Energy Consumption Statistics And Expenditure For Manufacturing Company Guidelines PDF. This layout presents information on Key Insights, Annual Electricity Expenditure, Annual Main Campus, Electricity Usage. It is also available for immediate download and adjustment. So, changes can be made in the color, design, graphics or any other component to create a unique layout.

Engineering Enterprise Competitive Competitive Analysis Matrix For Engineering Information PDF
The slide highlights the competitive analysis matrix for engineering companies. It compares companies on the basis of market growth and market share. It differentiates companies into contenders, niche, leaders and high performers. Slidegeeks is one of the best resources for PowerPoint templates. You can download easily and regulate Engineering Enterprise Competitive Competitive Analysis Matrix For Engineering Information PDF for your personal presentations from our wonderful collection. A few clicks is all it takes to discover and get the most relevant and appropriate templates. Use our Templates to add a unique zing and appeal to your presentation and meetings. All the slides are easy to edit and you can use them even for advertisement purposes.
PowerPoint Slide Designs Triangle Process Chart Ppt Template
PowerPoint Slide Designs triangle process Chart PPT Template-Use this diagram to show containment, proportional, or interconnected relationships. You can add text in the triangular shapes-Business, chart, color, concept, conceptual, construction, corporate, creating, data, design, diagram, direction, focus, graph, group, growth, hierarchy, illustration, information, isolated, layer, layered, level, manage, management, model, object, organization, performance, population, presentation, principal, process, progress, pyramid, rank, resource, shape, stage, structure, support, symbol, top, triangle, vector-PowerPoint Slide Designs triangle process Chart PPT Template

Enterprise It Evolution Knowledge Management Framework Designs PDF
This slide shows model of information technology knowledge management model. It includes innovation, business, data, information, operations and security model. Presenting Enterprise It Evolution Knowledge Management Framework Designs PDF to dispense important information. This template comprises six stages. It also presents valuable insights into the topics including Security Model, Operations Model, Information Model. This is a completely customizable PowerPoint theme that can be put to use immediately. So, download it and address the topic impactfully.
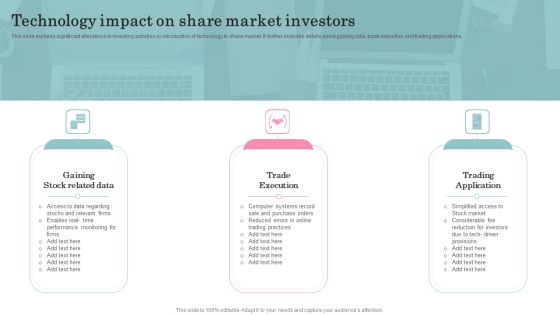
Technology Impact On Share Market Investors Brochure PDF
This slide explains significant alterations in investing activities by introduction of technology in share market. It further includes details about gaining data, trade execution and trading applications. Persuade your audience using this Technology Impact On Share Market Investors Brochure PDF. This PPT design covers Three stages, thus making it a great tool to use. It also caters to a variety of topics including Gaining Stock Related Data, Trade Execution, Trading Application. Download this PPT design now to present a convincing pitch that not only emphasizes the topic but also showcases your presentation skills.

Corporate Analysis Flowchart To Improve Working Productivity Infographics PDF
This slide covers organizational diagnosis flowchart to improve working productivity. It involves identify problem area, gather data, analyze, feedback, diagnosis and monitor results. Persuade your audience using this Corporate Analysis Flowchart To Improve Working Productivity Infographics PDF. This PPT design covers one stages, thus making it a great tool to use. It also caters to a variety of topics including Analyze, Gather Data, Working Productivity. Download this PPT design now to present a convincing pitch that not only emphasizes the topic but also showcases your presentation skills.
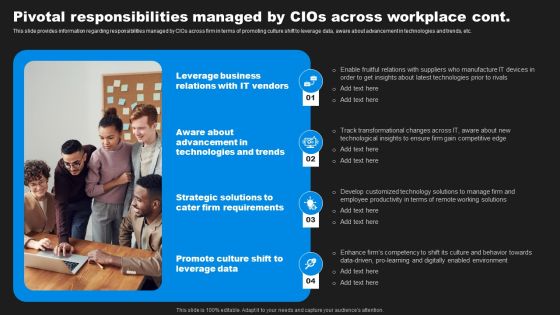
Enhancing Information Technology With Strategic Pivotal Responsibilities Managed Elements PDF
This slide provides information regarding responsibilities managed by CIOs across firm in terms of promoting culture shift to leverage data, aware about advancement in technologies and trends, etc. The Enhancing Information Technology With Strategic Pivotal Responsibilities Managed Elements PDF is a compilation of the most recent design trends as a series of slides. It is suitable for any subject or industry presentation, containing attractive visuals and photo spots for businesses to clearly express their messages. This template contains a variety of slides for the user to input data, such as structures to contrast two elements, bullet points, and slides for written information. Slidegeeks is prepared to create an impression.
