Data Architect
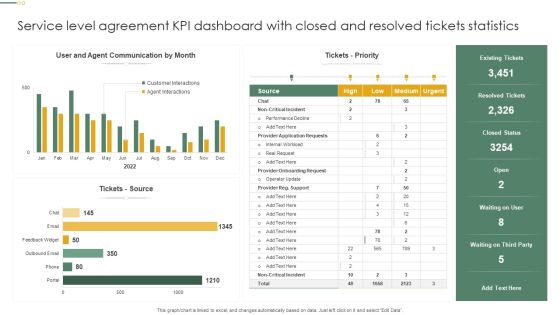
Service Level Agreement KPI Dashboard With Closed And Resolved Tickets Statistics Inspiration PDF
This graph or chart is linked to excel, and changes automatically based on data. Just left click on it and select Edit Data. Showcasing this set of slides titled Service Level Agreement KPI Dashboard With Closed And Resolved Tickets Statistics Inspiration PDF. The topics addressed in these templates are Tickets Priority, Tickets Source, Resolved Tickets. All the content presented in this PPT design is completely editable. Download it and make adjustments in color, background, font etc. as per your unique business setting.

Business Diagram Circles For Percentage Growth Presentation Template
This business slide has been designed with graphics of circles. You may download this diagram to display percentage growth data. This template is innovatively designed to highlight your worthy views
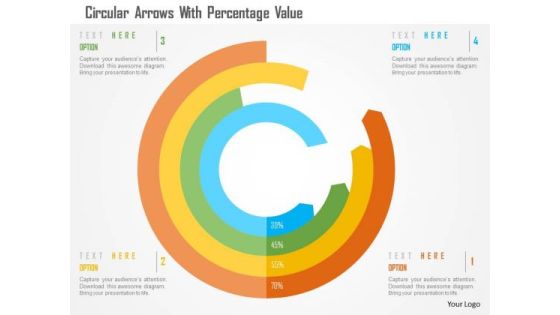
Business Diagram Circular Arrows With Percentage Value Presentation Template
This business slide has been designed with circular arrows. You may download this diagram to display percentage growth data. This template is innovatively designed to highlight your worthy views

Cloud Based Product Development Process Ppt Idea
This is a cloud based product development process ppt idea. This is a five stage process. The stages in this process are make, design, visualize, collaborate, use, design data.
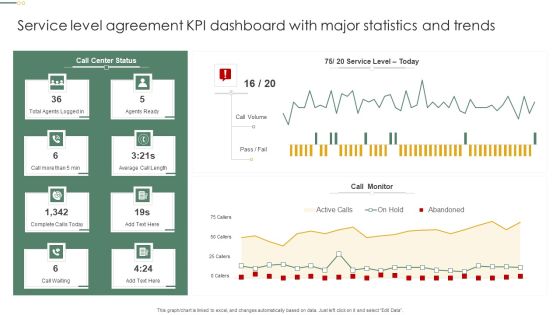
Service Level Agreement KPI Dashboard With Major Statistics And Trends Pictures PDF
This graph or chart is linked to excel, and changes automatically based on data. Just left click on it and select Edit Data. Pitch your topic with ease and precision using this Service Level Agreement KPI Dashboard With Major Statistics And Trends Pictures PDF. This layout presents information on Call Monitor, Call Volume, Agents Ready. It is also available for immediate download and adjustment. So, changes can be made in the color, design, graphics or any other component to create a unique layout.

Website Traffic Analysis Diagram Presentation Layouts
This is a website traffic analysis diagram presentation layouts. This is a four stage process. The stages in this process are keywords used, design analysis, define goals, collect data, web analysis process.

Business Framework Matrix Analysis PowerPoint Presentation
Display the matrix analysis with our new business framework power point template. This PPT has been designed with matrix graphic. Add this matrix in your analysis presentation for business or marketing data.

3 Modern Practices Of Human Resource Management Functions Designs PDF
This slide depicts 3 modern practices of human resource functions beneficial for self development and career growth of employees. This includes information about empathetic, focus on data, analyzing and strategizing. Presenting 3 modern practices of human resource management functions designs pdf to dispense important information. This template comprises three stages. It also presents valuable insights into the topics including empathetic, analyzing and strategizing, focus on data. This is a completely customizable PowerPoint theme that can be put to use immediately. So, download it and address the topic impactfully.

Six Months Roadmap To Develop Mobile Seo Strategy Mobile Search Engine Optimization Guide Background PDF
The Six Months Roadmap To Develop Mobile Seo Strategy Mobile Search Engine Optimization Guide Background PDF is a compilation of the most recent design trends as a series of slides. It is suitable for any subject or industry presentation, containing attractive visuals and photo spots for businesses to clearly express their messages. This template contains a variety of slides for the user to input data, such as structures to contrast two elements, bullet points, and slides for written information. Slidegeeks is prepared to create an impression.

Four Arrows Tags Infographics Powerpoint Template
The above PowerPoint slide displays four arrows design with icons. This PowerPoint diagram helps to summarize complex business data. Adjust the above diagram in your business presentations to visually support your content.
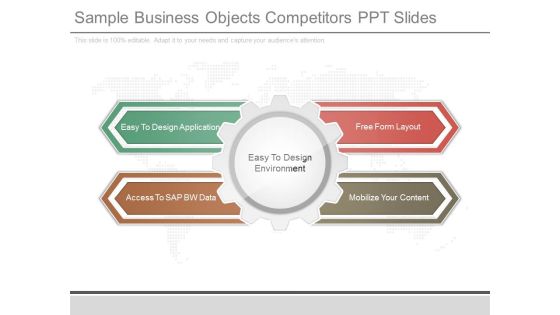
Sample Business Objects Competitors Ppt Slides
This is a sample business objects competitors ppt slides. This is a four stage process. The stages in this process are easy to design application, free form layout, access to sap bw data, mobilize your content.
Stock Photo Card Board Download Arrow Icon PowerPoint Slide
This image slide is designed with cardboard and download arrow. This image contains the graphic of download icon with cardboard depicting downloading and storage of data. Use this image to make outstanding presentations.

Business Framework Shed Light On Topic Flashlight PowerPoint Presentation
This Power Point template slide has been designed with graphic of torch. This flash light has been used to display the concept of highlighting the any business data. Use this business slide for your technical presentation.

Business Diagram Four Options Layout Diagram For Business Presentation Template
Four options circular diagram is used to design this power point template. This business diagram can be used to compare and present data. Use this diagram to make your presentations more effective.
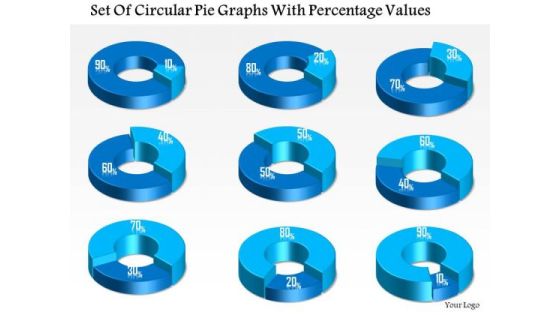
Business Diagram Set Of Circular Pie Graphs With Percentage Values Presentation Template
This business diagram displays set of pie charts. This Power Point template has been designed to compare and present business data. Download this diagram to represent stages of business growth.
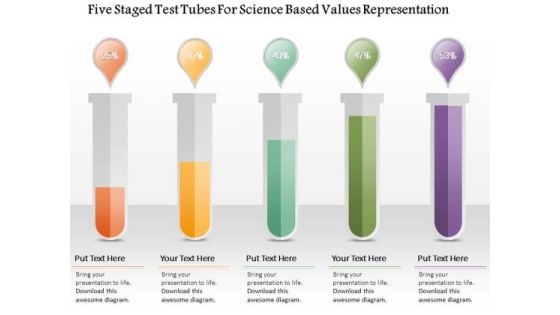
Busines Diagram Five Staged Test Tubes For Science Based Values Representation Ppt Template
Five staged test tubes are used to design this business diagram. This business slide contains the concept of value representation based on scientific data. Ideas are best expressed easily with the help of this diagram slide
Four Staged Pie Chart With Icons Powerpoint Templates
A good quality PowerPoint template is the foundation for every presentation. This PPT slide contains graphics of pie chart. Download this slide to outline business data. This slide is innovatively designed to highlight your worthy views.

Market Research Analyst Layout Ppt Templates
This is a market research analyst layout ppt templates. This is a five stage process. The stages in this process are problem definition, specifying research objectives, creating the research design, collect the data, analyze and evaluate result.
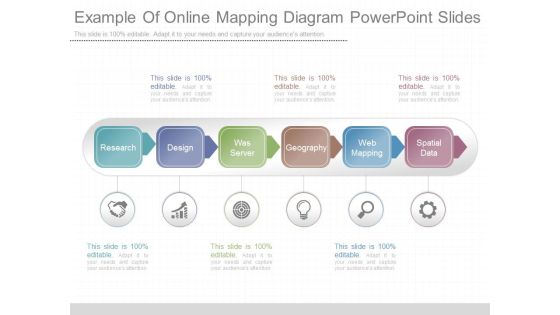
Example Of Online Mapping Diagram Powerpoint Slides
This is a example of online mapping diagram powerpoint slides. This is a six stage process. The stages in this process are research, design, was server, geography, web mapping, spatial data.
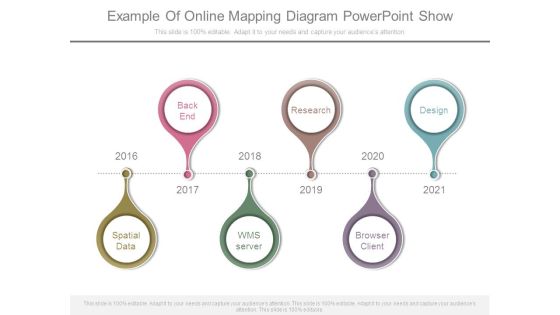
Example Of Online Mapping Diagram Powerpoint Show
This is a example of online mapping diagram powerpoint show. This is a six stage process. The stages in this process are back end, research, design, spatial data, wms server, browser client.

Search Engine Marketing Campaign Keyword Optimization Research Report Pictures PDF
The following slide depicts the projected keyword improvement report to evaluate increase or decrease outcomes due to campaign efforts. It includes key elements such as impression, clicks, click through rate CTR, average ranking etc. The Search Engine Marketing Campaign Keyword Optimization Research Report Pictures PDF is a compilation of the most recent design trends as a series of slides. It is suitable for any subject or industry presentation, containing attractive visuals and photo spots for businesses to clearly express their messages. This template contains a variety of slides for the user to input data, such as structures to contrast two elements, bullet points, and slides for written information. Slidegeeks is prepared to create an impression.
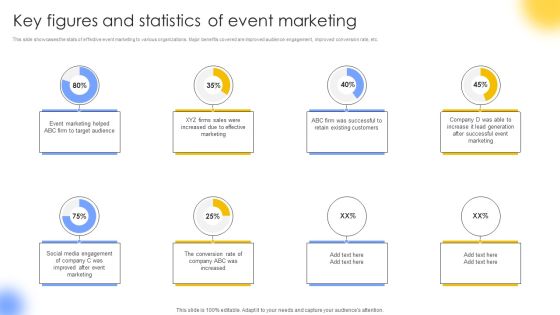
Key Figures And Statistics Of Event Marketing Portrait PDF
This slide showcases the stats of effective event marketing to various organizations. Major benefits covered are improved audience engagement, improved conversion rate, etc. If you are looking for a format to display your unique thoughts, then the professionally designed Key Figures And Statistics Of Event Marketing Portrait PDF is the one for you. You can use it as a Google Slides template or a PowerPoint template. Incorporate impressive visuals, symbols, images, and other charts. Modify or reorganize the text boxes as you desire. Experiment with shade schemes and font pairings. Alter, share or cooperate with other people on your work. Download Key Figures And Statistics Of Event Marketing Portrait PDF and find out how to give a successful presentation. Present a perfect display to your team and make your presentation unforgettable.
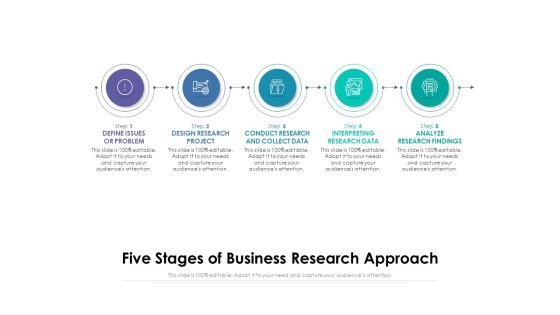
Five Stages Of Business Research Approach Ppt PowerPoint Presentation Summary Tips PDF
Persuade your audience using this five stages of business research approach ppt powerpoint presentation summary tips pdf. This PPT design covers five stages, thus making it a great tool to use. It also caters to a variety of topics including define issues or problem, design research project, conduct research and collect data, interpreting research data, analyze research findings. Download this PPT design now to present a convincing pitch that not only emphasizes the topic but also showcases your presentation skills.

Jigsaw Depicting 4 Stages Of Continual Service Improvement Process Slides PDF
Persuade your audience using this Jigsaw Depicting 4 Stages Of Continual Service Improvement Process Slides PDF. This PPT design covers four stages, thus making it a great tool to use. It also caters to a variety of topics including Measured, Gather Data, Process Data. Download this PPT design now to present a convincing pitch that not only emphasizes the topic but also showcases your presentation skills.

Comparative Assessment Of Chatgpt And AI Enabled Search Engines Sample PDF
This slide provides information regarding the comparative assessment of ChatGPT in the context to AI-enabled search engines. Both models are compared on various features such as training data, pre-training type, fine-tuning, and API availability, etc. The best PPT templates are a great way to save time, energy, and resources. Slidegeeks have 100 percent editable powerpoint slides making them incredibly versatile. With these quality presentation templates, you can create a captivating and memorable presentation by combining visually appealing slides and effectively communicating your message. Download Comparative Assessment Of Chatgpt And AI Enabled Search Engines Sample PDF from Slidegeeks and deliver a wonderful presentation.

Kanban Structure For Task Management Ppt Summary Information PDF
This graph or chart is linked to excel, and changes automatically based on data. Just left click on it and select Edit Data. Showcasing this set of slides titled Kanban Structure For Task Management Ppt Summary Information PDF. The topics addressed in these templates are Backlog, In Progress, New Epic Added. All the content presented in this PPT design is completely editable. Download it and make adjustments in color, background, font etc. as per your unique business setting.
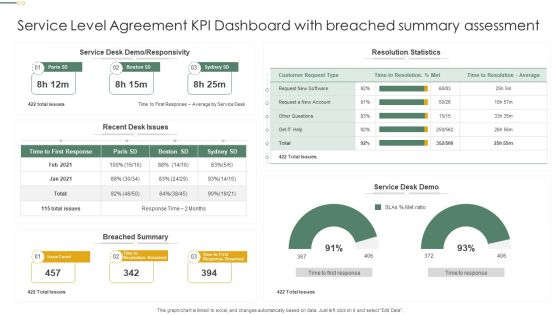
Service Level Agreement KPI Dashboard With Breached Summary Assessment Professional PDF
This graph or chart is linked to excel, and changes automatically based on data. Just left click on it and select Edit Data. Pitch your topic with ease and precision using this Service Level Agreement KPI Dashboard With Breached Summary Assessment Professional PDF. This layout presents information on Resolution Statistics, Service Desk Demo, Breached Summary. It is also available for immediate download and adjustment. So, changes can be made in the color, design, graphics or any other component to create a unique layout.

Post It Note 6 Stages Business Strategy Consultants Ppt Plan Builder PowerPoint Slides
We present our post it note 6 stages business strategy consultants ppt plan builder PowerPoint Slides.Download our Arrows PowerPoint Templates because It will mark the footprints of your journey. Illustrate how they will lead you to your desired destination. Use our Business PowerPoint Templates because Our PowerPoint Templates and Slides help you pinpoint your timelines. Highlight the reasons for your deadlines with their use. Download and present our Flow Charts PowerPoint Templates because You will get more than you ever bargained for. Download and present our Marketing PowerPoint Templates because Our PowerPoint Templates and Slides will fulfill your every need. Use them and effectively satisfy the desires of your audience. Download our Shapes PowerPoint Templates because Our PowerPoint Templates and Slides will let you Clearly mark the path for others to follow.Use these PowerPoint slides for presentations relating to Diagram, flyer, design, business, workflow, sequence, square, layout, presentation, circle, description, boxes, marketing, abstract, team, three, chart, strategy, shiny, segments, winner, run, text, sections, competition, banner, rush, progress, background, pattern. The prominent colors used in the PowerPoint template are Blue, Yellow, Green.

Business Network Design Powerpoint Slides Templates Download
This is a business network design powerpoint slides templates download. This is a ten stage process. The stages in this process are revenue from enrolled brand partners, it systems, data, it infrastructure, suppliers, monthly residual and hosting, direct sales, trading partners, web design services, customer.
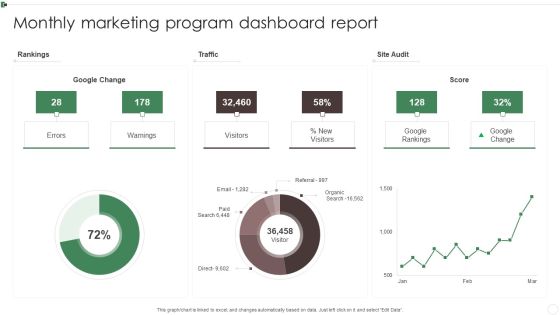
Monthly Marketing Program Dashboard Report Ppt Inspiration Information PDF
This graph or chart is linked to excel, and changes automatically based on data. Just left click on it and select Edit Data. Pitch your topic with ease and precision using this Monthly Marketing Program Dashboard Report Ppt Inspiration Information PDF. This layout presents information on Rankings, Traffic, Site Audit, Warnings. It is also available for immediate download and adjustment. So, changes can be made in the color, design, graphics or any other component to create a unique layout.

Financial Investment Process Diagram Ppt Design
This is a financial investment process diagram ppt design. This is a eight stage process. The stages in this process are identify investment goal, determine risk tolerance and time horizon, written investment policy statement, accounts established, investments allocated, quarterly investment reports, monitor portfolio and provide tax planning data, annual portfolio review and re optimize portfolio.
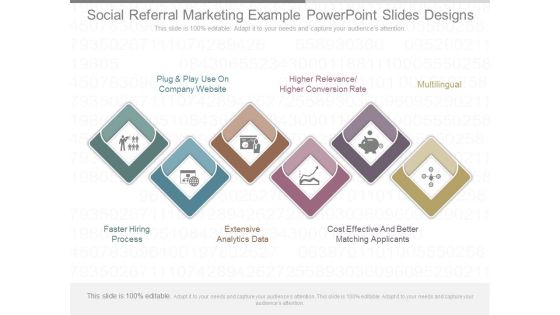
Social Referral Marketing Example Powerpoint Slides Designs
This is a social referral marketing example powerpoint slides designs. This is a six stage process. The stages in this process are plug and play use on company website, higher relevance higher conversion rate, multilingual, faster hiring process, extensive analytics data, cost effective and better matching applicants.

Analytical Research Report Ppt Background Designs
This is a analytical research report ppt background designs. This is a six stage process. The stages in this process are reflection and implementation, act to implement your plan, devise a plan, reflect and share, observe collect and analyze your data, identify the problem.

Kanban Structure For Product Quality Assurance Ppt Portfolio Deck PDF
This graph or chart is linked to excel, and changes automatically based on data. Just left click on it and select Edit Data. Pitch your topic with ease and precision using this Kanban Structure For Product Quality Assurance Ppt Portfolio Deck PDF. This layout presents information on Product Deployment, Quality Assurance, Product, Designing And Development. It is also available for immediate download and adjustment. So, changes can be made in the color, design, graphics or any other component to create a unique layout.
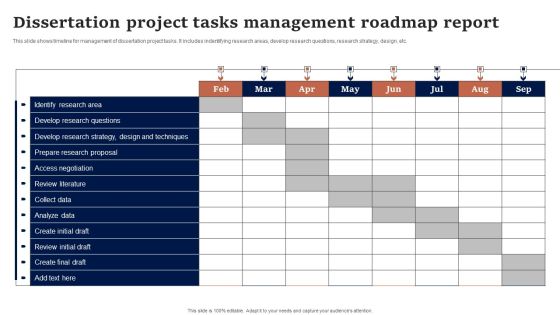
Dissertation Project Tasks Management Roadmap Report Mockup PDF
This slide shows timeline for management of dissertation project tasks. It includes indentifying research areas, develop research questions, research strategy, design, etc. Pitch your topic with ease and precision using this Dissertation Project Tasks Management Roadmap Report Mockup PDF. This layout presents information on Access Negotiation, Analyze Data, Collect Data. It is also available for immediate download and adjustment. So, changes can be made in the color, design, graphics or any other component to create a unique layout.

Supplier Quality Optimization Program Framework Portrait PDF
This slide provide information about supplier quality improvement framework to build trust and develop long-term relationships. It includes elements such as communication, data, proceed to next issue etc. Showcasing this set of slides titled Supplier Quality Optimization Program Framework Portrait PDF. The topics addressed in these templates are Testing Inward Goods, Analyze Data, Review Positive Test. All the content presented in this PPT design is completely editable. Download it and make adjustments in color, background, font etc. as per your unique business setting.

Seven Steps Of Financial Plan With Establishing Goals Ppt PowerPoint Presentation File Outline PDF
Persuade your audience using this seven steps of financial plan with establishing goals ppt powerpoint presentation file outline pdf. This PPT design covers seven stages, thus making it a great tool to use. It also caters to a variety of topics including monitoring plan, developing plan, analyzing the data, establishing goal, gathering data, plan implementation. Download this PPT design now to present a convincing pitch that not only emphasizes the topic but also showcases your presentation skills.

Weekly Sales Performance Highlights With Product Share Ppt File Information PDF
This graph or chart is linked to excel, and changes automatically based on data. Just left click on it and select Edit Data. Pitch your topic with ease and precision using this Weekly Sales Performance Highlights With Product Share Ppt File Information PDF. This layout presents information on Dashboard Summary, Weekly Sale, Product Share. It is also available for immediate download and adjustment. So, changes can be made in the color, design, graphics or any other component to create a unique layout.

Annual Training Schedule Bar Chart For Business Ppt PowerPoint Presentation File Infographics PDF
This graph chart is linked to excel, and changes automatically based on data. Just left click on it and select Edit Data. Showcasing this set of slides titled annual training schedule bar chart for business ppt powerpoint presentation file infographics pdf. The topics addressed in these templates are trainings, employees, competent officers. All the content presented in this PPT design is completely editable. Download it and make adjustments in color, background, font etc. as per your unique business setting.

Request For Proposal Process For Voice Over Internet Protocol System Selection Infographics PDF
This slide illustrates preparation of RFP response for selection of VoIP phone calls. It includes data, response creation, evaluation preparation, close, etc. Showcasing this set of slides titled Request For Proposal Process For Voice Over Internet Protocol System Selection Infographics PDF. The topics addressed in these templates are Data, Response Creation, Evaluation Preparation. All the content presented in this PPT design is completely editable. Download it and make adjustments in color, background, font etc. as per your unique business setting.

Characteristics Of Managers Scorecard Model Formats PDF
This slide mentions 4 major aspects on the basis of which executive balanced scorecard is formulated. Key considerations are financial data, customer perspective, business process and learning growth. Pitch your topic with ease and precision using this Characteristics Of Managers Scorecard Model Formats PDF. This layout presents information on Financial Data, Growth, Business Processes. It is also available for immediate download and adjustment. So, changes can be made in the color, design, graphics or any other component to create a unique layout.

Circles Infographic Design For Strategic Thinking Powerpoint Template
This PowerPoint template has been designed with circles infographic diagram. You may use this slide to display strategic thinking process. This diagram provides an effective way of displaying information you can edit text, color, shade and style as per you need.

Chart Showing Outline Of Online Drug Delivery Systems Market Ppt PowerPoint Presentation File Clipart PDF
This graph or chart is linked to excel, and changes automatically based on data. Just left click on it and select edit data. Showcasing this set of slides titled chart showing outline of online drug delivery systems market ppt powerpoint presentation file clipart pdf. The topics addressed in these templates are technological, development, growth. All the content presented in this PPT design is completely editable. Download it and make adjustments in color, background, font etc. as per your unique business setting.
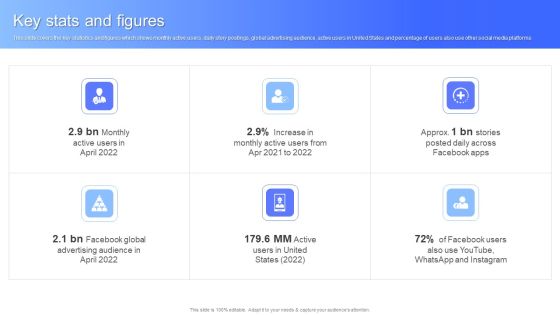
Key Stats And Figures Facebook Business Outline Sample PDF
This slide covers the key statistics and figures which shows monthly active users, daily story postings, global advertising audience, active users in United States and percentage of users also use other social media platforms. Presenting Key Stats And Figures Facebook Business Outline Sample PDF to provide visual cues and insights. Share and navigate important information on six stages that need your due attention. This template can be used to pitch topics like Key Stats And Figures. In addtion, this PPT design contains high resolution images, graphics, etc, that are easily editable and available for immediate download.

Why Is Agile Cost Effective IT Determining The Software Development Cost Agile Demonstration PDF
This graph or chart is linked to excel, and changes automatically based on data. Just left click on it and select Edit Data. Deliver and pitch your topic in the best possible manner with this Why Is Agile Cost Effective IT Determining The Software Development Cost Agile Demonstration PDF. Use them to share invaluable insights on Analysis And Design, Development, Project Management, Quality Assurance and impress your audience. This template can be altered and modified as per your expectations. So, grab it now.
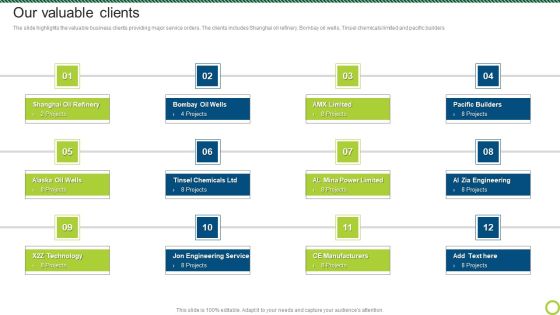
Engineering Solutions Company Detail Our Valuable Clients Background PDF
The slide highlights the valuable business clients providing major service orders. The clients includes Shanghai oil refinery, Bombay oil wells, Tinsel chemicals limited and pacific builders.This is a Engineering Solutions Company Detail Our Valuable Clients Background PDF template with various stages. Focus and dispense information on twelve stages using this creative set, that comes with editable features. It contains large content boxes to add your information on topics like Shanghai Oil Refinery, Pacific Builders, Engineering Service. You can also showcase facts, figures, and other relevant content using this PPT layout. Grab it now.

Bar Graph Showing Revenues Generated By Sales Department Ppt Portfolio Graphics Example PDF
This graph or chart is linked to excel, and changes automatically based on data. Just left click on it and select edit data. Showcasing this set of slides titled bar graph showing revenues generated by sales department ppt portfolio graphics example pdf. The topics addressed in these templates are yearly sales revenues, sales team, profits. All the content presented in this PPT design is completely editable. Download it and make adjustments in color, background, font etc. as per your unique business setting.

Online Advertising And Promotion Plan Management Dashboard Ppt PowerPoint Presentation Show Tips PDF
This graph chart is linked to excel, and changes automatically based on data. Just left click on it and select Edit Data. Showcasing this set of slides titled online advertising and promotion plan management dashboard ppt powerpoint presentation show tips pdf. The topics addressed in these templates are source techniques, social media channels, traffic targets. All the content presented in this PPT design is completely editable. Download it and make adjustments in color, background, font etc. as per your unique business setting.

Chart Showing Food Branding Platforms Ppt Summary Gridlines PDF
This graph or chart is linked to excel, and changes automatically based on data. Just left click on it and select Edit Data. Showcasing this set of slides titled chart showing food branding platforms ppt summary gridlines pdf. The topics addressed in these templates are chart showing food branding platforms. All the content presented in this PPT design is completely editable. Download it and make adjustments in color, background, font etc. as per your unique business setting.
Finance Metrics Dashboard Illustrating Gross And Operating Profit Margin Icons PDF
This graph or chart is linked to excel, and changes automatically based on data. Just left click on it and select edit data. Showcasing this set of slides titled Finance Metrics Dashboard Illustrating Gross And Operating Profit Margin Icons PDF. The topics addressed in these templates are Gross Profit Margin, Operating Profit Margin, Net Profit Margin. All the content presented in this PPT design is completely editable. Download it and make adjustments in color, background, font etc. as per your unique business setting.

Finance Metrics Dashboard Illustrating Monthly Gross Profit Formats PDF
This graph or chart is linked to excel, and changes automatically based on data. Just left click on it and select edit data. Showcasing this set of slides titled Finance Metrics Dashboard Illustrating Monthly Gross Profit Formats PDF. The topics addressed in these templates are Profit Metrics Gross, Profit Target Cum, Actual Cum Target. All the content presented in this PPT design is completely editable. Download it and make adjustments in color, background, font etc. as per your unique business setting.
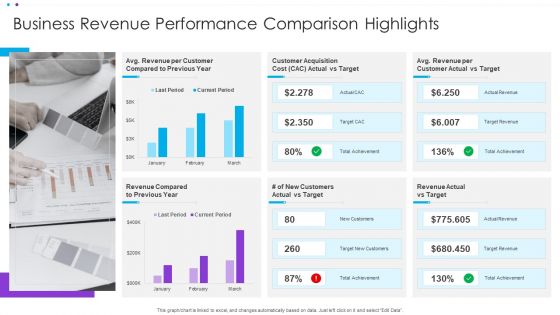
Business Revenue Performance Comparison Highlights Ppt Summary Rules PDF
This graph or chart is linked to excel, and changes automatically based on data. Just left click on it and select Edit Data. Showcasing this set of slides titled Business Revenue Performance Comparison Highlights Ppt Summary Rules PDF. The topics addressed in these templates are Customer Acquisition, Customer Actual, Revenue Compared. All the content presented in this PPT design is completely editable. Download it and make adjustments in color, background, font etc. as per your unique business setting.
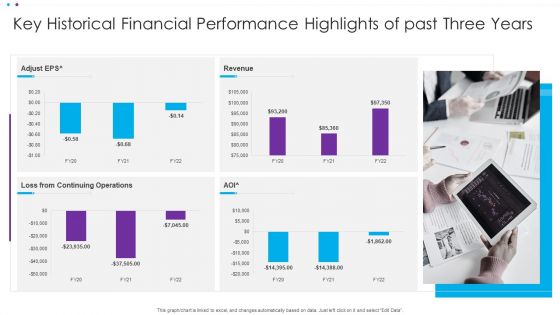
Key Historical Financial Performance Highlights Of Past Three Years Ppt Ideas Background PDF
This graph or chart is linked to excel, and changes automatically based on data. Just left click on it and select Edit Data. Showcasing this set of slides titled Key Historical Financial Performance Highlights Of Past Three Years Ppt Ideas Background PDF. The topics addressed in these templates are Continuing Operations, Adjust EP. All the content presented in this PPT design is completely editable. Download it and make adjustments in color, background, font etc. as per your unique business setting.
Social Media Marketing Performance Highlights With Key Campaign Results Ppt Icon PDF
This graph or chart is linked to excel, and changes automatically based on data. Just left click on it and select Edit Data. Showcasing this set of slides titled Social Media Marketing Performance Highlights With Key Campaign Results Ppt Icon PDF. The topics addressed in these templates are Profit Per, Overall Campaign, Total Budget. All the content presented in this PPT design is completely editable. Download it and make adjustments in color, background, font etc. as per your unique business setting.

Client Helpline Dashboard Average Time To Solve Issue Ppt Portfolio Visuals PDF
This graph or chart is linked to excel, and changes automatically based on data. Just left click on it and select Edit Data. Showcasing this set of slides titled Client Helpline Dashboard Average Time To Solve Issue Ppt Portfolio Visuals PDF. The topics addressed in these templates are Cost Per Support, Customer Satisfaction, Costs To Revenue. All the content presented in this PPT design is completely editable. Download it and make adjustments in color, background, font etc. as per your unique business setting.

Client Helpline Dashboard With Average Talk Time Distribution Ppt Gallery Backgrounds PDF
This graph or chart is linked to excel, and changes automatically based on data. Just left click on it and select Edit Data. Showcasing this set of slides titled Client Helpline Dashboard With Average Talk Time Distribution Ppt Gallery Backgrounds PDF. The topics addressed in these templates are External Incoming Call, Occupancy, Break Time, Sales. All the content presented in this PPT design is completely editable. Download it and make adjustments in color, background, font etc. as per your unique business setting.

Client Helpline Dashboard With Resolution And Response Rate Ppt File Example Topics PDF
This graph or chart is linked to excel, and changes automatically based on data. Just left click on it and select Edit Data. Showcasing this set of slides titled Client Helpline Dashboard With Resolution And Response Rate Ppt File Example Topics PDF. The topics addressed in these templates are Resolutions, Response Time, Response Time Weekday. All the content presented in this PPT design is completely editable. Download it and make adjustments in color, background, font etc. as per your unique business setting.

Client Helpline Dashboard With Support Status Ppt Portfolio Rules PDF
This graph or chart is linked to excel, and changes automatically based on data. Just left click on it and select Edit Data. Showcasing this set of slides titled Client Helpline Dashboard With Support Status Ppt Portfolio Rules PDF. The topics addressed in these templates are Total Number, Support Requests, Total Resolved, Support Status. All the content presented in this PPT design is completely editable. Download it and make adjustments in color, background, font etc. as per your unique business setting.
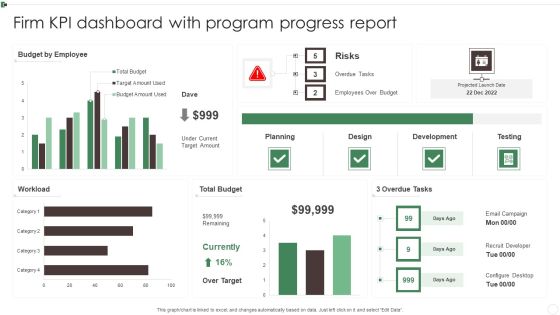
Firm KPI Dashboard With Program Progress Report Ppt Pictures Deck PDF
This graph or chart is linked to excel, and changes automatically based on data. Just left click on it and select Edit Data. Showcasing this set of slides titled Firm KPI Dashboard With Program Progress Report Ppt Pictures Deck PDF. The topics addressed in these templates are Budget By Employee, Total Budget, 3 Overdue Tasks, Workload. All the content presented in this PPT design is completely editable. Download it and make adjustments in color, background, font etc. as per your unique business setting.
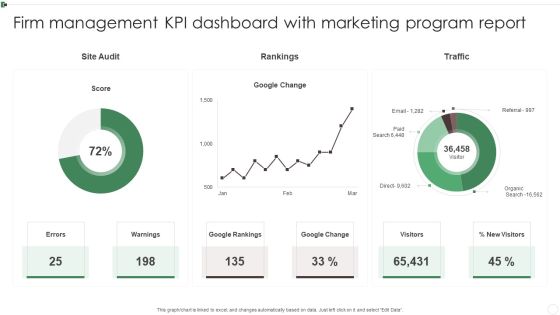
Firm Management KPI Dashboard With Marketing Program Report Ppt Styles Introduction PDF
This graph or chart is linked to excel, and changes automatically based on data. Just left click on it and select Edit Data. Showcasing this set of slides titled Firm Management KPI Dashboard With Marketing Program Report Ppt Styles Introduction PDF. The topics addressed in these templates are Google Rankings, Google Change, Warnings, Visitors. All the content presented in this PPT design is completely editable. Download it and make adjustments in color, background, font etc. as per your unique business setting.
 Home
Home