Data Analysis Icon
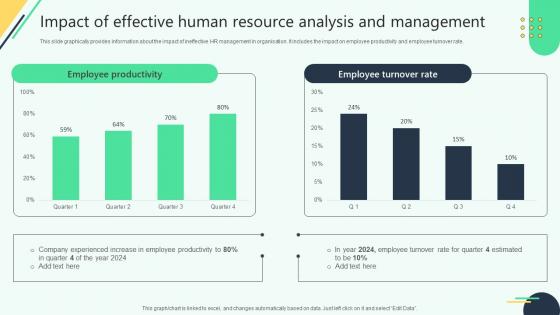
Impact Of Effective Human Resource Analysis And Analysing Hr Data For Effective Decision Making
This slide graphically provides information about the impact of ineffective HR management in organisation. It includes the impact on employee productivity and employee turnover rate. Slidegeeks has constructed Impact Of Effective Human Resource Analysis And Analysing Hr Data For Effective Decision Making after conducting extensive research and examination. These presentation templates are constantly being generated and modified based on user preferences and critiques from editors. Here, you will find the most attractive templates for a range of purposes while taking into account ratings and remarks from users regarding the content. This is an excellent jumping-off point to explore our content and will give new users an insight into our top-notch PowerPoint Templates.

Overview Of BI For Enhanced Decision Making Business Intelligence Statistical Data Analysis Guidelines PDF
This slide covers the key insights related to statistical analysis of business intelligence market. It includes details related to best BI vendors in the worlds, top IAAS platforms preferred by BI vendors etc. There are so many reasons you need a Overview Of BI For Enhanced Decision Making Business Intelligence Statistical Data Analysis Guidelines PDF. The first reason is you cannot spend time making everything from scratch, Thus, Slidegeeks has made presentation templates for you too. You can easily download these templates from our website easily.

Essential Business Requirements For Data Analytics Business Analysis Modification Toolkit Topics PDF
In this slide, we are showing the basic key components including people, process and technology that are required for data analytics strategy management process.This is a Essential Business Requirements For Data Analytics Business Analysis Modification Toolkit Topics PDF template with various stages. Focus and dispense information on three stages using this creative set, that comes with editable features. It contains large content boxes to add your information on topics like Technologies, Processes, Technologies. You can also showcase facts, figures, and other relevant content using this PPT layout. Grab it now.

Business Diagram Big Data Analysis Using Map Reduce Batch Processing Ppt Slide
This PowerPoint template has been designed with graphic of server and data transfer network. This slide contains the steps of big data, map, reduce and result. Use this editable diagram for data technology related presentations.
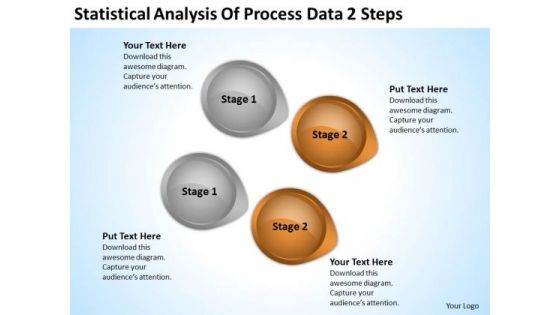
Arrow In PowerPoint Statistical Analysis Of Process Data 2 Steps Ppt Slide
We present our arrow in powerpoint statistical analysis of process data 2 steps ppt Slide.Download our Business PowerPoint Templates because Our PowerPoint Templates and Slides will weave a web of your great ideas. They are gauranteed to attract even the most critical of your colleagues. Use our Circle Charts PowerPoint Templates because Our PowerPoint Templates and Slides will let your words and thoughts hit bullseye everytime. Download our Arrows PowerPoint Templates because Our PowerPoint Templates and Slides will let you Hit the right notes. Watch your audience start singing to your tune. Download and present our Shapes PowerPoint Templates because You have the co-ordinates for your destination of success. Let our PowerPoint Templates and Slides map out your journey. Download and present our Signs PowerPoint Templates because It will let you Set new benchmarks with our PowerPoint Templates and Slides. They will keep your prospects well above par.Use these PowerPoint slides for presentations relating to 3d, abstract, analysis, arrow, background, business, button, chart, circle, circular, color, concept, conservation, cycle, development, diagram, direction, eco, ecology, energy, environment, flow, flowchart, globe, graphic, growing, growth, icon, internet, isolated, object, power, process, protection, recyclable, recycle, recycling, render, resource, saving, sign, solution, sphere, statistic, sustainable, symbol, technology, white. The prominent colors used in the PowerPoint template are Brown, Gray, Black. You can be sure our arrow in powerpoint statistical analysis of process data 2 steps ppt Slide are designed by professionals People tell us our button PowerPoint templates and PPT Slides will make the presenter look like a pro even if they are not computer savvy. You can be sure our arrow in powerpoint statistical analysis of process data 2 steps ppt Slide are designed by professionals Use our arrow PowerPoint templates and PPT Slides have awesome images to get your point across. Presenters tell us our arrow in powerpoint statistical analysis of process data 2 steps ppt Slide will make the presenter successul in his career/life. We assure you our arrow PowerPoint templates and PPT Slides are visually appealing.
IT Security Analysis Icon With Magnifying Glass Introduction PDF
Presenting IT Security Analysis Icon With Magnifying Glass Introduction PDF to dispense important information. This template comprises three stages. It also presents valuable insights into the topics including IT Security Analysis Icon, Magnifying Glass. This is a completely customizable PowerPoint theme that can be put to use immediately. So, download it and address the topic impactfully.

Introducing CRM Framework Within Organization CRM Data Analysis Period Ppt Ideas Themes PDF
Presenting this set of slides with name introducing crm framework within organization crm data analysis period ppt ideas themes pdf. The topics discussed in these slides are entities by rep, completed activities, biz notes month, phone calls last 3 months, activity last 3 months, sales last 3 months, profit last 3 months. This is a completely editable PowerPoint presentation and is available for immediate download. Download now and impress your audience.
Marketers Guide To Data Analysis Optimization KPI Dashboard For Tracking Paid Ad Campaign Performance Clipart PDF
This slide covers the dashboard for analyzing paid search metrics such as ad cost, clicks, impressions, click-through rate, cost per conversion, conversion rate, cost per click, etc. Here you can discover an assortment of the finest PowerPoint and Google Slides templates. With these templates, you can create presentations for a variety of purposes while simultaneously providing your audience with an eye catching visual experience. Download Marketers Guide To Data Analysis Optimization KPI Dashboard For Tracking Paid Ad Campaign Performance Clipart PDF to deliver an impeccable presentation. These templates will make your job of preparing presentations much quicker, yet still, maintain a high level of quality. Slidegeeks has experienced researchers who prepare these templates and write high quality content for you. Later on, you can personalize the content by editing the Marketers Guide To Data Analysis Optimization KPI Dashboard For Tracking Paid Ad Campaign Performance Clipart PDF.
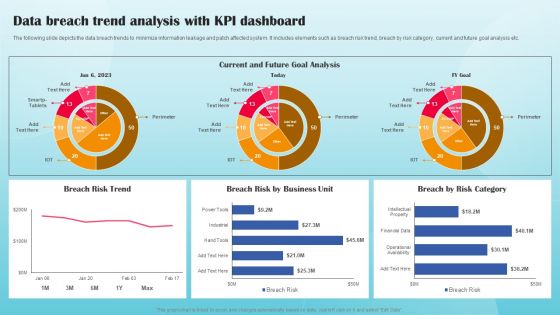
Data Breach Trend Analysis With KPI Dashboard Ppt PowerPoint Presentation File Portfolio PDF
The following slide depicts the data breach trends to minimize information leakage and patch affected system. It includes elements such as breach risk trend, breach by risk category, current and future goal analysis etc. This modern and well arranged Data Breach Trend Analysis With KPI Dashboard Ppt PowerPoint Presentation File Portfolio PDF provides lots of creative possibilities. It is very simple to customize and edit with the Powerpoint Software. Just drag and drop your pictures into the shapes. All facets of this template can be edited with Powerpoint no extra software is necessary. Add your own material, put your images in the places assigned for them, adjust the colors, and then you can show your slides to the world, with an animated slide included.
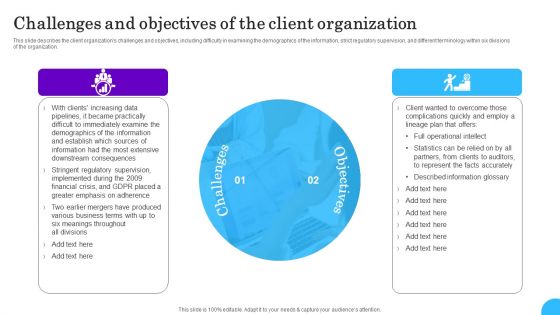
Comprehensive Analysis Of Different Data Lineage Classification Challenges And Objectives Client Themes PDF
This slide describes the client organizations challenges and objectives, including difficulty in examining the demographics of the information, strict regulatory supervision, and different terminology within six divisions of the organization. Get a simple yet stunning designed Comprehensive Analysis Of Different Data Lineage Classification Challenges And Objectives Client Themes PDF. It is the best one to establish the tone in your meetings. It is an excellent way to make your presentations highly effective. So, download this PPT today from Slidegeeks and see the positive impacts. Our easy to edit Comprehensive Analysis Of Different Data Lineage Classification Challenges And Objectives Client Themes PDF can be your go to option for all upcoming conferences and meetings. So, what are you waiting for Grab this template today.

6 Months Strategy Roadmap For Data Analysis Integration To Business Diagrams
Introducing our 6 months strategy roadmap for data analysis integration to business diagrams. This PPT presentation is Google Slides compatible, therefore, you can share it easily with the collaborators for measuring the progress. Also, the presentation is available in both standard screen and widescreen aspect ratios. So edit the template design by modifying the font size, font type, color, and shapes as per your requirements. As this PPT design is fully editable it can be presented in PDF, JPG and PNG formats.
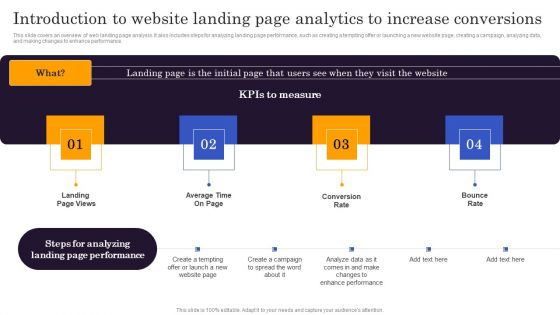
Marketers Guide To Data Analysis Optimization Introduction To Website Landing Page Analytics To Increase Portrait PDF
This slide covers an overview of web landing page analysis. It also includes steps for analyzing landing page performance, such as creating a tempting offer or launching a new website page, creating a campaign, analyzing data, and making changes to enhance performance. Retrieve professionally designed Marketers Guide To Data Analysis Optimization Introduction To Website Landing Page Analytics To Increase Portrait PDF to effectively convey your message and captivate your listeners. Save time by selecting pre made slideshows that are appropriate for various topics, from business to educational purposes. These themes come in many different styles, from creative to corporate, and all of them are easily adjustable and can be edited quickly. Access them as PowerPoint templates or as Google Slides themes. You do not have to go on a hunt for the perfect presentation because Slidegeeks got you covered from everywhere.

Half Yearly Development And Strategy Roadmap For Big Data Analysis Ideas
Presenting our innovatively-structured half yearly development and strategy roadmap for big data analysis ideas Template. Showcase your roadmap process in different formats like PDF, PNG, and JPG by clicking the download button below. This PPT design is available in both Standard Screen and Widescreen aspect ratios. It can also be easily personalized and presented with modified font size, font type, color, and shapes to measure your progress in a clear way.
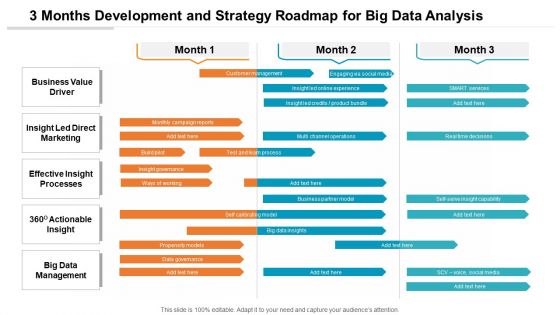
3 Months Development And Strategy Roadmap For Big Data Analysis Background
Presenting our innovatively-structured 3 months development and strategy roadmap for big data analysis background Template. Showcase your roadmap process in different formats like PDF, PNG, and JPG by clicking the download button below. This PPT design is available in both Standard Screen and Widescreen aspect ratios. It can also be easily personalized and presented with modified font size, font type, color, and shapes to measure your progress in a clear way.

5 Year Development And Strategy Roadmap For Big Data Analysis Elements
Presenting our innovatively-structured 5 year development and strategy roadmap for big data analysis elements Template. Showcase your roadmap process in different formats like PDF, PNG, and JPG by clicking the download button below. This PPT design is available in both Standard Screen and Widescreen aspect ratios. It can also be easily personalized and presented with modified font size, font type, color, and shapes to measure your progress in a clear way.

6 Months Development And Strategy Roadmap For Big Data Analysis Graphics
Presenting our innovatively-structured 6 months development and strategy roadmap for big data analysis graphics Template. Showcase your roadmap process in different formats like PDF, PNG, and JPG by clicking the download button below. This PPT design is available in both Standard Screen and Widescreen aspect ratios. It can also be easily personalized and presented with modified font size, font type, color, and shapes to measure your progress in a clear way.
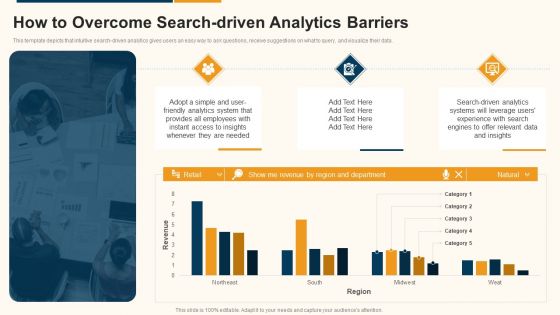
Data Interpretation And Analysis Playbook How To Overcome Search Driven Analytics Barriers Summary PDF
This template depicts that intuitive search-driven analytics gives users an easy way to ask questions, receive suggestions on what to query, and visualize their data. Deliver and pitch your topic in the best possible manner with this data interpretation and analysis playbook how to overcome search driven analytics barriers summary pdf. Use them to share invaluable insights on how to overcome search driven analytics barriers and impress your audience. This template can be altered and modified as per your expectations. So, grab it now.
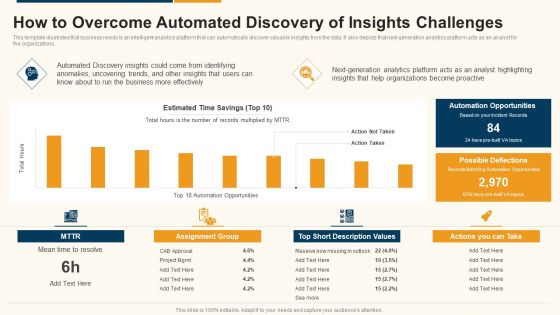
Data Interpretation And Analysis Playbook How To Overcome Automated Discovery Of Insights Challenges Rules PDF
This template illustrates that business needs is an intelligent analytics platform that can automatically discover valuable insights from the data. It also depicts that next-generation analytics platform acts as an analyst for the organizations. Deliver an awe inspiring pitch with this creative data interpretation and analysis playbook how to overcome automated discovery of insights challenges rules pdf bundle. Topics like opportunities, organizations, analytics, business can be discussed with this completely editable template. It is available for immediate download depending on the needs and requirements of the user.
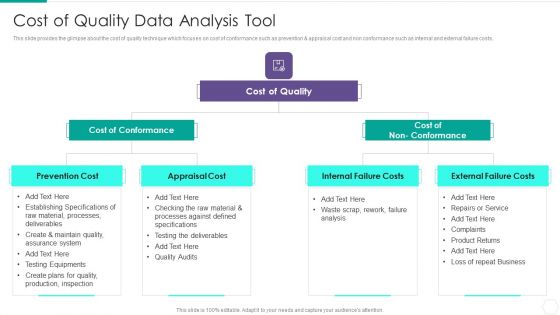
Quantitative Risk Assessment Cost Of Quality Data Analysis Tool Graphics PDF
Presenting Quantitative Risk Assessment Cost Of Quality Data Analysis Tool Graphics PDF to provide visual cues and insights. Share and navigate important information on three stages that need your due attention. This template can be used to pitch topics like Cost Of Conformance, Cost Of Quality, Internal Failure Costs, External Failure Costs, Appraisal Cost. In addtion, this PPT design contains high resolution images, graphics, etc, that are easily editable and available for immediate download.
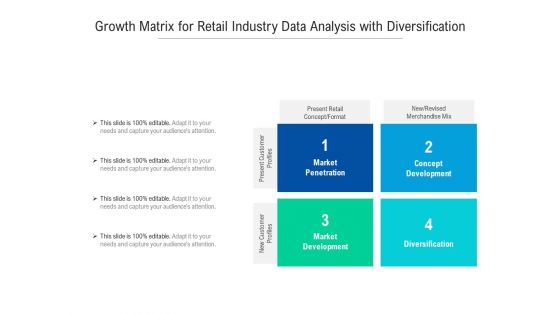
Growth Matrix For Retail Industry Data Analysis With Diversification Ppt Powerpoint Presentation Pictures Microsoft Pdf
Presenting growth matrix for retail industry data analysis with diversification ppt powerpoint presentation pictures microsoft pdf to dispense important information. This template comprises four stages. It also presents valuable insights into the topics including market penetration, concept development, diversification, market development, present retail concept format, present customer profiles, new customer profiles. This is a completely customizable PowerPoint theme that can be put to use immediately. So, download it and address the topic impactfully.
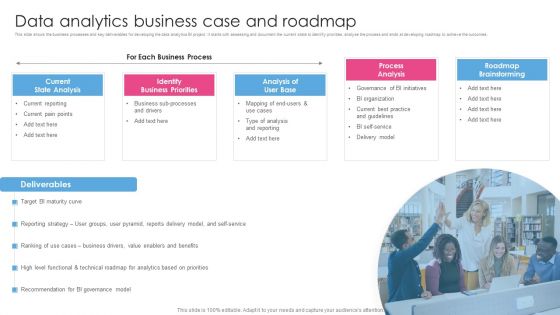
Data Analytics Business Case And Roadmap Business Analysis Modification Toolkit Diagrams PDF
Presenting Data Analytics Business Case And Roadmap Business Analysis Modification Toolkit Diagrams PDF to provide visual cues and insights. Share and navigate important information on one stage that need your due attention. This template can be used to pitch topics like Identify Business, Governance Initiatives, Governance Model. In addtion, this PPT design contains high resolution images, graphics, etc, that are easily editable and available for immediate download.
Marketers Guide To Data Analysis Optimization Tracking Social Media Engagement Rate For Improving Conversions Brochure PDF
This slide covers an overview of the social media engagement rate to identify if the content is reaching the target audience. It also includes improvement strategies such as having a consistent, authentic voice, knowing your algorithms, and creating shareable content. Do you have to make sure that everyone on your team knows about any specific topic I yes, then you should give Marketers Guide To Data Analysis Optimization Tracking Social Media Engagement Rate For Improving Conversions Brochure PDF a try. Our experts have put a lot of knowledge and effort into creating this impeccable Marketers Guide To Data Analysis Optimization Tracking Social Media Engagement Rate For Improving Conversions Brochure PDF. You can use this template for your upcoming presentations, as the slides are perfect to represent even the tiniest detail. You can download these templates from the Slidegeeks website and these are easy to edit. So grab these today.

Data Analytics Software Vendor Profile Business Analysis Modification Toolkit Diagrams PDF
This slide shows the vendor profile matrix. It contains multiple features that can be scored and weighted to evaluate the vendors capability to deliver the software.Deliver an awe inspiring pitch with this creative Data Analytics Software Vendor Profile Business Analysis Modification Toolkit Diagrams PDF bundle. Topics like Independent Industry, Implementation Support, Infrastructure Support can be discussed with this completely editable template. It is available for immediate download depending on the needs and requirements of the user.
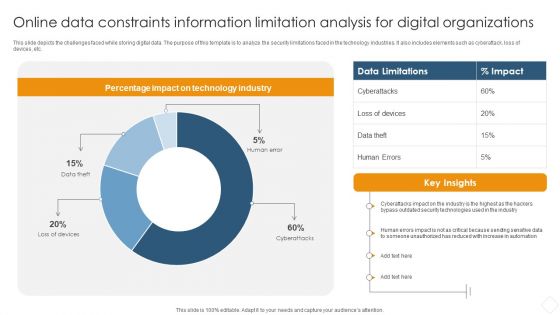
Online Data Constraints Information Limitation Analysis For Digital Organizations Information PDF
This slide depicts the challenges faced while storing digital data. The purpose of this template is to analyze the security limitations faced in the technology industries. It also includes elements such as cyberattack, loss of devices, etc.Pitch your topic with ease and precision using this Online Data Constraints Information Limitation Analysis For Digital Organizations Information PDF. This layout presents information on Percentage Impact, Technology Industry, Security Technologies. It is also available for immediate download and adjustment. So, changes can be made in the color, design, graphics or any other component to create a unique layout.

Marketers Guide To Data Analysis Optimization Introduction To Social Media Analytics To Increase Customer Topics PDF
This slide covers an overview of social media analytics to increase new customers. It also includes the benefits of social media analytics, such as boosting social media campaign performance, improving crisis management, maximizing product launches, lower customer care costs, etc. Are you searching for a Marketers Guide To Data Analysis Optimization Introduction To Social Media Analytics To Increase Customer Topics PDF that is uncluttered, straightforward, and original Its easy to edit, and you can change the colors to suit your personal or business branding. For a presentation that expresses how much effort you have put in, this template is ideal. With all of its features, including tables, diagrams, statistics, and lists, its perfect for a business plan presentation. Make your ideas more appealing with these professional slides. Download Marketers Guide To Data Analysis Optimization Introduction To Social Media Analytics To Increase Customer Topics PDF from Slidegeeks today.

Strategic Market Insight Implementation Guide Data Evaluation Sample With Conjoint Analysis Background PDF
The following slide showcases sample of data assessment with conjoint analysis method to compare features and identify value. It outlines key components such as attribute, level, all responses and comments. Slidegeeks is here to make your presentations a breeze with Strategic Market Insight Implementation Guide Data Evaluation Sample With Conjoint Analysis Background PDF With our easy to use and customizable templates, you can focus on delivering your ideas rather than worrying about formatting. With a variety of designs to choose from, you are sure to find one that suits your needs. And with animations and unique photos, illustrations, and fonts, you can make your presentation pop. So whether you are giving a sales pitch or presenting to the board, make sure to check out Slidegeeks first.

Transformation Toolkit Competitive Intelligence Information Analysis Steps To Accomplish Data Analytics Project Slides PDF
The slide illustrates the key fundamental steps of a data analytics project that helps to realize business value from data insights. It starts from raw data preparation to building a machine learning model. Do you know about Slidesgeeks Transformation Toolkit Competitive Intelligence Information Analysis Steps To Accomplish Data Analytics Project Slides PDF These are perfect for delivering any kind od presentation. Using it, create PowerPoint presentations that communicate your ideas and engage audiences. Save time and effort by using our pre designed presentation templates that are perfect for a wide range of topic. Our vast selection of designs covers a range of styles, from creative to business, and are all highly customizable and easy to edit. Download as a PowerPoint template or use them as Google Slides themes.
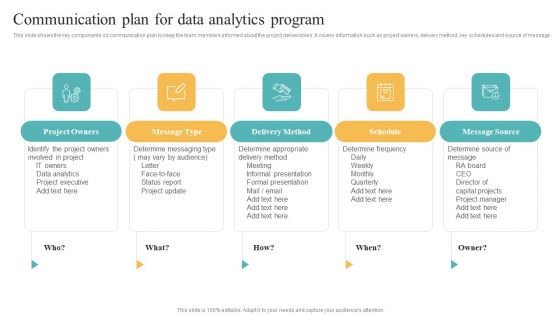
Transformation Toolkit Competitive Intelligence Information Analysis Communication Plan For Data Information PDF
This slide shows the key components od communication plan to keep the team members informed about the project deliverables. It covers information such as project owners, delivery method, key schedules and source of message. Whether you have daily or monthly meetings, a brilliant presentation is necessary. Transformation Toolkit Competitive Intelligence Information Analysis Communication Plan For Data Information PDF can be your best option for delivering a presentation. Represent everything in detail using Transformation Toolkit Competitive Intelligence Information Analysis Communication Plan For Data Information PDF and make yourself stand out in meetings. The template is versatile and follows a structure that will cater to your requirements. All the templates prepared by Slidegeeks are easy to download and edit. Our research experts have taken care of the corporate themes as well. So, give it a try and see the results.
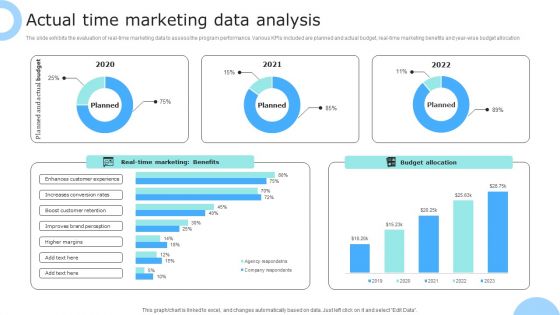
Actual Time Marketing Data Analysis Ppt PowerPoint Presentation Gallery Pictures PDF
The slide exhibits the evaluation of real-time marketing data to assess the program performance. Various KPIs included are planned and actual budget, real-time marketing benefits and year-wise budget allocation. Showcasing this set of slides titled Actual Time Marketing Data Analysis Ppt PowerPoint Presentation Gallery Pictures PDF. The topics addressed in these templates are Planned, Actual Budget, Budget Allocation, Real Time Marketing, Benefits. All the content presented in this PPT design is completely editable. Download it and make adjustments in color, background, font etc. as per your unique business setting.
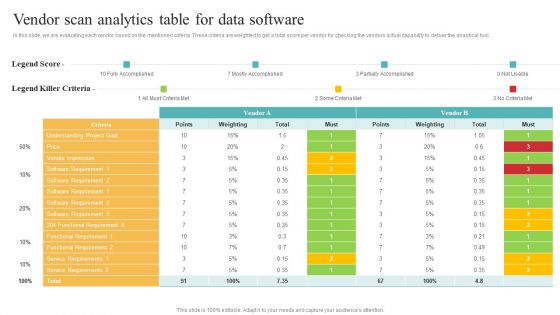
Transformation Toolkit Competitive Intelligence Information Analysis Vendor Scan Analytics Table For Data Software Template PDF
In this slide, we are evaluating each vendor based on the mentioned criteria. These criteria are weighted to get a total score per vendor for checking the vendors actual capability to deliver the analytical tool. Whether you have daily or monthly meetings, a brilliant presentation is necessary. Transformation Toolkit Competitive Intelligence Information Analysis Vendor Scan Analytics Table For Data Software Template PDF can be your best option for delivering a presentation. Represent everything in detail using Transformation Toolkit Competitive Intelligence Information Analysis Vendor Scan Analytics Table For Data Software Template PDF and make yourself stand out in meetings. The template is versatile and follows a structure that will cater to your requirements. All the templates prepared by Slidegeeks are easy to download and edit. Our research experts have taken care of the corporate themes as well. So, give it a try and see the results.
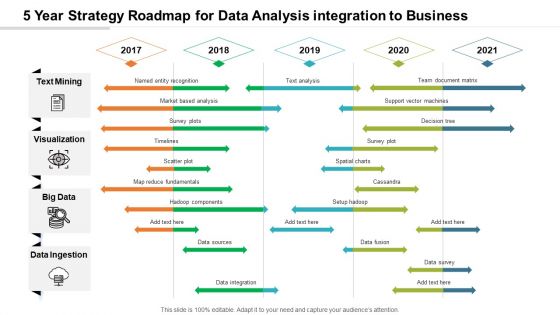
5 Year Strategy Roadmap For Data Analysis Integration To Business Pictures
Introducing our 5 year strategy roadmap for data analysis integration to business pictures. This PPT presentation is Google Slides compatible, therefore, you can share it easily with the collaborators for measuring the progress. Also, the presentation is available in both standard screen and widescreen aspect ratios. So edit the template design by modifying the font size, font type, color, and shapes as per your requirements. As this PPT design is fully editable it can be presented in PDF, JPG and PNG formats.

Five Year Organization Data Analysis Process Enhancement Best Practices Roadmap Rules
Presenting our innovatively structured five year organization data analysis process enhancement best practices roadmap rules Template. Showcase your roadmap process in different formats like PDF, PNG, and JPG by clicking the download button below. This PPT design is available in both Standard Screen and Widescreen aspect ratios. It can also be easily personalized and presented with modified font size, font type, color, and shapes to measure your progress in a clear way.

Six Months Organization Data Analysis Process Enhancement Best Practices Roadmap Inspiration
Presenting our innovatively structured six months organization data analysis process enhancement best practices roadmap inspiration Template. Showcase your roadmap process in different formats like PDF, PNG, and JPG by clicking the download button below. This PPT design is available in both Standard Screen and Widescreen aspect ratios. It can also be easily personalized and presented with modified font size, font type, color, and shapes to measure your progress in a clear way.

Three Months Organization Data Analysis Process Enhancement Best Practices Roadmap Portrait
Presenting our innovatively structured three months organization data analysis process enhancement best practices roadmap portrait Template. Showcase your roadmap process in different formats like PDF, PNG, and JPG by clicking the download button below. This PPT design is available in both Standard Screen and Widescreen aspect ratios. It can also be easily personalized and presented with modified font size, font type, color, and shapes to measure your progress in a clear way.
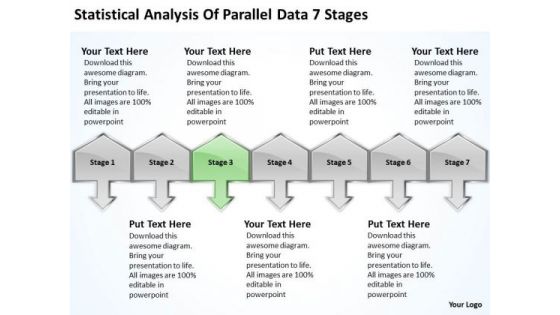
Analysis Of Parallel Data 7 Stages Ppt Franchise Business Plan Sample PowerPoint Slides
We present our analysis of parallel data 7 stages ppt franchise business plan sample PowerPoint Slides.Download our Arrows PowerPoint Templates because You have gained great respect for your brilliant ideas. Use our PowerPoint Templates and Slides to strengthen and enhance your reputation. Download and present our Shapes PowerPoint Templates because you can see clearly through to the bigger bowl ahead. Time your jump to perfection and hit the nail on the head. Download our Metaphors-Visual Concepts PowerPoint Templates because you know that the core of any organisation is the people who work for it. Use our Signs PowerPoint Templates because support groups are an essential element of the on going struggle against cancer. Download our Business PowerPoint Templates because this diagram can set an example to enthuse your team with the passion and fervour of your ideas.Use these PowerPoint slides for presentations relating to achieve, achievement, action, business, chinese, company, concept, conceptual, corporate, definition, idea, macro, market, nature, organization, paintbrush, plan, profit, research, results, sand, shape, single, success, successful, symbol, text, translation, treasure, vision, word. The prominent colors used in the PowerPoint template are Green, Gray, Black. People tell us our analysis of parallel data 7 stages ppt franchise business plan sample PowerPoint Slides are Quaint. Use our action PowerPoint templates and PPT Slides are Nifty. Use our analysis of parallel data 7 stages ppt franchise business plan sample PowerPoint Slides are Ultra. PowerPoint presentation experts tell us our corporate PowerPoint templates and PPT Slides are Magical. People tell us our analysis of parallel data 7 stages ppt franchise business plan sample PowerPoint Slides are Spiffy. Customers tell us our corporate PowerPoint templates and PPT Slides are Dynamic.
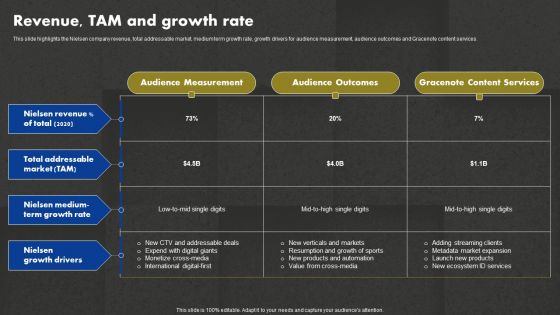
Data And Customer Analysis Company Outline Revenue TAM And Growth Rate Infographics PDF

Marketers Guide To Data Analysis Optimization Top Marketing Analytics Challenges Faced By Companies Formats PDF
This slide covers significant issues faced by organizations while using marketing analytics. It includes problems such as collecting the correct data, determining how to use data, identifying the correct KPIs, converting leads to revenue, and identifying market trends. Boost your pitch with our creative Marketers Guide To Data Analysis Optimization Top Marketing Analytics Challenges Faced By Companies Formats PDF. Deliver an awe-inspiring pitch that will mesmerize everyone. Using these presentation templates you will surely catch everyones attention. You can browse the ppts collection on our website. We have researchers who are experts at creating the right content for the templates. So you do not have to invest time in any additional work. Just grab the template now and use them.
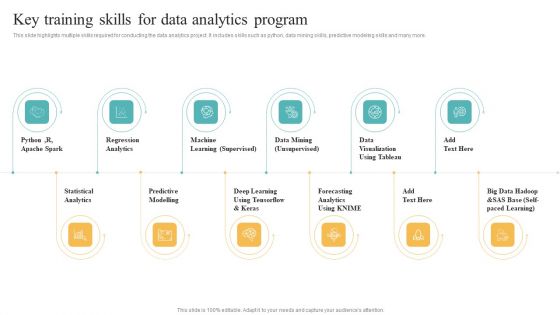
Transformation Toolkit Competitive Intelligence Information Analysis Key Training Skills For Data Analytics Program Structure PDF
This slide highlights multiple skills required for conducting the data analytics project. It includes skills such as python, data mining skills, predictive modeling skills and many more. Retrieve professionally designed Transformation Toolkit Competitive Intelligence Information Analysis Key Training Skills For Data Analytics Program Structure PDF to effectively convey your message and captivate your listeners. Save time by selecting pre made slideshows that are appropriate for various topics, from business to educational purposes. These themes come in many different styles, from creative to corporate, and all of them are easily adjustable and can be edited quickly. Access them as PowerPoint templates or as Google Slides themes. You do not have to go on a hunt for the perfect presentation because Slidegeeks got you covered from everywhere.

Information Technology Security Data Analysis With Reported Incident KPI Download PDF
This slide displays the chart which includes the year wise distribution of information breaches incidents involving personal information and other security information with a five year annual average. Showcasing this set of slides titled Information Technology Security Data Analysis With Reported Incident KPI Download PDF. The topics addressed in these templates are Incidents Involving, Personal Information, Other Information, Security Incidents. All the content presented in this PPT design is completely editable. Download it and make adjustments in color, background, font etc. as per your unique business setting.
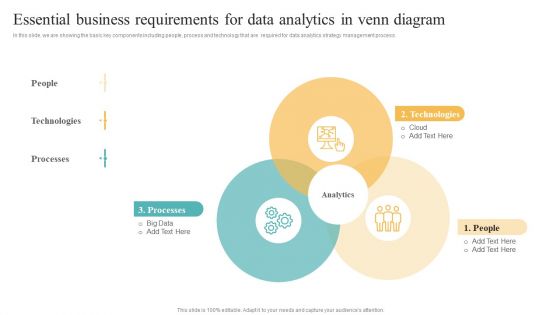
Transformation Toolkit Competitive Intelligence Information Analysis Essential Business Requirements For Data Analytics Summary PDF
In this slide, we are showing the basic key components including people, process and technology that are required for data analytics strategy management process. Present like a pro with Transformation Toolkit Competitive Intelligence Information Analysis Essential Business Requirements For Data Analytics Summary PDF Create beautiful presentations together with your team, using our easy to use presentation slides. Share your ideas in real time and make changes on the fly by downloading our templates. So whether you are in the office, on the go, or in a remote location, you can stay in sync with your team and present your ideas with confidence. With Slidegeeks presentation got a whole lot easier. Grab these presentations today.
Macro Environmental Level Threat Detection And Analysis Icon Demonstration PDF
Presenting Macro Environmental Level Threat Detection And Analysis Icon Demonstration PDF to dispense important information. This template comprises three stages. It also presents valuable insights into the topics including Macro Environmental, Level Threat, Detection And Analysis. This is a completely customizable PowerPoint theme that can be put to use immediately. So, download it and address the topic impactfully.
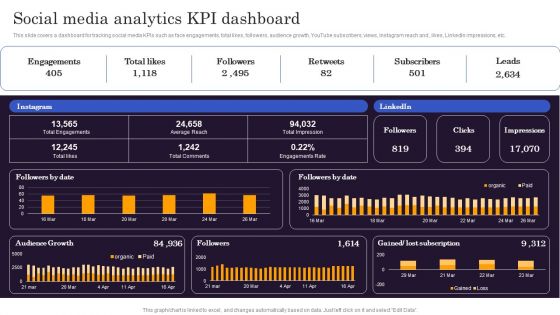
Marketers Guide To Data Analysis Optimization Social Media Analytics KPI Dashboard Clipart PDF
This slide covers a dashboard for tracking social media KPIs such as face engagements, total likes, followers, audience growth, YouTube subscribers, views, Instagram reach and , likes, LinkedIn impressions, etc. Find a pre designed and impeccable Marketers Guide To Data Analysis Optimization Social Media Analytics KPI Dashboard Clipart PDF. The templates can ace your presentation without additional effort. You can download these easy to edit presentation templates to make your presentation stand out from others. So, what are you waiting for Download the template from Slidegeeks today and give a unique touch to your presentation.

Data Interpretation And Analysis Playbook How To Bridge Business Intelligence And Predictive Analytics Challenges Designs PDF
This template depicts that with interactive BI visualization and predictive modeling in the same enterprise analytics platform, organizations can easily collaborate on initiatives that make recommended actions accessible to the business. Deliver an awe inspiring pitch with this creative data interpretation and analysis playbook how to bridge business intelligence and predictive analytics challenges designs pdf bundle. Topics like how to bridge business intelligence and predictive analytics challenges can be discussed with this completely editable template. It is available for immediate download depending on the needs and requirements of the user.
Statistical Analysis Procedure To Identify Problem Icon Guidelines PDF
Persuade your audience using this Statistical Analysis Procedure To Identify Problem Icon Guidelines PDF. This PPT design covers three stages, thus making it a great tool to use. It also caters to a variety of topics including Statistical Analysis Procedure, Identify Problem Icon. Download this PPT design now to present a convincing pitch that not only emphasizes the topic but also showcases your presentation skills.
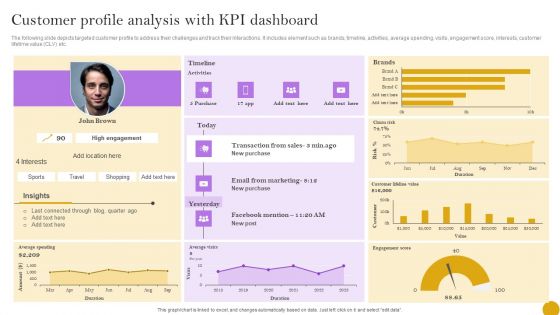
Comprehensive Customer Data Platform Guide Optimizing Promotional Initiatives Customer Profile Analysis KPI Dashboard Pictures PDF
The following slide depicts targeted customer profile to address their challenges and track their interactions. It includes element such as brands, timeline, activities, average spending, visits, engagement score, interests, customer lifetime value CLV etc. The best PPT templates are a great way to save time, energy, and resources. Slidegeeks have 100 percent editable powerpoint slides making them incredibly versatile. With these quality presentation templates, you can create a captivating and memorable presentation by combining visually appealing slides and effectively communicating your message. Download Comprehensive Customer Data Platform Guide Optimizing Promotional Initiatives Customer Profile Analysis KPI Dashboard Pictures PDF from Slidegeeks and deliver a wonderful presentation.
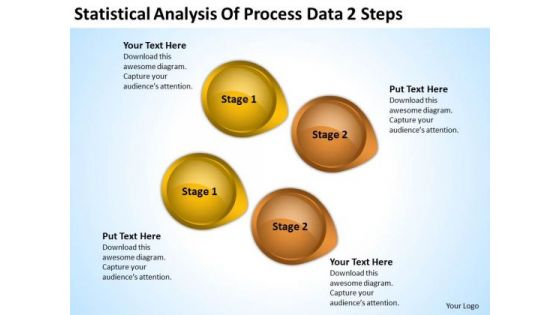
Power Point Arrows Statistical Analysis Of Process Data 2 Steps PowerPoint Templates
We present our power point arrows statistical analysis of process data 2 steps PowerPoint templates.Download and present our Business PowerPoint Templates because It is Aesthetically crafted by artistic young minds. Our PowerPoint Templates and Slides are designed to display your dexterity. Present our Arrows PowerPoint Templates because You can Rise to the occasion with our PowerPoint Templates and Slides. You will bring your audience on their feet in no time. Download and present our Circle Charts PowerPoint Templates because Our PowerPoint Templates and Slides help you pinpoint your timelines. Highlight the reasons for your deadlines with their use. Present our Shapes PowerPoint Templates because You aspire to touch the sky with glory. Let our PowerPoint Templates and Slides provide the fuel for your ascent. Present our Symbol PowerPoint Templates because You have gained great respect for your brilliant ideas. Use our PowerPoint Templates and Slides to strengthen and enhance your reputation.Use these PowerPoint slides for presentations relating to abstract, arrow, art, background, banner, blue, bright, business, circle, color, colorful, concept, conceptual, connection, creative, cycle, design, different, element, empty, flower, form, frame, graphic, green, group, idea, illustration, match, message, order, part, petal, piece, place, red, ring, shape, solution, special, speech, strategy, symbol, template, text, usable, vector, web, website. The prominent colors used in the PowerPoint template are Yellow, Brown, Black. People tell us our power point arrows statistical analysis of process data 2 steps PowerPoint templates will impress their bosses and teams. People tell us our circle PowerPoint templates and PPT Slides are designed by professionals Presenters tell us our power point arrows statistical analysis of process data 2 steps PowerPoint templates are second to none. We assure you our banner PowerPoint templates and PPT Slides will make the presenter successul in his career/life. Presenters tell us our power point arrows statistical analysis of process data 2 steps PowerPoint templates will help you be quick off the draw. Just enter your specific text and see your points hit home. Professionals tell us our background PowerPoint templates and PPT Slides will make the presenter look like a pro even if they are not computer savvy.
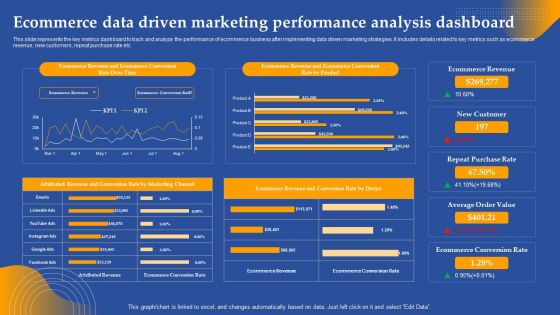
Ecommerce Data Driven Marketing Performance Analysis Dashboard Ppt Visual Aids Styles PDF
This slide represents the key metrics dashboard to track and analyze the performance of ecommerce business after implementing data driven marketing strategies. It includes details related to key metrics such as ecommerce revenue, new customers, repeat purchase rate etc. Slidegeeks has constructed Ecommerce Data Driven Marketing Performance Analysis Dashboard Ppt Visual Aids Styles PDF after conducting extensive research and examination. These presentation templates are constantly being generated and modified based on user preferences and critiques from editors. Here, you will find the most attractive templates for a range of purposes while taking into account ratings and remarks from users regarding the content. This is an excellent jumping off point to explore our content and will give new users an insight into our top notch PowerPoint Templates.
Risk Analysis Vector Icon Ppt Powerpoint Presentation Infographics File Formats
This is a risk analysis vector icon ppt powerpoint presentation infographics file formats. This is a four stage process. The stages in this process are feedback loop icon, evaluation icon, assessment icon.
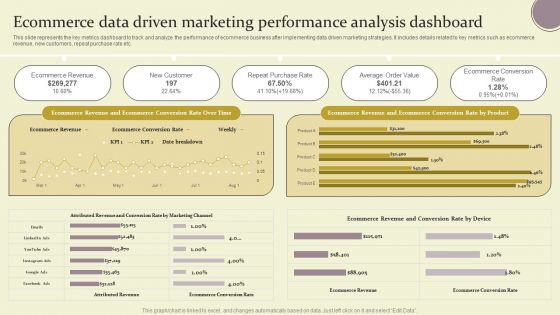
Ecommerce Data Driven Marketing Performance Analysis Dashboard Ppt Pictures Demonstration PDF
This slide represents the key metrics dashboard to track and analyze the performance of ecommerce business after implementing data driven marketing strategies. It includes details related to key metrics such as ecommerce revenue, new customers, repeat purchase rate etc. Slidegeeks has constructed Ecommerce Data Driven Marketing Performance Analysis Dashboard Ppt Pictures Demonstration PDF after conducting extensive research and examination. These presentation templates are constantly being generated and modified based on user preferences and critiques from editors. Here, you will find the most attractive templates for a range of purposes while taking into account ratings and remarks from users regarding the content. This is an excellent jumping off point to explore our content and will give new users an insight into our top notch PowerPoint Templates.
Human Resource Management Analysis And Audit System Icon Infographics PDF
Persuade your audience using this Human Resource Management Analysis And Audit System Icon Infographics PDF. This PPT design covers three sstages, thus making it a great tool to use. It also caters to a variety of topics including Human Resource Management, Analysis And Audit System Icon. Download this PPT design now to present a convincing pitch that not only emphasizes the topic but also showcases your presentation skills.
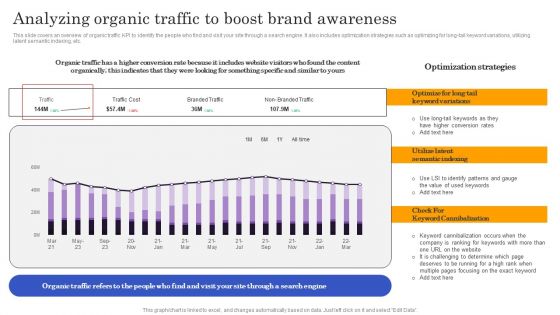
Marketers Guide To Data Analysis Optimization Analyzing Organic Traffic To Boost Brand Awareness Download PDF
This slide covers an overview of organic traffic KPI to identify the people who find and visit your site through a search engine. It also includes optimization strategies such as optimizing for long-tail keyword variations, utilizing latent semantic indexing, etc. If your project calls for a presentation, then Slidegeeks is your go to partner because we have professionally designed, easy to edit templates that are perfect for any presentation. After downloading, you can easily edit Marketers Guide To Data Analysis Optimization Analyzing Organic Traffic To Boost Brand Awareness Download PDF and make the changes accordingly. You can rearrange slides or fill them with different images. Check out all the handy templates

Data And Customer Analysis Company Outline Earning Per Share Free Cash Flow And EBITDA Structure PDF
This slide highlights the Nielsen Adj EBITDA margin, free cash flow, earnings per share, and organic constant currency revenue growth of the financial year 2021 with margin trend. Boost your pitch with our creative Data And Customer Analysis Company Outline Earning Per Share Free Cash Flow And EBITDA Structure PDF. Deliver an awe-inspiring pitch that will mesmerize everyone. Using these presentation templates you will surely catch everyones attention. You can browse the ppts collection on our website. We have researchers who are experts at creating the right content for the templates. So you do not have to invest time in any additional work. Just grab the template now and use them.
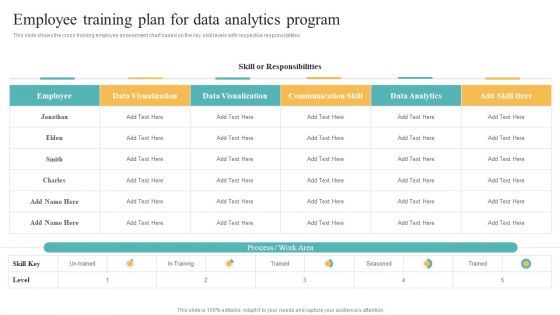
Transformation Toolkit Competitive Intelligence Information Analysis Employee Training Plan For Data Analytics Program Background PDF
This slide shows the cross training employee assessment chart based on the key skill levels with respective responsibilities. From laying roadmaps to briefing everything in detail, our templates are perfect for you. You can set the stage with your presentation slides. All you have to do is download these easy to edit and customizable templates. Transformation Toolkit Competitive Intelligence Information Analysis Employee Training Plan For Data Analytics Program Background PDF will help you deliver an outstanding performance that everyone would remember and praise you for. Do download this presentation today.

Data And Customer Analysis Company Outline Diversified And Growing Business Elements PDF
This slide highlights the Nielsen diversified and growing business which includes solutions revenue share, customer base and revenue by geography, contracted revenue and years of experience. Find a pre designed and impeccable Data And Customer Analysis Company Outline Diversified And Growing Business Elements PDF. The templates can ace your presentation without additional effort. You can download these easy to edit presentation templates to make your presentation stand out from others. So, what are you waiting for Download the template from Slidegeeks today and give a unique touch to your presentation.

Data And Customer Analysis Company Outline Revenue Growth Trend In Q4 And Fy21 Template PDF
This slide highlights the Nielsen company organic currency and organic constant currency growth trend. It also includes the full year revenue growth for measurement and content. Slidegeeks is one of the best resources for PowerPoint templates. You can download easily and regulate Data And Customer Analysis Company Outline Revenue Growth Trend In Q4 And Fy21 Template PDF for your personal presentations from our wonderful collection. A few clicks is all it takes to discover and get the most relevant and appropriate templates. Use our Templates to add a unique zing and appeal to your presentation and meetings. All the slides are easy to edit and you can use them even for advertisement purposes.
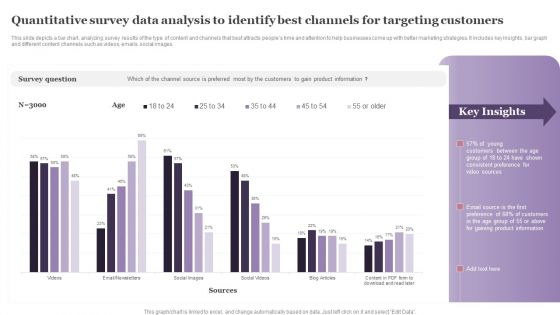
Quantitative Survey Data Analysis To Identify Best Channels For Targeting Customers Formats PDF
This slide depicts a bar chart, analyzing survey results of the type of content and channels that best attracts peoples time and attention to help businesses come up with better marketing strategies. It includes key insights, bar graph and different content channels such as videos, emails, social images. Pitch your topic with ease and precision using this Quantitative Survey Data Analysis To Identify Best Channels For Targeting Customers Formats PDF. This layout presents information on Survey Question, Young Customers, Consistent Preference. It is also available for immediate download and adjustment. So, changes can be made in the color, design, graphics or any other component to create a unique layout.

Half Yearly Organization Data Analysis Process Enhancement Best Practices Roadmap Portrait
Presenting the half yearly organization data analysis process enhancement best practices roadmap portrait. The template includes a roadmap that can be used to initiate a strategic plan. Not only this, the PowerPoint slideshow is completely editable and you can effortlessly modify the font size, font type, and shapes according to your needs. This PPT slide can be easily reached in standard screen and widescreen aspect ratios. The set is also available in various formats like PDF, PNG, and JPG. So download and use it multiple times as per your knowledge.
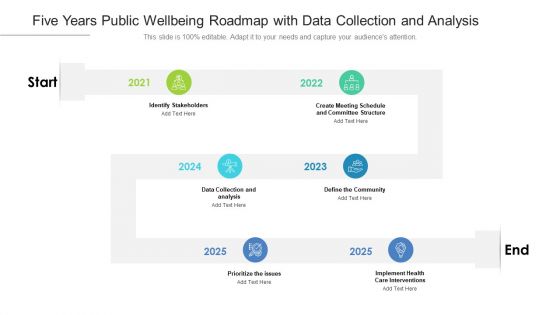
Five Years Public Wellbeing Roadmap With Data Collection And Analysis Topics
Presenting the five years public wellbeing roadmap with data collection and analysis topics. The template includes a roadmap that can be used to initiate a strategic plan. Not only this, the PowerPoint slideshow is completely editable and you can effortlessly modify the font size, font type, and shapes according to your needs. This PPT slide can be easily reached in standard screen and widescreen aspect ratios. The set is also available in various formats like PDF, PNG, and JPG. So download and use it multiple times as per your knowledge.

Half Yearly Public Wellbeing Roadmap With Data Collection And Analysis Graphics
Presenting the half yearly public wellbeing roadmap with data collection and analysis graphics. The template includes a roadmap that can be used to initiate a strategic plan. Not only this, the PowerPoint slideshow is completely editable and you can effortlessly modify the font size, font type, and shapes according to your needs. This PPT slide can be easily reached in standard screen and widescreen aspect ratios. The set is also available in various formats like PDF, PNG, and JPG. So download and use it multiple times as per your knowledge.

Six Months Public Wellbeing Roadmap With Data Collection And Analysis Clipart
Presenting the six months public wellbeing roadmap with data collection and analysis clipart. The template includes a roadmap that can be used to initiate a strategic plan. Not only this, the PowerPoint slideshow is completely editable and you can effortlessly modify the font size, font type, and shapes according to your needs. This PPT slide can be easily reached in standard screen and widescreen aspect ratios. The set is also available in various formats like PDF, PNG, and JPG. So download and use it multiple times as per your knowledge.

 Home
Home