Data Analysis Icon

Data Network Lines Computer PowerPoint Themes And PowerPoint Slides 0211
Microsoft PowerPoint Theme and Slide with computer sitting in tangled mess of chrome/reflective cables

Global Data Communication PowerPoint Themes And PowerPoint Slides 0511
Microsoft PowerPoint Theme and Slide with glossy earth floating over a 2D world map
Executing Advance Data Analytics At Workspace Need Of Appointing Chief Icons PDF
This slide covers details about the requirement of Chief Technology Officer which will be considered as important in technological advancement of firm as he plays vital role in increasing firms infrastructure intelligence capabilities. Deliver and pitch your topic in the best possible manner with this executing advance data analytics at workspace need of appointing chief icons pdf. Use them to share invaluable insights on need of appointing chief technology officer and impress your audience. This template can be altered and modified as per your expectations. So, grab it now.

Data Wiper Spyware Attack International Cyber Aid To Ukraine Icons PDF
This slide describes the international cyber assistance to Ukraine by 6 European Union nations such as Lithuania, the Netherlands, Poland, Estonia, Romania, and Croatia.Presenting data wiper spyware attack international cyber aid to ukraine icons pdf to provide visual cues and insights. Share and navigate important information on seven stages that need your due attention. This template can be used to pitch topics like might interrupt, critical services, jeopardizing national In addtion, this PPT design contains high resolution images, graphics, etc, that are easily editable and available for immediate download.

Business Diagram Four Staged Computer Tags Data Representation Presentation Template
This diagram has been designed with four staged computer tags. You can insert this diagram into your presentations to clarify information. Highlight your ideas broad based on strong fundamentals and illustrate how they step by step achieve the set growth factor.
IT Data Services Certification Programs Cisco Certified Network Professional CCNP Training Courses Icons PDF
This slide covers Cisco Certified Network Professional CCNP training courses such CCNA, specialist, CNP and CCIE. This is a IT Data Services Certification Programs Cisco Certified Network Professional CCNP Training Courses Icons PDF template with various stages. Focus and dispense information on six stages using this creative set, that comes with editable features. It contains large content boxes to add your information on topics like Enterprise Infrastructure, Service Provider, Security. You can also showcase facts, figures, and other relevant content using this PPT layout. Grab it now.

E Book Data Business PowerPoint Templates And PowerPoint Backgrounds 0311
Microsoft PowerPoint Template and Background with a multi colored bar chart sitting on top of a silver digital book reader

Four Infographics Banners For Data Display Powerpoint Template
Our above business slide contains diagram of four infographic banners. This PowerPoint slide may be used to exhibit business planning steps. Capture the attention of your audience with this slide.
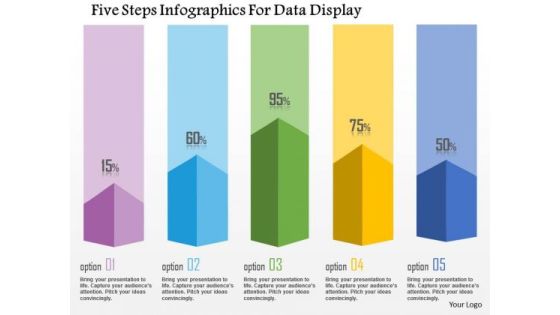
Business Diagram Five Steps Infographics For Data Display Presentation Template
This business diagram has been designed with graphic of five staged info graphics. This diagram can be used to display statistical information. Use this bar graph for your business and sales related presentations.

Online Stock Data Internet PowerPoint Templates And PowerPoint Backgrounds 0311
Microsoft PowerPoint Template and Background with a large magnifying glass top of touch screen computer with green stock chart show profit

Business Diagram Four Colored Signposts For Data Representation Presentation Template
This business diagram displays for signposts. It contains signposts with four options. This road sign diagram is best to represent four business options. Download this awesome diagram to pitch your ideas convincingly.
Risk Management Model For Data Security Mitigation Plan For Resolving Encountered Threat Icons PDF
Mentioned slide shows mitigation plan for resolving encountered threat. It covers details about encountered threat, its description, risk level, mitigation plan, resources required, responsible person, expected resolution time and communication mode. Deliver and pitch your topic in the best possible manner with this Risk Management Model For Data Security Mitigation Plan For Resolving Encountered Threat Icons PDF. Use them to share invaluable insights on Threat Encountered, Risk Level, Mitigation Plan, Resources Required and impress your audience. This template can be altered and modified as per your expectations. So, grab it now.

Construction Data Symbol PowerPoint Templates And PowerPoint Backgrounds 0211
Microsoft PowerPoint Template and Background with transparent three segment pie chart

Analyzing The Data Business PowerPoint Presentation Slides C
Microsoft PowerPoint Slides and Backgrounds with a magnifying glass hovering over a three dimensional multi colored bar chart
Analyzing The Data Business PowerPoint Presentation Slides Cc
Microsoft PowerPoint Slides and Backgrounds with a magnifying glass hovering over a three dimensional multi colored bar chart
Analyzing The Data Business PowerPoint Presentation Slides F
Microsoft PowerPoint Slides and Backgrounds with a magnifying glass hovering over a three dimensional multi colored bar chart
Analyzing The Data Business PowerPoint Presentation Slides R
Microsoft PowerPoint Slides and Backgrounds with a magnifying glass hovering over a three dimensional multi colored bar chart

Analyzing The Data Business PowerPoint Presentation Slides S
Microsoft PowerPoint Slides and Backgrounds with a magnifying glass hovering over a three dimensional multi colored bar chart
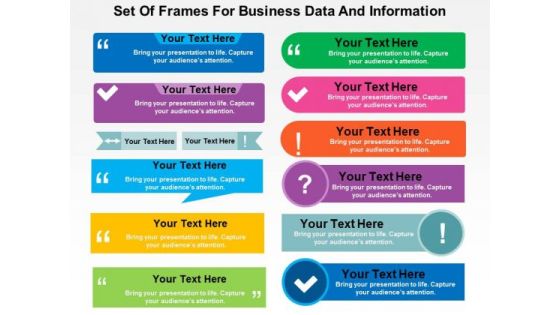
Set Of Frames For Business Data And Information PowerPoint Template
This business diagram can be used to make presentations to your team, customers and managers. You can easily customize this diagram as per your need. Capture the attention of your audience.
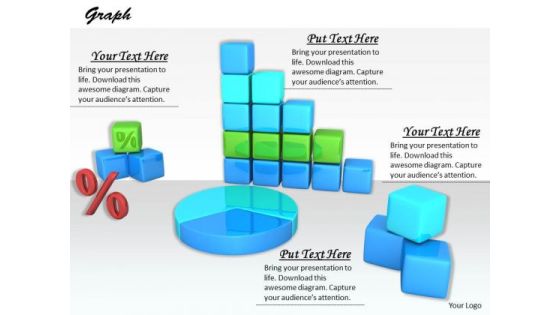
Stock Photo Design For Graphical Representations Of Data PowerPoint Slide
The above image contains a graphic of charts and graphs. Use this professional image in business or sales related presentations. It helps you to explain your plans in all earnest to your colleagues and raise the bar for all.
Using Data Science Technologies For Business Transformation Tasks And Skills Of Machine Learning Engineer Icons PDF
This slide represents the machine learning engineers tasks and skills, including a deep knowledge of machine learning, ML algorithms, and Python and C. Coming up with a presentation necessitates that the majority of the effort goes into the content and the message you intend to convey. The visuals of a PowerPoint presentation can only be effective if it supplements and supports the story that is being told. Keeping this in mind our experts created Using Data Science Technologies For Business Transformation Tasks And Skills Of Machine Learning Engineer Icons PDF to reduce the time that goes into designing the presentation. This way, you can concentrate on the message while our designers take care of providing you with the right template for the situation.

Data Processing Services Delivery How AI And Machine Learning Can Revolutionize Sales Icons PDF
This template covers the benefits of AI for the Sales and Marketing team. AI and Machine Learning benefits in the area of lead quality, engagement, and better understanding of buyer intent. Deliver and pitch your topic in the best possible manner with this Data Processing Services Delivery How AI And Machine Learning Can Revolutionize Sales Icons PDF. Use them to share invaluable insights on Social Media Posts, Terms Favorability, Brand, Product and impress your audience. This template can be altered and modified as per your expectations. So, grab it now.

Data Processing Services Delivery Raci Matrix For AI And ML Implementation Icons PDF
This slide depicts the roles and responsibilities of the staff while implementing the artificial intelligence and machine learning systems in the organization and it also includes the management tasks as well. Deliver and pitch your topic in the best possible manner with this Data Processing Services Delivery Raci Matrix For AI And ML Implementation Icons PDF. Use them to share invaluable insights on Responsibilities, Training, Training Planning and impress your audience. This template can be altered and modified as per your expectations. So, grab it now.

Business Diagram Sentiment Analysis From Different Social Media Feeds Ppt Slide
This diagram has been designed with graphic of funnel diagram displaying multiple icons of social media. These icons may be used to display social media sentiment analysis. Use this diagram slide for social media related presentations.

Data Driven Marketing Solutions Firm Company Profile Mission And Vision Icons PDF
The following slide highlights the mission and vision of Pure profile company to define its future path. It also shows the aspiration to convey the future goals of organization Welcome to our selection of the Data Driven Marketing Solutions Firm Company Profile Mission And Vision Icons PDF. These are designed to help you showcase your creativity and bring your sphere to life. Planning and Innovation are essential for any business that is just starting out. This collection contains the designs that you need for your everyday presentations. All of our PowerPoints are 100 percent editable, so you can customize them to suit your needs. This multi purpose template can be used in various situations. Grab these presentation templates today.

Data Science And BI Three Months Roadmap For Scientific Capability Improvement Icons
Presenting our jaw dropping data science and bi three months roadmap for scientific capability improvement icons. You can alternate the color, font size, font type, and shapes of this PPT layout according to your strategic process. This PPT presentation is compatible with Google Slides and is available in both standard screen and widescreen aspect ratios. You can also download this well researched PowerPoint template design in different formats like PDF, JPG, and PNG. So utilize this visually appealing design by clicking the download button given below.

Business Research And Analytics Vector Icon Ppt PowerPoint Presentation Professional Show
Presenting this set of slides with name business research and analytics vector icon ppt powerpoint presentation professional show. This is a three stage process. The stages in this process are data visualization icon, research analysis, business focus. This is a completely editable PowerPoint presentation and is available for immediate download. Download now and impress your audience.
Business Diagram Technology Icons With Globe For Data Transfer Presentation Template
This business slide contains various technology icons moving towards globe. Display concept of technology and global communication in visual manner with this diagram. Download this diagram slide to make professional presentations.
Business Diagram Infographics With Multiple Icons For Data Representation Presentation Template
This business diagram has been designed with graphic of multiple icons info graphics. Download this diagram to analyze the key points. This diagram offers a way for your audience to visually conceptualize the process.

Bar Charts For Business Performance Analysis Ppt PowerPoint Presentation Show Slideshow
This is a bar charts for business performance analysis ppt powerpoint presentation show slideshow. This is a two stage process. The stages in this process are compare, comparison of two, competitive analysis.
Business Diagram Three Clouds With Icons For Data Representation Presentation Template
Our above diagram is designed with graphic of clouds displaying three options. These clouds are designed with icons for text representation. Use this editable diagram for your cloud technology related presentations.

5 Colorful Post It Notes For Business Analysis Ppt PowerPoint Presentation Infographics
This is a 5 colorful post it notes for business analysis ppt powerpoint presentation infographics. This is a five stage process. The stages in this process are business, marketing, icons, post it, analysis.
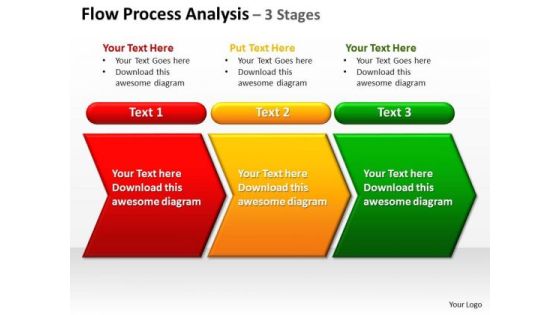
Sales Diagram Sales Diagram Flow Process Analysis 3 Stages Sales Diagram
Ask For Assistance From Our Sales Diagram Sales Diagram Flow Process Analysis 3 Stages Sales Diagram Powerpoint Templates. You Will Be Duly Satisfied.

Clients Existing Website Traffic Assessment SEO Audit Report Analysis Chart Of The Company Brochure PDF
The slide shows an SEO audit report analysis chart with details such as SEO factor, factor description, current factor status and action plan that needs to be implemented.Deliver an awe inspiring pitch with this creative Clients Existing Website Traffic Assessment SEO Audit Report Analysis Chart Of The Company Brochure PDF bundle. Topics like Current Status, Image Descriptions, Standard can be discussed with this completely editable template. It is available for immediate download depending on the needs and requirements of the user.

Company Profile Analysis Hindustan Construction Company Global Construction Market Overview Diagrams PDF
This slide represents company profile analysis for Hindustan construction company. It highlights organization headquarter, founding year, product and services, key competitors, projects etc. Deliver and pitch your topic in the best possible manner with this Company Profile Analysis Hindustan Construction Company Global Construction Market Overview Diagrams PDF. Use them to share invaluable insights on Key Competitors, Key Project Highlights, Product And Services and impress your audience. This template can be altered and modified as per your expectations. So, grab it now.
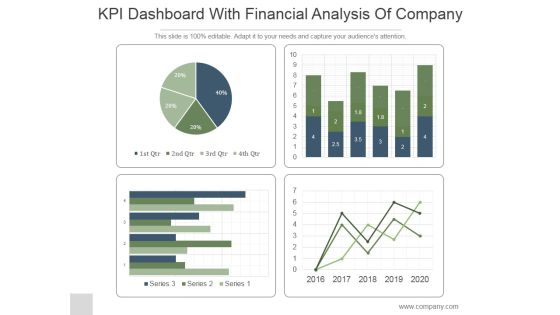
KPI Dashboard With Financial Analysis Of Company Ppt PowerPoint Presentation Backgrounds
This is a kpi dashboard with financial analysis of company ppt powerpoint presentation backgrounds. This is a four stage process. The stages in this process are business, strategy, marketing, line graph, finance.

Conjoint Analysis To Optimize Product Market Fit Guide To Brand Value Themes PDF
Following slide provides information about conjoint analysis which can be used by the organizations for optimizing the product market fit. It also includes benefits of conducting conjoint analysis.Coming up with a presentation necessitates that the majority of the effort goes into the content and the message you intend to convey. The visuals of a PowerPoint presentation can only be effective if it supplements and supports the story that is being told. Keeping this in mind our experts created Conjoint Analysis To Optimize Product Market Fit Guide To Brand Value Themes PDF to reduce the time that goes into designing the presentation. This way, you can concentrate on the message while our designers take care of providing you with the right template for the situation.

SWOT Analysis Of Marketing Strategy For Shipping Business Management Summary PDF
The given below slide illustrates the SWOT analysis of Marketing Strategy for Shipping Business to assess companys positioning and develop strategies based on the key outcomes.Presenting SWOT Analysis Of Marketing Strategy For Shipping Business Management Summary PDF to dispense important information. This template comprises four stages. It also presents valuable insights into the topics including Strength, Weakness, Opportunities. This is a completely customizable PowerPoint theme that can be put to use immediately. So, download it and address the topic impactfully.

Business Finance Strategy Development Market Analysis Diagram For Business Strategy Diagram
Dominate Proceedings With Your Ideas. Our Business Finance Strategy Development Market Analysis Diagram For Business Strategy Diagram Powerpoint Templates Will Empower Your Thoughts.

Contents For QA Plan And Process Set 3 Root Cause Analysis Tree Diagram Ideas PDF
This slide illustrates root cause analysis tree diagram that can be used by an organization to determine the root cause behind any problem encountered within its operations.Deliver and pitch your topic in the best possible manner with this Contents For QA Plan And Process Set 3 Root Cause Analysis Tree Diagram Ideas PDF Use them to share invaluable insights on Pump Failure, Bearing Failure, Erosion Corrosion and impress your audience. This template can be altered and modified as per your expectations. So, grab it now.
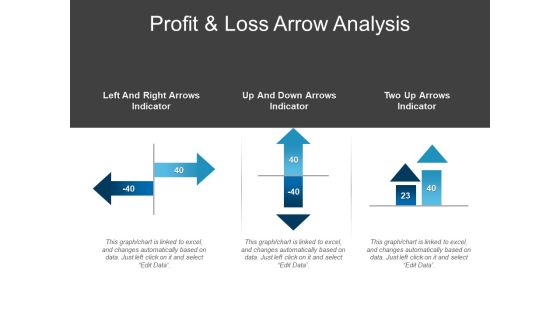
Profit And Loss Arrow Analysis Ppt PowerPoint Presentation Infographic Template Model
This is a profit and loss arrow analysis ppt powerpoint presentation infographic template model. This is a three stage process. The stages in this process are comparison chart, comparison table, comparison matrix.
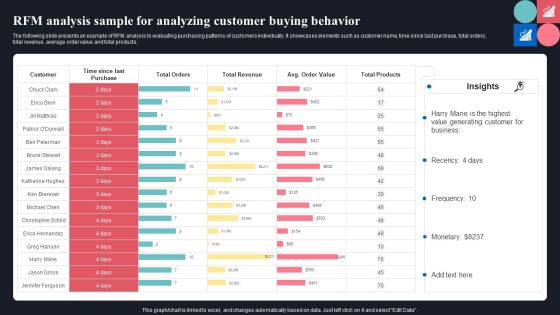
RFM Analysis Sample For Analyzing Customer Buying Behavior Ppt Gallery Diagrams PDF
The following slide presents an example of RFM analysis to evaluating purchasing patterns of customers individually. It showcases elements such as customer name, time since last purchase, total orders, total revenue, average order value and total products. Get a simple yet stunning designed RFM Analysis Sample For Analyzing Customer Buying Behavior Ppt Gallery Diagrams PDF. It is the best one to establish the tone in your meetings. It is an excellent way to make your presentations highly effective. So, download this PPT today from Slidegeeks and see the positive impacts. Our easy to edit RFM Analysis Sample For Analyzing Customer Buying Behavior Ppt Gallery Diagrams PDF can be your go to option for all upcoming conferences and meetings. So, what are you waiting for Grab this template today.
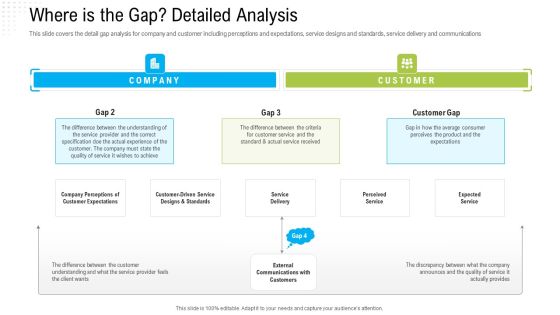
Robotization In Issues Management Where Is The Gap Detailed Analysis Ppt Portfolio Themes PDF
This slide covers the detail gap analysis for company and customer including perceptions and expectations, service designs and standards, service delivery and communications. Deliver an awe inspiring pitch with this creative robotization in issues management where is the gap detailed analysis ppt portfolio themes pdf bundle. Topics like service designs standards, company perceptions of customer expectations, external communications with customers, expected service can be discussed with this completely editable template. It is available for immediate download depending on the needs and requirements of the user.

Failure Modes And Effects Analysis Severity Occurrence And Detection FMEA Techniques For Process Assessment Diagrams PDF
This slide provides the table of effect analysis through potential severity, probability of occurrence, probability of detection. In addition to this table covers potential failure mode, potential failure effects, potential cause etc.Deliver an awe inspiring pitch with this creative Failure Modes And Effects Analysis Severity Occurrence And Detection FMEA Techniques For Process Assessment Diagrams PDF bundle. Topics like Potential Failure, Customer Requirements, Potential Causes can be discussed with this completely editable template. It is available for immediate download depending on the needs and requirements of the user.
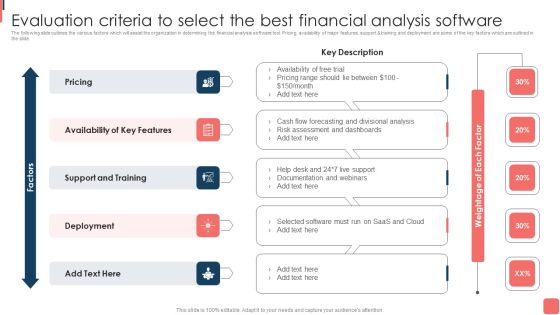
Effective Financial Planning Assessment Techniques Evaluation Criteria To Select The Best Financial Analysis Software Brochure PDF
The following slide outlines the various factors which will assist the organization in determining the financial analysis software tool. Pricing, availability of major features, support training and deployment are some of the key factors which are outlined in the slide. If you are looking for a format to display your unique thoughts, then the professionally designed Effective Financial Planning Assessment Techniques Evaluation Criteria To Select The Best Financial Analysis Software Brochure PDF is the one for you. You can use it as a Google Slides template or a PowerPoint template. Incorporate impressive visuals, symbols, images, and other charts. Modify or reorganize the text boxes as you desire. Experiment with shade schemes and font pairings. Alter, share or cooperate with other people on your work. Download Effective Financial Planning Assessment Techniques Evaluation Criteria To Select The Best Financial Analysis Software Brochure PDF and find out how to give a successful presentation. Present a perfect display to your team and make your presentation unforgettable.

Ready To Eat Food Market Analysis General Mills Weakness Ideas PDF
If you are looking for a format to display your unique thoughts, then the professionally designed Ready To Eat Food Market Analysis General Mills Weakness Ideas PDF is the one for you. You can use it as a Google Slides template or a PowerPoint template. Incorporate impressive visuals, symbols, images, and other charts. Modify or reorganize the text boxes as you desire. Experiment with shade schemes and font pairings. Alter, share or cooperate with other people on your work. Download Ready To Eat Food Market Analysis General Mills Weakness Ideas PDF and find out how to give a successful presentation. Present a perfect display to your team and make your presentation unforgettable.
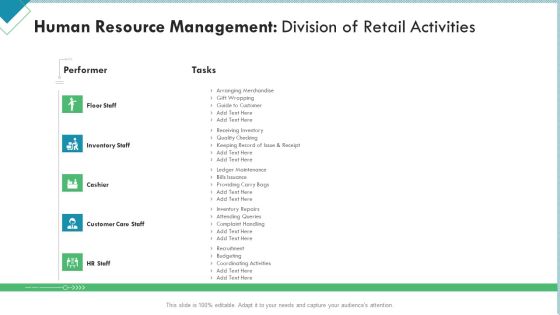
Market Analysis Of Retail Sector Human Resource Management Division Of Retail Activities Themes PDF
Deliver and pitch your topic in the best possible manner with this market analysis of retail sector human resource management division of retail activities themes pdf. Use them to share invaluable insights on floor staff, inventory staff, cashier, customer care staff, hr staff and impress your audience. This template can be altered and modified as per your expectations. So, grab it now.
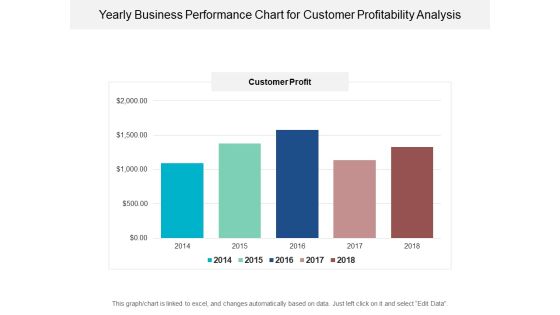
Yearly Business Performance Chart For Customer Profitability Analysis Ppt PowerPoint Presentation Ideas Picture
This is a yearly business performance chart for customer profitability analysis ppt powerpoint presentation ideas picture. This is a five stage process. The stages in this process are financial analysis, quantitative, statistical modelling.

Industry Analysis Of Real Estate And Construction Sector Real Estate Laws And Regulations Diagrams PDF
Deliver an awe inspiring pitch with this creative industry analysis of real estate and construction sector real estate laws and regulations diagrams pdf bundle. Topics like personal property, subsurface rights, surface rights, real property, real estate can be discussed with this completely editable template. It is available for immediate download depending on the needs and requirements of the user.
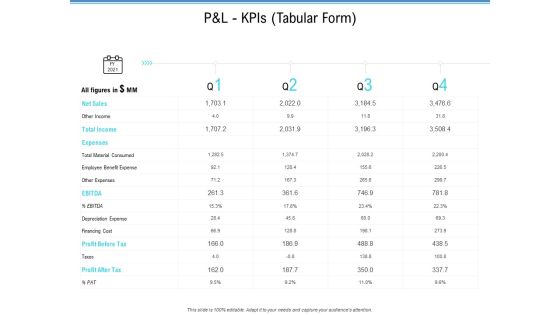
Enterprise Analysis P And L Kpis Tabular Form Ppt Slides Graphics Download PDF
Deliver and pitch your topic in the best possible manner with this enterprise analysis p and l kpis tabular form ppt slides graphics download pdf. Use them to share invaluable insights on operating profit, net profit, cogs, revenue and impress your audience. This template can be altered and modified as per your expectations. So, grab it now.

Competitive Analysis Template 4 Scatter Chart Radar Chart Ppt PowerPoint Presentation Topics
This is a competitive analysis template 4 scatter chart radar chart ppt powerpoint presentation topics. This is a six stage process. The stages in this process are business, analysis, graph, marketing, scatter.

Offline Media Channel Analysis Print Advertising Signs To Enhance Brand Visibility Themes PDF
This slide showcases the importance of advertising signs. Importance covered are enhance customer engagement, attracts more users, provides a competitive edge, etc. There are so many reasons you need a Offline Media Channel Analysis Print Advertising Signs To Enhance Brand Visibility Themes PDF. The first reason is you can not spend time making everything from scratch, Thus, Slidegeeks has made presentation templates for you too. You can easily download these templates from our website easily.

Quarterly Financial Performance Ratio Analysis Ppt PowerPoint Presentation Model Format Ideas
This is a quarterly financial performance ratio analysis ppt powerpoint presentation model format ideas. This is a four stage process. The stages in this process are financial analysis, quantitative, statistical modelling.

SWOT Analysis Weaknesses Develop Organizational Productivity By Enhancing Business Process Diagrams PDF
The slide shows the key points which the company needs to improve. Major weaknesses includes high expenditure in sustainability, high attrition rate etc. Presenting swot analysis weaknesses develop organizational productivity by enhancing business process diagrams pdf to provide visual cues and insights. Share and navigate important information on one stages that need your due attention. This template can be used to pitch topics like swot analysis weaknesses. In addtion, this PPT design contains high resolution images, graphics, etc, that are easily editable and available for immediate download.
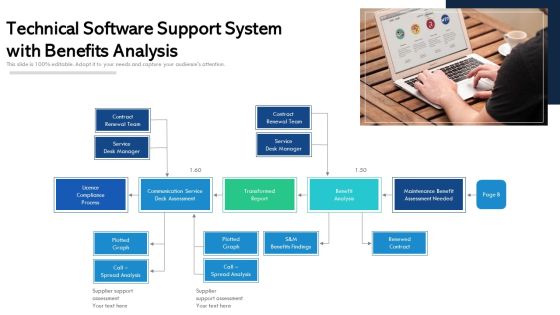
Technical Software Support System With Benefits Analysis Ppt Slides Ideas PDF
Presenting technical software support system with benefits analysis ppt slides ideas pdf to dispense important information. This template comprises one stage. It also presents valuable insights into the topics including renewed contract, benefits findings, spread analysis, transformed report, benefit analysis. This is a completely customizable PowerPoint theme that can be put to use immediately. So, download it and address the topic impactfully.

Bar Chart With Annual Performance Analysis Over Years Ppt PowerPoint Presentation Design Ideas
This is a bar chart with annual performance analysis over years ppt powerpoint presentation design ideas. This is a five stage process. The stages in this process are business, strategy, marketing, analysis, line graph.

Guide Developing Strategies Improve Travel Tourism Marketing SWOT Analysis Of Tourism Industry Diagrams PDF
This slide showcases the SWOT analysis of tourism industry to identify strength, weakness, opportunities and threats. It includes points such as satisfactory accommodation, implementing traditional marketing, marketing techniques and competitive market. Here you can discover an assortment of the finest PowerPoint and Google Slides templates. With these templates, you can create presentations for a variety of purposes while simultaneously providing your audience with an eye-catching visual experience. Download Guide Developing Strategies Improve Travel Tourism Marketing SWOT Analysis Of Tourism Industry Diagrams PDF to deliver an impeccable presentation. These templates will make your job of preparing presentations much quicker, yet still, maintain a high level of quality. Slidegeeks has experienced researchers who prepare these templates and write high-quality content for you. Later on, you can personalize the content by editing the Guide Developing Strategies Improve Travel Tourism Marketing SWOT Analysis Of Tourism Industry Diagrams PDF.

SWOT Analysis Of SBU Management Ppt PowerPoint Presentation Layouts Microsoft PDF
The given below slide presents the SWOT analysis of a business unit to assess its current position and accordingly plan new strategies. It internal factors strengths and weaknesses and external factors opportunities and threats.Presenting SWOT Analysis Of SBU Management Ppt PowerPoint Presentation Layouts Microsoft PDF to dispense important information. This template comprises four stages. It also presents valuable insights into the topics including Loyal Customer, Inadequate Supply, Increasing Competition. This is a completely customizable PowerPoint theme that can be put to use immediately. So, download it and address the topic impactfully.

SWOT Analysis Guide To Develop And Estimate Brand Value Diagrams PDF
This SWOT Analysis Guide To Develop And Estimate Brand Value Diagrams PDF is perfect for any presentation, be it in front of clients or colleagues. It is a versatile and stylish solution for organizing your meetings. The SWOT Analysis Guide To Develop And Estimate Brand Value Diagrams PDF features a modern design for your presentation meetings. The adjustable and customizable slides provide unlimited possibilities for acing up your presentation. Slidegeeks has done all the homework before launching the product for you. So, do not wait, grab the presentation templates today.

Organizational Needs Analysis Process For Business Ppt PowerPoint Presentation Professional Shapes PDF
Presenting organizational needs analysis process for business ppt powerpoint presentation professional shapes pdf to dispense important information. This template comprises four stages. It also presents valuable insights into the topics including organizational analysis, requirement analysis, developing training matrices. This is a completely customizable PowerPoint theme that can be put to use immediately. So, download it and address the topic impactfully.
 Home
Home