AI PPT Maker
Templates
PPT Bundles
Design Services
Business PPTs
Business Plan
Management
Strategy
Introduction PPT
Roadmap
Self Introduction
Timelines
Process
Marketing
Agenda
Technology
Medical
Startup Business Plan
Cyber Security
Dashboards
SWOT
Proposals
Education
Pitch Deck
Digital Marketing
KPIs
Project Management
Product Management
Artificial Intelligence
Target Market
Communication
Supply Chain
Google Slides
Research Services
 One Pagers
All Categories
-
Home
- Customer Favorites
- Data Analysis Icon
Data Analysis Icon

Kpi Dashboard Highlighting Automation Results In Supplyoptimizing Business Processes Through Automation Download PDF
The following slide outlines a comprehensive dashboard depicting the business process automation BPA results in the supply chain. Information covered in the slide is related to average order processing days, average shipping days, etc. There are so many reasons you need a Kpi Dashboard Highlighting Automation Results In Supplyoptimizing Business Processes Through Automation Download PDF. The first reason is you cannot spend time making everything from scratch, Thus, Slidegeeks has made presentation templates for you too. You can easily download these templates from our website easily.

ERP Change Administration Dashboard With Open Change Requests Wd Topics PDF
This slide showcases ERP change management dashboard to track process implementation efficiency and timely reporting of issues to upper management. It further includes package selection, ERP integration, design and deployment, IT infrastructure, training etc. Pitch your topic with ease and precision using this ERP Change Administration Dashboard With Open Change Requests Wd Topics PDF. This layout presents information on Approval, Status, Requests. It is also available for immediate download and adjustment. So, changes can be made in the color, design, graphics or any other component to create a unique layout.

Dashboard To Track Essential Activities Associated With IT Department Demonstration PDF
This slide provides information regarding dashboard to monitor critical activities related to IT in terms of incident tracker, outage report, IT spend per employee, application trends, etc. Slidegeeks is one of the best resources for PowerPoint templates. You can download easily and regulate Dashboard To Track Essential Activities Associated With IT Department Demonstration PDF for your personal presentations from our wonderful collection. A few clicks is all it takes to discover and get the most relevant and appropriate templates. Use our Templates to add a unique zing and appeal to your presentation and meetings. All the slides are easy to edit and you can use them even for advertisement purposes.
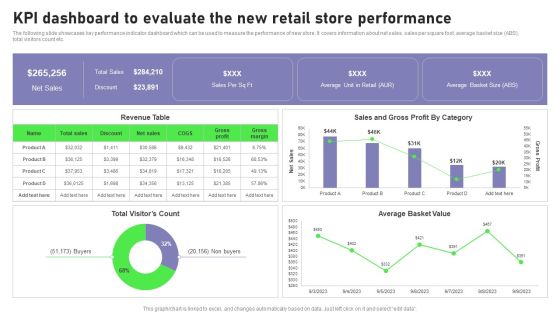
Retail Outlet Opening To Enhance Product Sale Kpi Dashboard To Evaluate The New Retail Guidelines PDF
The following slide showcases key performance indicator dashboard which can be used to measure the performance of new store. It covers information about net sales, sales per square foot, average basket size ABS, total visitors count etc. There are so many reasons you need a Retail Outlet Opening To Enhance Product Sale Kpi Dashboard To Evaluate The New Retail Guidelines PDF. The first reason is you can not spend time making everything from scratch, Thus, Slidegeeks has made presentation templates for you too. You can easily download these templates from our website easily.

Talent Retention Initiatives For New Hire Onboarding Performance Dashboard Monitoring Download PDF
This slide presents a dashboard illustrating the impact of effective employee onboarding. It includes information about, employee turnover, turnover rate, average years tenure, turnovers per quarter, turnover percentage per department and type of turnover- voluntary or involuntary. There are so many reasons you need a Talent Retention Initiatives For New Hire Onboarding Performance Dashboard Monitoring Download PDF. The first reason is you cannot spend time making everything from scratch, Thus, Slidegeeks has made presentation templates for you too. You can easily download these templates from our website easily.

Financial Dashboard For Non Profit Financial Plan Budget Management Elements PDF
The below slide exhibits a financial dashboard for non profit organizations that helps managers to analyze financial performance in an effective way. Key components are revenue ratio by entity, revenue ratio by type, etc.Pitch your topic with ease and precision using this Financial Dashboard For Non Profit Financial Plan Budget Management Elements PDF. This layout presents information on Revenue Actual, Revenue Actual. It is also available for immediate download and adjustment. So, changes can be made in the color, design, graphics or any other component to create a unique layout.

Assessment Of Amazon Brand Performance KPI Dashboard To Track Amazon Elements PDF
This slide provides information regarding dashboard to monitor Amazon performance. The KPIs include tracking of product sales, conversion rate, advertising spends, session, organic sales, etc. Slidegeeks is one of the best resources for PowerPoint templates. You can download easily and regulate Assessment Of Amazon Brand Performance KPI Dashboard To Track Amazon Elements PDF for your personal presentations from our wonderful collection. A few clicks is all it takes to discover and get the most relevant and appropriate templates. Use our Templates to add a unique zing and appeal to your presentation and meetings. All the slides are easy to edit and you can use them even for advertisement purposes.

Successful Product Inauguration Management Managing Product Launch Activities Professional PDF
This slide provides information regarding product launch activities tracking dashboard in terms of project budget, projected launch date, overdue tasks, etc. Deliver and pitch your topic in the best possible manner with this successful product inauguration management managing product launch activities professional pdf. Use them to share invaluable insights on managing product launch activities dashboard and impress your audience. This template can be altered and modified as per your expectations. So, grab it now.
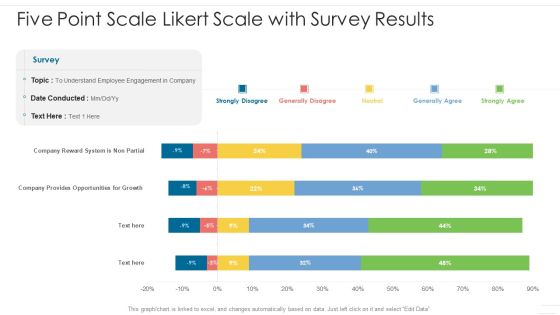
Five Point Scale Likert Scale With Survey Results Diagrams PDF
Pitch your topic with ease and precision using this five point scale likert scale with survey results diagrams pdf. This layout presents information on service, customer, survey. It is also available for immediate download and adjustment. So, changes can be made in the color, design, graphics or any other component to create a unique layout.

Marketing Performance Dashboard With Advertisement Client Acquisition Techniques To Boost Sales Professional PDF
This Marketing Performance Dashboard With Advertisement Client Acquisition Techniques To Boost Sales Professional PDF is perfect for any presentation, be it in front of clients or colleagues. It is a versatile and stylish solution for organizing your meetings. The Marketing Performance Dashboard With Advertisement Client Acquisition Techniques To Boost Sales Professional PDF features a modern design for your presentation meetings. The adjustable and customizable slides provide unlimited possibilities for acing up your presentation. Slidegeeks has done all the homework before launching the product for you. So, do not wait, grab the presentation templates today
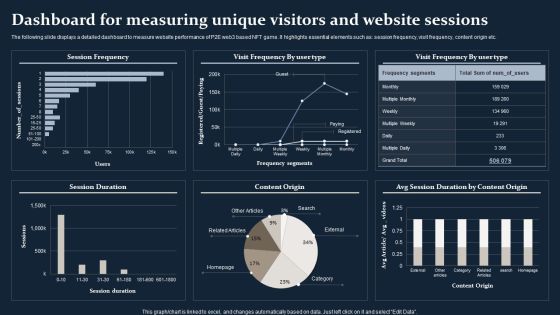
Smartphone Game Development And Advertising Technique Dashboard For Measuring Unique Visitors Brochure PDF
Crafting an eye catching presentation has never been more straightforward. Let your presentation shine with this tasteful yet straightforward Smartphone Game Development And Advertising Technique Dashboard For Measuring Unique Visitors Brochure PDF template. It offers a minimalistic and classy look that is great for making a statement. The colors have been employed intelligently to add a bit of playfulness while still remaining professional. Construct the ideal Smartphone Game Development And Advertising Technique Dashboard For Measuring Unique Visitors Brochure PDF that effortlessly grabs the attention of your audience. Begin now and be certain to wow your customers.

Top SEO Techniques Statistics Highlighting Growing Usage Of Mobile Devices Ideas PDF
The purpose of this slide is to outline major statistics associated with mobile devices and desktops. It covers information about the search comparison between mobile and desktop over the different years. Make sure to capture your audiences attention in your business displays with our gratis customizable Top SEO Techniques Statistics Highlighting Growing Usage Of Mobile Devices Ideas PDF. These are great for business strategies, office conferences, capital raising or task suggestions. If you desire to acquire more customers for your tech business and ensure they stay satisfied, create your own sales presentation with these plain slides.

Successful Staff Retention Techniques Key Employee Retention Statistics For 2023 Graphics PDF
The purpose of this slide is to showcase some of the major employee retention statistics. Information covered in this slide is related to non action against unethical behavior, salary hike, positive employee experience, better growth opportunities, recognition etc. From laying roadmaps to briefing everything in detail, our templates are perfect for you. You can set the stage with your presentation slides. All you have to do is download these easy to edit and customizable templates. Successful Staff Retention Techniques Key Employee Retention Statistics For 2023 Graphics PDF will help you deliver an outstanding performance that everyone would remember and praise you for. Do download this presentation today.

Worker Skills Chart With Problem Solving Ppt Summary Visuals PDF
Pitch your topic with ease and precision using this worker skills chart with problem solving ppt summary visuals pdf. This layout presents information on leadership, communication, management. It is also available for immediate download and adjustment. So, changes can be made in the color, design, graphics or any other component to create a unique layout.
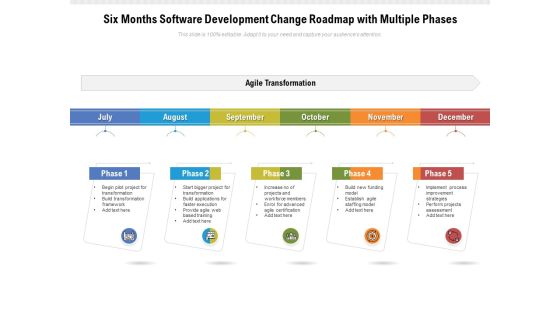
Six Months Software Development Change Roadmap With Multiple Phases Download
A well thought out action plan makes execution easier and increases the possibility of success significantly. Ensure hitting all the milestones within the deadlines by introducing our fully customizable six months software development change roadmap with multiple phases download. Streamline the work related information, budget, timeframe, key deliverable, landmarks, and major steps involved, all in one place to give an organized overview of the project by utilizing our PowerPoint theme. Minimize time lag and increase work efficiency by providing insight into the process with our comprehensively researched roadmap PowerPoint layout. Color coding helps in highlighting the process and grabs the attention of the audience. Download our handy six months software development change roadmap with multiple phases download to identify the possible problem areas in a much shorter time and propose solutions. Have a productive brainstorming session with your workforce by utilizing our action plan visualization tool.
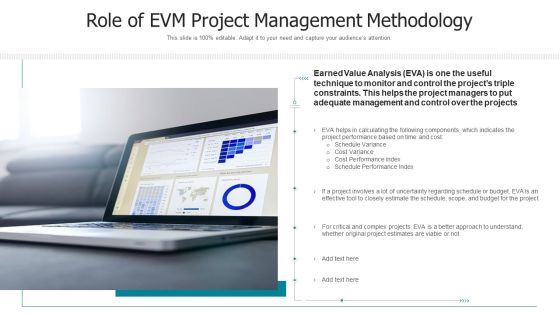
Role Of EVM Project Management Methodology Designs PDF
Presenting role of evm project management methodology designs pdf to dispense important information. This template comprises one stages. It also presents valuable insights into the topics including role of evm project management methodology. This is a completely customizable PowerPoint theme that can be put to use immediately. So, download it and address the topic impactfully.

Business Study Phase In DSDM Dynamic System Development Model Summary PDF
This slide describes the business study phase of DSDM which involves organizing workshops and making business reports.Slidegeeks is here to make your presentations a breeze with Business Study Phase In DSDM Dynamic System Development Model Summary PDF With our easy-to-use and customizable templates, you can focus on delivering your ideas rather than worrying about formatting. With a variety of designs to choose from, you are sure to find one that suits your needs. And with animations and unique photos, illustrations, and fonts, you can make your presentation pop. So whether you are giving a sales pitch or presenting to the board, make sure to check out Slidegeeks first.

Utilizing SEO To Boost Customer KPI Metrics Dashboard To Monitor Mobile Seo Performance Download PDF
The purpose of this slide is to outline key performance indicator KPI dashboard which will assist the marketer to analyze mobile search engine optimization SEO performance. The key metrics mentioned in the slide are total sessions, search engine rankings etc. Coming up with a presentation necessitates that the majority of the effort goes into the content and the message you intend to convey. The visuals of a PowerPoint presentation can only be effective if it supplements and supports the story that is being told. Keeping this in mind our experts created Utilizing SEO To Boost Customer KPI Metrics Dashboard To Monitor Mobile Seo Performance Download PDF to reduce the time that goes into designing the presentation. This way, you can concentrate on the message while our designers take care of providing you with the right template for the situation.
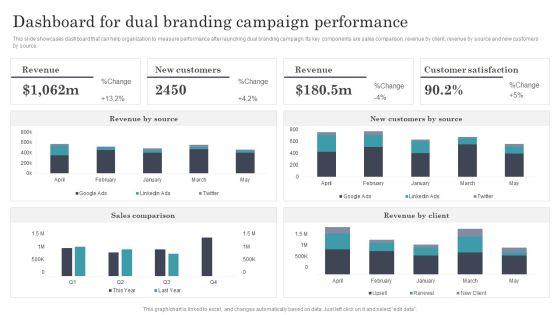
Developing Dual Branding Campaign For Brand Marketing Dashboard For Dual Branding Campaign Performance Ideas PDF
This slide showcases dashboard that can help organization to measure performance after launching dual branding campaign. Its key components are sales comparison, revenue by client, revenue by source and new customers by source. Boost your pitch with our creative Developing Dual Branding Campaign For Brand Marketing Dashboard For Dual Branding Campaign Performance Ideas PDF. Deliver an awe inspiring pitch that will mesmerize everyone. Using these presentation templates you will surely catch everyones attention. You can browse the ppts collection on our website. We have researchers who are experts at creating the right content for the templates. So you do not have to invest time in any additional work. Just grab the template now and use them.

Dashboard To Identify Open Positions And Offer Acceptance Ratio Slides PDF
This slide showcases dashboard that can help organization to identify open positions in organization after conducting recruitment and offer acceptance ratio of candidates. It also showcases various other components which are shortlisted candidates, hired candidates, time to hire, cost to hire, applications details. Boost your pitch with our creative Dashboard To Identify Open Positions And Offer Acceptance Ratio Slides PDF. Deliver an awe inspiring pitch that will mesmerize everyone. Using these presentation templates you will surely catch everyones attention. You can browse the ppts collection on our website. We have researchers who are experts at creating the right content for the templates. So you do not have to invest time in any additional work. Just grab the template now and use them.

Human Resource Analytics HR Talent Management Key Metrics Dashboard Brochure PDF
This slide represents the KPI dashboard to track and monitor management of talent by the HR department. It includes details related to talent satisfaction, talent turnover rate, fired talents etc. Coming up with a presentation necessitates that the majority of the effort goes into the content and the message you intend to convey. The visuals of a PowerPoint presentation can only be effective if it supplements and supports the story that is being told. Keeping this in mind our experts created Human Resource Analytics HR Talent Management Key Metrics Dashboard Brochure PDF to reduce the time that goes into designing the presentation. This way, you can concentrate on the message while our designers take care of providing you with the right template for the situation.

Dashboard To Monitor Construction Site Injuries Construction Site Safety Plan Elements PDF
This slide showcase the dashboard to monitor workers injuries at the construction site. It includes details regarding the injuries type, severity. It also covers details of the monthly accident rate, working hours, and the count of injuries by body part. Coming up with a presentation necessitates that the majority of the effort goes into the content and the message you intend to convey. The visuals of a PowerPoint presentation can only be effective if it supplements and supports the story that is being told. Keeping this in mind our experts created Dashboard To Monitor Construction Site Injuries Construction Site Safety Plan Elements PDF to reduce the time that goes into designing the presentation. This way, you can concentrate on the message while our designers take care of providing you with the right template for the situation.
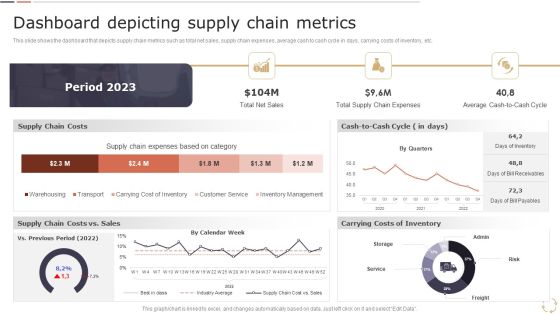
Optimizing Logistics Models To Enhance Supply Chain Management Dashboard Depicting Supply Chain Metrics Download PDF
This slide shows the dashboard that depicts supply chain metrics such as total net sales, supply chain expenses, average cash to cash cycle in days, carrying costs of inventory, etc. Coming up with a presentation necessitates that the majority of the effort goes into the content and the message you intend to convey. The visuals of a PowerPoint presentation can only be effective if it supplements and supports the story that is being told. Keeping this in mind our experts created Optimizing Logistics Models To Enhance Supply Chain Management Dashboard Depicting Supply Chain Metrics Download PDF to reduce the time that goes into designing the presentation. This way, you can concentrate on the message while our designers take care of providing you with the right template for the situation.

BPR To Develop Operational Effectiveness Dashboard To Measure Business Financial Performance Elements PDF
This slide shows the dashboard to measure business financial performance which focuses on revenues, debt to equity, net profit margin, gross profit margin and return on equity. Coming up with a presentation necessitates that the majority of the effort goes into the content and the message you intend to convey. The visuals of a PowerPoint presentation can only be effective if it supplements and supports the story that is being told. Keeping this in mind our experts created BPR To Develop Operational Effectiveness Dashboard To Measure Business Financial Performance Elements PDF to reduce the time that goes into designing the presentation. This way, you can concentrate on the message while our designers take care of providing you with the right template for the situation.

Customer Support Services Dashboard Depicting Performance Metrics Of Customer Designs PDF
This slide showcases dashboard depicting major customer service KPIs. The performance metrics covered are search exit rate, CSAT, average first response time, tickets solved, etc. Coming up with a presentation necessitates that the majority of the effort goes into the content and the message you intend to convey. The visuals of a PowerPoint presentation can only be effective if it supplements and supports the story that is being told. Keeping this in mind our experts created Customer Support Services Dashboard Depicting Performance Metrics Of Customer Designs PDF to reduce the time that goes into designing the presentation. This way, you can concentrate on the message while our designers take care of providing you with the right template for the situation.
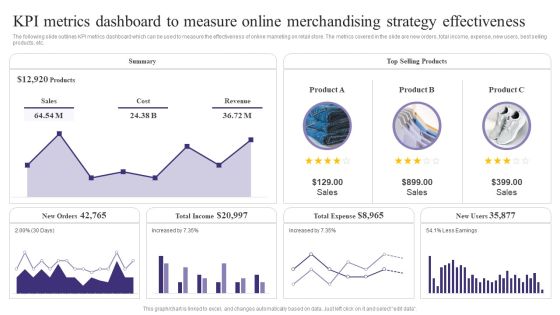
KPI Metrics Dashboard To Measure Online Merchandising Strategy Effectiveness Sample PDF
The following slide outlines KPI metrics dashboard which can be used to measure the effectiveness of online marketing on retail store. The metrics covered in the slide are new orders, total income, expense, new users, best selling products, etc. Coming up with a presentation necessitates that the majority of the effort goes into the content and the message you intend to convey. The visuals of a PowerPoint presentation can only be effective if it supplements and supports the story that is being told. Keeping this in mind our experts created KPI Metrics Dashboard To Measure Online Merchandising Strategy Effectiveness Sample PDF to reduce the time that goes into designing the presentation. This way, you can concentrate on the message while our designers take care of providing you with the right template for the situation.

KPI Metrics Dashboard To Measure Online Merchandising Strategy Effectiveness Pictures PDF
The following slide outlines KPI metrics dashboard which can be used to measure the effectiveness of online marketing on retail store. The metrics covered in the slide are new orders, total income, expense, new users, best selling products, etc. Coming up with a presentation necessitates that the majority of the effort goes into the content and the message you intend to convey. The visuals of a PowerPoint presentation can only be effective if it supplements and supports the story that is being told. Keeping this in mind our experts created KPI Metrics Dashboard To Measure Online Merchandising Strategy Effectiveness Pictures PDF to reduce the time that goes into designing the presentation. This way, you can concentrate on the message while our designers take care of providing you with the right template for the situation.
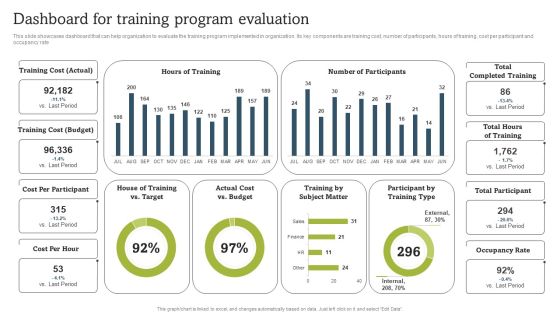
On Job Staff Coaching Program For Skills Refinement Dashboard For Training Program Evaluation Download PDF
This slide showcases dashboard that can help organization to evaluate the training program implemented in organization. Its key components are training cost, number of participants, hours of training, cost per participant and occupancy rate. Boost your pitch with our creative On Job Staff Coaching Program For Skills Refinement Dashboard For Training Program Evaluation Download PDF. Deliver an awe inspiring pitch that will mesmerize everyone. Using these presentation templates you will surely catch everyones attention. You can browse the ppts collection on our website. We have researchers who are experts at creating the right content for the templates. So you do not have to invest time in any additional work. Just grab the template now and use them.

Boosting Yearly Business Revenue KPI Dashboard To Track Sales Plan Performance Topics PDF
This slide shows dashboard which can be used by organizations to measure the results of sales plan. It includes metrics such as sales per product, actual vs target sales, sales by region, sales by channel, etc. Boost your pitch with our creative Boosting Yearly Business Revenue KPI Dashboard To Track Sales Plan Performance Topics PDF. Deliver an awe-inspiring pitch that will mesmerize everyone. Using these presentation templates you will surely catch everyones attention. You can browse the ppts collection on our website. We have researchers who are experts at creating the right content for the templates. So you dont have to invest time in any additional work. Just grab the template now and use them.

Call Center Action Plan Dashboard Strategies To Enhance Call Center Management Brochure PDF
This slide showcases dashboard for call center action plan which includes total calls, average answer speed, abandon rate, average calls per minute with agent performance and overall customer satisfaction score. Coming up with a presentation necessitates that the majority of the effort goes into the content and the message you intend to convey. The visuals of a PowerPoint presentation can only be effective if it supplements and supports the story that is being told. Keeping this in mind our experts created Call Center Action Plan Dashboard Strategies To Enhance Call Center Management Brochure PDF to reduce the time that goes into designing the presentation. This way, you can concentrate on the message while our designers take care of providing you with the right template for the situation.

Dashboard To Track Performance Of Field Marketing Sales Employees Topics PDF
This slide showcases dashboard that can help organization to track the performance of sales employees and conduct training in case of any discrepancy in achievement of marketing goals. Its key elements are weekly sales, team sales, leaderboard this year etc. Boost your pitch with our creative Dashboard To Track Performance Of Field Marketing Sales Employees Topics PDF. Deliver an awe inspiring pitch that will mesmerize everyone. Using these presentation templates you will surely catch everyones attention. You can browse the ppts collection on our website. We have researchers who are experts at creating the right content for the templates. So you do not have to invest time in any additional work. Just grab the template now and use them.
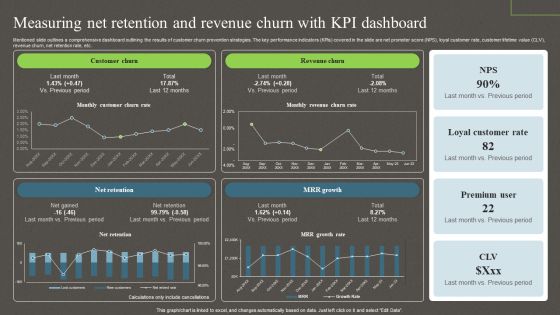
Measuring Net Retention And Revenue Churn With Kpi Dashboard Ppt PowerPoint Presentation File Backgrounds PDF
Mentioned slide outlines a comprehensive dashboard outlining the results of customer churn prevention strategies. The key performance indicators KPIs covered in the slide are net promoter score NPS, loyal customer rate, customer lifetime value CLV, revenue churn, net retention rate, etc. Boost your pitch with our creative Measuring Net Retention And Revenue Churn With Kpi Dashboard Ppt PowerPoint Presentation File Backgrounds PDF. Deliver an awe inspiring pitch that will mesmerize everyone. Using these presentation templates you will surely catch everyones attention. You can browse the ppts collection on our website. We have researchers who are experts at creating the right content for the templates. So you do not have to invest time in any additional work. Just grab the template now and use them.
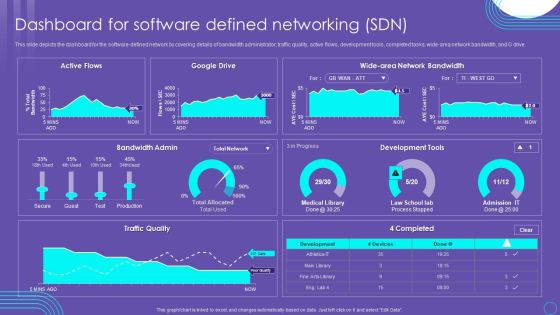
SDN Security Architecture Dashboard For Software Defined Networking SDN Mockup PDF
This slide depicts the dashboard for the software defined network by covering details of bandwidth administrator, traffic quality, active flows, development tools, completed tasks, wide area network bandwidth, and G drive. Coming up with a presentation necessitates that the majority of the effort goes into the content and the message you intend to convey. The visuals of a PowerPoint presentation can only be effective if it supplements and supports the story that is being told. Keeping this in mind our experts created SDN Security Architecture Dashboard For Software Defined Networking SDN Mockup PDF to reduce the time that goes into designing the presentation. This way, you can concentrate on the message while our designers take care of providing you with the right template for the situation.

Dashboard To Track Results Of Performance Marketing Ad Campaigns Ppt PowerPoint Presentation File Ideas PDF
This slide showcases dashboard that can help marketers to track and evaluate the outcomes of performance marketing ad campaigns. Its key elements are impressions, clicks, conversions, click through rate, cost per conversion, revenue per click etc Coming up with a presentation necessitates that the majority of the effort goes into the content and the message you intend to convey. The visuals of a PowerPoint presentation can only be effective if it supplements and supports the story that is being told. Keeping this in mind our experts created Dashboard To Track Results Of Performance Marketing Ad Campaigns Ppt PowerPoint Presentation File Ideas PDF to reduce the time that goes into designing the presentation. This way, you can concentrate on the message while our designers take care of providing you with the right template for the situation.

Effective Strategies For Retaining Healthcare Staff Employee Retention Dashboard For Hr Department Formats PDF
The purpose of this slide is to delineate a staff retention dashboard through which the human resource HR department can measure the effectiveness of retention strategies. The KPIs are hiring source, location, department, job type, job category etc. Boost your pitch with our creative Effective Strategies For Retaining Healthcare Staff Employee Retention Dashboard For Hr Department Formats PDF. Deliver an awe inspiring pitch that will mesmerize everyone. Using these presentation templates you will surely catch everyones attention. You can browse the ppts collection on our website. We have researchers who are experts at creating the right content for the templates. So you do not have to invest time in any additional work. Just grab the template now and use them.

Dashboard To Track Reporting And Billing Time Ppt PowerPoint Presentation File Infographics PDF
Following slide exhibits billing system dashboard that assure efficient time tracking and bills management. It include elements such as total invoices, customers, suppliers, products etc. Coming up with a presentation necessitates that the majority of the effort goes into the content and the message you intend to convey. The visuals of a PowerPoint presentation can only be effective if it supplements and supports the story that is being told. Keeping this in mind our experts created Dashboard To Track Reporting And Billing Time Ppt PowerPoint Presentation File Infographics PDF to reduce the time that goes into designing the presentation. This way, you can concentrate on the message while our designers take care of providing you with the right template for the situation.

Financial Dashboard To Track Organization Expenses Ppt PowerPoint Presentation File Ideas PDF
The following slide showcases KPI dashboard which can be used by finance managers to evaluate financial health of company. Revenue, expenses, net profit, bills receivable, bills payable, quick ratio, current ratio are some of the major metrics which are outlined in the slide. Boost your pitch with our creative Financial Dashboard To Track Organization Expenses Ppt PowerPoint Presentation File Ideas PDF. Deliver an awe-inspiring pitch that will mesmerize everyone. Using these presentation templates you will surely catch everyones attention. You can browse the ppts collection on our website. We have researchers who are experts at creating the right content for the templates. So you do not have to invest time in any additional work. Just grab the template now and use them.

Tactics For Establishing Sustainable Hybrid Work Environment Dashboard To Analyze Flexible Working Strategies Topics PDF
The following slide delineates a key performance indicator KPI dashboard through which managers can evaluate the success of a flexible working policy on workforce performance. The major KPIs are absenteeism rate, overall labor effectiveness etc. Boost your pitch with our creative Tactics For Establishing Sustainable Hybrid Work Environment Dashboard To Analyze Flexible Working Strategies Topics PDF. Deliver an awe-inspiring pitch that will mesmerize everyone. Using these presentation templates you will surely catch everyones attention. You can browse the ppts collection on our website. We have researchers who are experts at creating the right content for the templates. So you do not have to invest time in any additional work. Just grab the template now and use them.
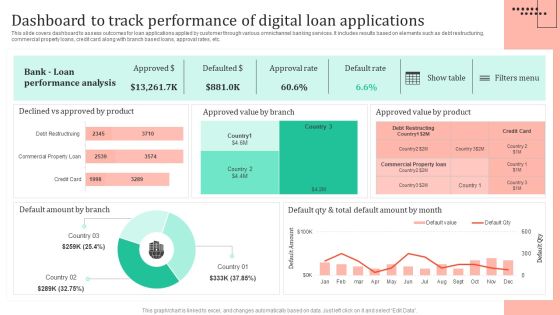
Omnichannel Strategy Implementation For Banking Solutions Dashboard To Track Performance Of Digital Summary PDF
This slide covers dashboard to assess outcomes for loan applications applied by customer through various omnichannel banking services. It includes results based on elements such as debt restructuring, commercial property loans, credit card along with branch based loans, approval rates, etc. Boost your pitch with our creative Omnichannel Strategy Implementation For Banking Solutions Dashboard To Track Performance Of Digital Summary PDF. Deliver an awe-inspiring pitch that will mesmerize everyone. Using these presentation templates you will surely catch everyones attention. You can browse the ppts collection on our website. We have researchers who are experts at creating the right content for the templates. So you do not have to invest time in any additional work. Just grab the template now and use them.

Customer Segmentation Dashboard To Monitor Results Ppt Layouts Graphics Pictures PDF
The following slide showcases a dashboard to monitor customer segmentation based on similar traits and characteristics. It highlights elements such as total customer in each segments, segments description, segment characteristics and search customer by ID. Boost your pitch with our creative Customer Segmentation Dashboard To Monitor Results Ppt Layouts Graphics Pictures PDF. Deliver an awe inspiring pitch that will mesmerize everyone. Using these presentation templates you will surely catch everyones attention. You can browse the ppts collection on our website. We have researchers who are experts at creating the right content for the templates. So you do not have to invest time in any additional work. Just grab the template now and use them.
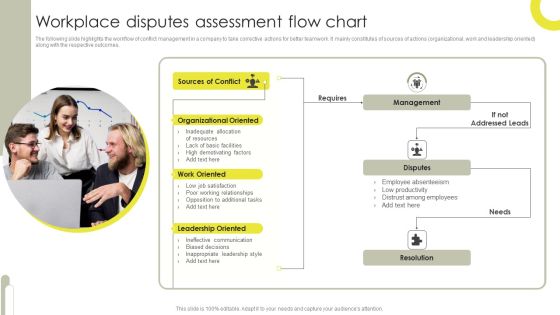
Workplace Disputes Assessment Flow Chart Rules PDF
The following slide highlights the workflow of conflict management in a company to take corrective actions for better teamwork. It mainly constitutes of sources of actions organizational, work and leadership oriented along with the respective outcomes. Presenting Workplace Disputes Assessment Flow Chart Rules PDF to dispense important information. This template comprises one stages. It also presents valuable insights into the topics including Organizational Oriented, Work Oriented, Leadership Oriented. This is a completely customizable PowerPoint theme that can be put to use immediately. So, download it and address the topic impactfully.

Information Seo Ppt PowerPoint Presentation Outline Example File Cpb
This is a information seo ppt powerpoint presentation outline example file cpb. This is a four stage process. The stages in this process are information seo.

Statistical Graphical Technique For Late Comings At Workplace Ppt PowerPoint Presentation File Outline PDF
Presenting this set of slides with name statistical graphical technique for late comings at workplace ppt powerpoint presentation file outline pdf. The topics discussed in these slide is statistical graphical technique for late comings at workplace. This is a completely editable PowerPoint presentation and is available for immediate download. Download now and impress your audience.

Idea Framework To Shift To Contactless Services And Solutions Information PDF
This slide provides information about the IDEA framework that can be adopted by the restaurant operators in order to shift to contactless services and solutions. Deliver and pitch your topic in the best possible manner with this idea framework to shift to contactless services and solutions information pdf. Use them to share invaluable insights on identify interactions, diagnose and prioritize risks, execute solutions, adapt and sustain and impress your audience. This template can be altered and modified as per your expectations. So, grab it now.
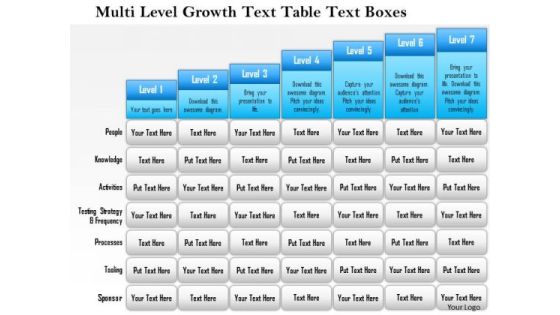
Business Framework Multi Level Growth Text Table Text Boxes 4 PowerPoint Presentation
Seven staged text box diagram has been used to decorate this Power Point template slide. This diagram slide contains the concept of multilevel growth. Use this template and build unique presentation for growth topic.

Enhancing Stp Strategies For A Successful Market Promotion Kpi Dashboard To Monitor Diagrams PDF
Mentioned slide shows the KPI dashboard that can be used to track win and lost sales opportunities. It includes metrics namely won opportunities, lost opportunities, pipeline by territory, total opportunities. Deliver and pitch your topic in the best possible manner with this enhancing stp strategies for a successful market promotion kpi dashboard to monitor diagrams pdf. Use them to share invaluable insights on kpi dashboard to monitor sales opportunities and impress your audience. This template can be altered and modified as per your expectations. So, grab it now.
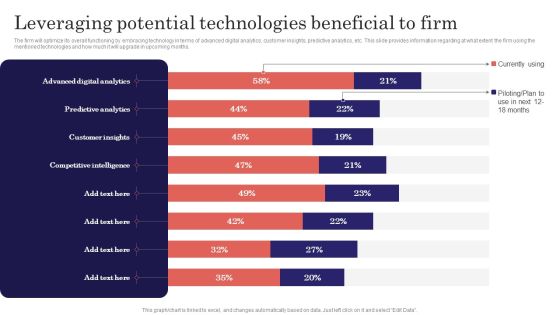
Digitalized Business Checklist Leveraging Potential Technologies Beneficial To Firm Summary PDF
The firm will optimize its overall functioning by embracing technology in terms of advanced digital analytics, customer insights, predictive analytics, etc. This slide provides information regarding at what extent the firm using the mentioned technologies and how much it will upgrade in upcoming months. The best PPT templates are a great way to save time, energy, and resources. Slidegeeks have 100 percent editable powerpoint slides making them incredibly versatile. With these quality presentation templates, you can create a captivating and memorable presentation by combining visually appealing slides and effectively communicating your message. Download Digitalized Business Checklist Leveraging Potential Technologies Beneficial To Firm Summary PDF from Slidegeeks and deliver a wonderful presentation.

KPI Metrics Dashboard Highlighting Employee Retention Rate Developing Employee Retention Techniques Sample PDF
The purpose of this slide is to exhibit a key performance indicator KPI dashboard through which managers can analyze the monthly employee retention rate. The metrics covered in the slide are active employees, new candidates hired, internal, exit, employee turnover rate, etc.Do you have to make sure that everyone on your team knows about any specific topic I yes, then you should give KPI Metrics Dashboard Highlighting Employee Retention Rate Developing Employee Retention Techniques Sample PDF a try. Our experts have put a lot of knowledge and effort into creating this impeccable KPI Metrics Dashboard Highlighting Employee Retention Rate Developing Employee Retention Techniques Sample PDF. You can use this template for your upcoming presentations, as the slides are perfect to represent even the tiniest detail. You can download these templates from the Slidegeeks website and these are easy to edit. So grab these today.

Service Improvement Techniques For Client Retention Customer Service Dashboard To Monitor Kpis Clipart PDF
This slide showcases support service dashboard to track relevant performance metrics. Major KPIs covered are customer satisfaction, average time to resolve problem, cost per support, customer retention, request volume, etc. Do you have an important presentation coming up. Are you looking for something that will make your presentation stand out from the rest. Look no further than Service Improvement Techniques For Client Retention Customer Service Dashboard To Monitor Kpis Clipart PDF. With our professional designs, you can trust that your presentation will pop and make delivering it a smooth process. And with Slidegeeks, you can trust that your presentation will be unique and memorable. So why wait. Grab Service Improvement Techniques For Client Retention Customer Service Dashboard To Monitor Kpis Clipart PDF today and make your presentation stand out from the rest.
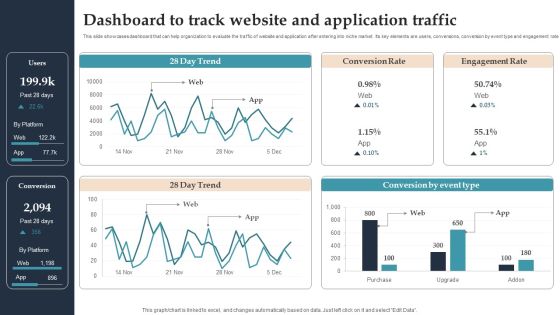
Product Rollout Techniques Dashboard To Track Website And Application Traffic Mockup PDF
This slide showcases dashboard that can help organization to evaluate the traffic of website and application after entering into niche market. Its key elements are users, conversions, conversion by event type and engagement rate. Crafting an eye-catching presentation has never been more straightforward. Let your presentation shine with this tasteful yet straightforward Product Rollout Techniques Dashboard To Track Website And Application Traffic Mockup PDF template. It offers a minimalistic and classy look that is great for making a statement. The colors have been employed intelligently to add a bit of playfulness while still remaining professional. Construct the ideal Product Rollout Techniques Dashboard To Track Website And Application Traffic Mockup PDF that effortlessly grabs the attention of your audience Begin now and be certain to wow your customers.

Deploying B2B Advertising Techniques For Lead Generation Digital Marketing Dashboard Improve Performance Inspiration PDF
This slide covers digital marketing dashboard to improve performance visibility and sales. It involves details such as total number of sessions, bounce rate, goal completions and major channels over time. Crafting an eye catching presentation has never been more straightforward. Let your presentation shine with this tasteful yet straightforward Deploying B2B Advertising Techniques For Lead Generation Digital Marketing Dashboard Improve Performance Inspiration PDF template. It offers a minimalistic and classy look that is great for making a statement. The colors have been employed intelligently to add a bit of playfulness while still remaining professional. Construct the ideal Deploying B2B Advertising Techniques For Lead Generation Digital Marketing Dashboard Improve Performance Inspiration PDF that effortlessly grabs the attention of your audience. Begin now and be certain to wow your customers.
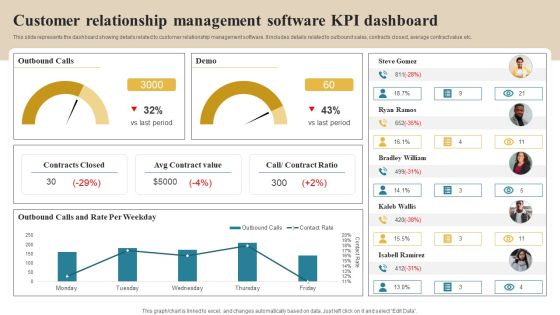
Software Implementation Technique Customer Relationship Management Software KPI Dashboard Designs PDF
This slide represents the dashboard showing details related to customer relationship management software. It includes details related to outbound sales, contracts closed, average contract value etc. Get a simple yet stunning designed Software Implementation Technique Customer Relationship Management Software KPI Dashboard Designs PDF. It is the best one to establish the tone in your meetings. It is an excellent way to make your presentations highly effective. So, download this PPT today from Slidegeeks and see the positive impacts. Our easy to edit Software Implementation Technique Customer Relationship Management Software KPI Dashboard Designs PDF can be your go to option for all upcoming conferences and meetings. So, what are you waiting for Grab this template today.

Social Media Audit Chart With Post Details Ppt PowerPoint Presentation Gallery Graphics Pictures PDF
Showcasing this set of slides titled social media audit chart with post details ppt powerpoint presentation gallery graphics pictures pdf. The topics addressed in these templates are performance snapshot, findings, product. All the content presented in this PPT design is completely editable. Download it and make adjustments in color, background, font etc. as per your unique business setting.
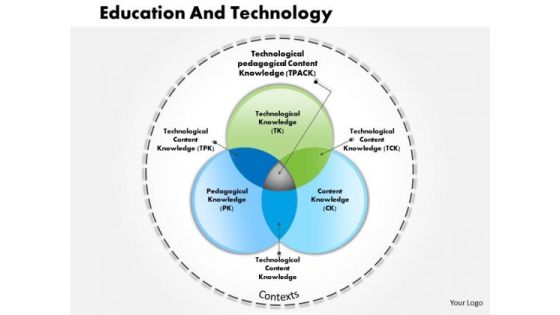
Business Framework Education And Technology PowerPoint Presentation
This image slide displays TPACK (Technological Pedagogical And Content Knowledge) diagram. The framework describes the knowledge teachers need to have to effective integrate technology into their education. The knowledge domains in the framework are: content knowledge (CK), pedagogical knowledge (PK) and technological knowledge (TK). Use this image slide to enhance the quality of your presentations.

Business Opportunity Assessment Dashboard With Various Ppt PowerPoint Presentation Professional Graphics Download PDF
Pitch your topic with ease and precision using this business opportunity assessment dashboard with various ppt powerpoint presentation professional graphics download pdf. This layout presents information on opportunity size, individual opportunity count by sales stages, opportunity count by region, opportunity count by sales stage. It is also available for immediate download and adjustment. So, changes can be made in the color, design, graphics or any other component to create a unique layout.

Online Marketing Dashboard Showing Key Conversion Metrics Ppt PowerPoint Presentation Outline Example Topics PDF
Pitch your topic with ease and precision using this online marketing dashboard showing key conversion metrics ppt powerpoint presentation outline example topics pdf. This layout presents information on lead breakdown, leads, web user, top social media channels, key conversion metrics, trial leads by region. It is also available for immediate download and adjustment. So, changes can be made in the color, design, graphics or any other component to create a unique layout.

Dashboard For Analyzing Assets And Portfolio Performance Ppt PowerPoint Presentation Summary Slide PDF
Pitch your topic with ease and precision using this dashboard for analyzing assets and portfolio performance ppt powerpoint presentation summary slide pdf. This layout presents information on asset management by manager, top 10 clients by assets, top 10 assets owned, portfolio performance. It is also available for immediate download and adjustment. So, changes can be made in the color, design, graphics or any other component to create a unique layout.

Clinical Risk Assessment Dashboard For Improving Quality And Safety In Healthcare Brochure PDF
This slide illustrates key initiatives taken by HR department for resolving global team conflicts. Pitch your topic with ease and precision using this Clinical Risk Assessment Dashboard For Improving Quality And Safety In Healthcare Brochure PDF This layout presents information on Ward Administration, Patient Experience, Risk Assessment It is also available for immediate download and adjustment. So, changes can be made in the color, design, graphics or any other component to create a unique layout.

Degree Of Operational Leverage Dashboard With Income Statement Ppt Infographics Layout PDF
This slide illustrates graphical representation of company revenue and income statement. It includes monthly revenue, revenue by products, revenue by country etc. Pitch your topic with ease and precision using this Degree Of Operational Leverage Dashboard With Income Statement Ppt Infographics Layout PDF. This layout presents information on Monthly Revenue, Income Statement, Product. It is also available for immediate download and adjustment. So, changes can be made in the color, design, graphics or any other component to create a unique layout.

Vendor Management To Handle Purchase Vendor Procurement Cycle And Expenses Management Dashboard Topics PDF
The following slide illustrates supplier performance management program. It provides information about goals, evaluation criteria, conditions, potential outcomes, innovation, value, quality, management, cost, schedule, rating, etc.Deliver and pitch your topic in the best possible manner with this Vendor Management To Handle Purchase Vendor Procurement Cycle And Expenses Management Dashboard Topics PDF. Use them to share invaluable insights on Procurement Cycle, Total Spending, Contracted and impress your audience. This template can be altered and modified as per your expectations. So, grab it now.
