Data Analysis Icon

Business Activities Three Months Roadmap Information
Presenting our jaw dropping business activities three months roadmap information. You can alternate the color, font size, font type, and shapes of this PPT layout according to your strategic process. This PPT presentation is compatible with Google Slides and is available in both standard screen and widescreen aspect ratios. You can also download this well researched PowerPoint template design in different formats like PDF, JPG, and PNG. So utilize this visually appealing design by clicking the download button given below.

Dashboard For Email And Web Performance Ppt PowerPoint Presentation Infographics Visual Aids PDF
Presenting this set of slides with name dashboard for email and web performance ppt powerpoint presentation infographics visual aids pdf. The topics discussed in these slides are email list growth, list performance, email and web performance. This is a completely editable PowerPoint presentation and is available for immediate download. Download now and impress your audience.
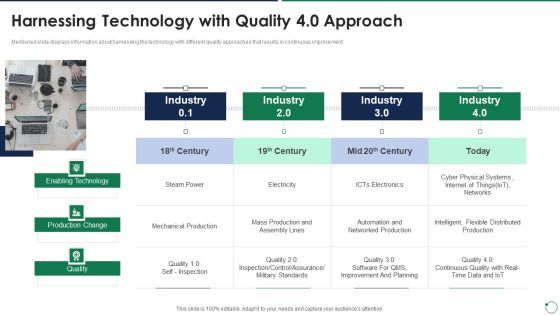
Quality Assurance Templates Set 3 Harnessing Technology With Quality 4 0 Approach Diagrams PDF
Mentioned slide displays information about harnessing the technology with different quality approaches that results in continuous improvement. Presenting quality assurance templates set 3 harnessing technology with quality 4 0 approach diagrams pdf to provide visual cues and insights. Share and navigate important information on three stages that need your due attention. This template can be used to pitch topics like enabling technology, production change, quality. In addtion, this PPT design contains high resolution images, graphics, etc, that are easily editable and available for immediate download.

Summary Of Cloud ERP System Framework ERP System Framework Dashboard With Total Visits And Bounce Rate Themes PDF
Deliver and pitch your topic in the best possible manner with this Summary Of Cloud ERP System Framework ERP System Framework Dashboard With Total Visits And Bounce Rate Themes PDF Use them to share invaluable insights on ERP System Framework Dashboard With Total Visits And Bounce Rate and impress your audience. This template can be altered and modified as per your expectations. So, grab it now.

Software Designing And Development Software Application Develop Phase Milestone Information PDF
This template covers software application environment development milestone. It also includes instructions or guidelines for setting up development and testing environments.This modern and well-arranged Software Designing And Development Software Application Develop Phase Milestone Information PDF provides lots of creative possibilities. It is very simple to customize and edit with the Powerpoint Software. Just drag and drop your pictures into the shapes. All facets of this template can be edited with Powerpoint no extra software is necessary. Add your own material, put your images in the places assigned for them, adjust the colors, and then you can show your slides to the world, with an animated slide included.

Investment Crowdfunding Dashboard With Capital Raising Pitch Status Sample PDF
The following slide exhibits equity crowdfunding dashboard which can be used by business startups to check their capital raising pitch status. It includes information about investment, inventors, opportunities, live, valuation, target, raised, time left, etc.Presenting Investment Crowdfunding Dashboard With Capital Raising Pitch Status Sample PDF to dispense important information. This template comprises three stages. It also presents valuable insights into the topics including Total Investments, Total Investors, Current Opportunities. This is a completely customizable PowerPoint theme that can be put to use immediately. So, download it and address the topic impactfully.
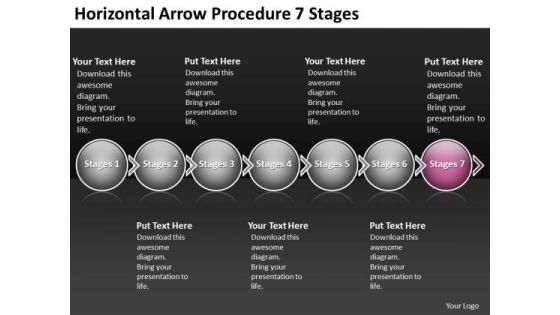
Horizontal Arrow Procedure 7 Stages Flow Chart Program PowerPoint Templates
We present our horizontal arrow procedure 7 stages flow chart program PowerPoint templates. Use our Leadership PowerPoint Templates because, Timelines Display: - You have developed a vision of where you want to be a few years from now. Use our Arrows PowerPoint Templates because; transmit your passion via our creative templates. Use our Circle Charts PowerPoint Templates because; have fired the dreams of many fertile minds. Use our Process and Flows PowerPoint Templates because, they help to lay the base of your trend of thought. Use our Shapes PowerPoint Templates because; Give them an overview of your capability and insight into the minute details of the overall picture highlighting the interdependence at every operational level. Use these PowerPoint slides for presentations relating to Arrow, business, circle, circular, collection, connection, cursor, decoration, design, dimensional, direction, element, icon, illustration, information, modern, motion, perspective, pointing, process, recycle, recycling, reflective, shape, shiny, sign, symbol, technology. The prominent colors used in the PowerPoint template are Purple, Gray, and White

Software Interoperability Examination IT Act Phase Of PDCA Cycle Ppt File Designs PDF
This slide depicts the final phase of the PDCA cycle in which best practices are implemented also determines the ways to enhance the areas that can be improved. Presenting software interoperability examination it act phase of pdca cycle ppt file designs pdf to provide visual cues and insights. Share and navigate important information on five stages that need your due attention. This template can be used to pitch topics like determine, implement. In addtion, this PPT design contains high resolution images, graphics, etc, that are easily editable and available for immediate download.
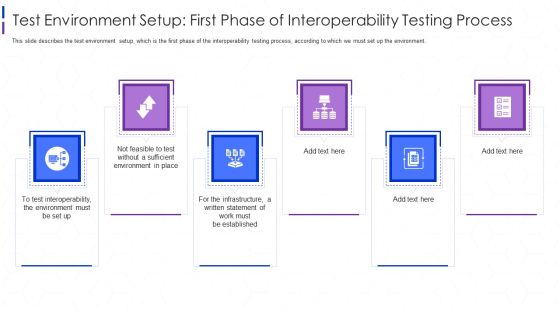
Software Interoperability Examination IT Test Environment Setup First Phase Ppt Professional Graphics Template PDF
This slide describes the test environment setup, which is the first phase of the interoperability testing process, according to which we must set up the environment. Presenting software interoperability examination it test environment setup first phase ppt professional graphics template pdf to provide visual cues and insights. Share and navigate important information on six stages that need your due attention. This template can be used to pitch topics like environment, interoperability. In addtion, this PPT design contains high resolution images, graphics, etc, that are easily editable and available for immediate download.
Retail Trading Platform Dashboard Tracking Essential Kpis For Ecommerce Performance Diagrams PDF
This slide provides information regarding essential KPIs for ecommerce performance dashboard tracking average bounce rate, new vs. old customers, channel revenue vs. channel acquisitions costs, channel revenue vs. sales, average conversion rate, etc. Deliver an awe inspiring pitch with this creative retail trading platform dashboard tracking essential kpis for ecommerce performance diagrams pdf bundle. Topics like average bounce rate, average conversion rate, bounce rate, channel revenue sales can be discussed with this completely editable template. It is available for immediate download depending on the needs and requirements of the user.

Insider Threat In Cyber Security Detection And Prevention Dashboard Diagrams PDF
This slide shows dashboard for detecting and preventing insider threats. It provides details about antivirus, vector detection, patch, admin access, email security, network and endpoint threat, etc. Pitch your topic with ease and precision using this Insider Threat In Cyber Security Detection And Prevention Dashboard Diagrams PDF. This layout presents information on Active Clients, Network Threat Prevention, Endpoint Threat Prevention. It is also available for immediate download and adjustment. So, changes can be made in the color, design, graphics or any other component to create a unique layout.
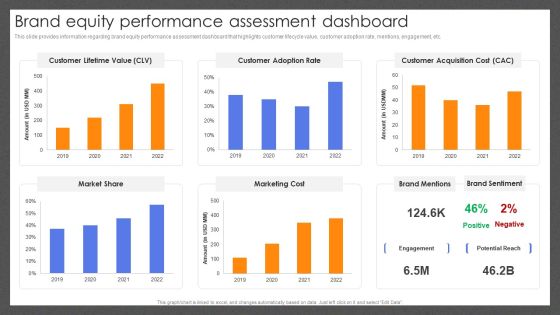
Guide For Effective Brand Brand Equity Performance Assessment Dashboard Diagrams PDF
This slide provides information regarding brand equity performance assessment dashboard that highlights customer lifecycle value, customer adoption rate, mentions, engagement, etc. Present like a pro with Guide For Effective Brand Brand Equity Performance Assessment Dashboard Diagrams PDF Create beautiful presentations together with your team, using our easy-to-use presentation slides. Share your ideas in real-time and make changes on the fly by downloading our templates. So whether youre in the office, on the go, or in a remote location, you can stay in sync with your team and present your ideas with confidence. With Slidegeeks presentation got a whole lot easier. Grab these presentations today.

Monthly Financial Metrics Dashboard With Income Statement Infographics PDF
This following slide displays kpis to communicate key financial information to both internal and external stakeholders. It further includes details such as OPEX ratio, revenue and COGS, income, expenses, etc. Showcasing this set of slides titled Monthly Financial Metrics Dashboard With Income Statement Infographics PDF. The topics addressed in these templates are Gross Profit Margin, Taxes, Revenue. All the content presented in this PPT design is completely editable. Download it and make adjustments in color, background, font etc. as per your unique business setting.
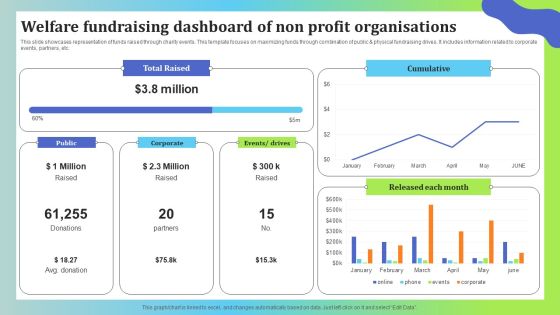
Welfare Fundraising Dashboard Of Non Profit Organisations Graphics PDF
This slide showcases representation of funds raised through charity events. This template focuses on maximizing funds through combination of public and physical fundraising drives. It includes information related to corporate events, partners, etc. Showcasing this set of slides titled Welfare Fundraising Dashboard Of Non Profit Organisations Graphics PDF. The topics addressed in these templates are Total Raised, Cumulative, Each Month. All the content presented in this PPT design is completely editable. Download it and make adjustments in color, background, font etc. as per your unique business setting.
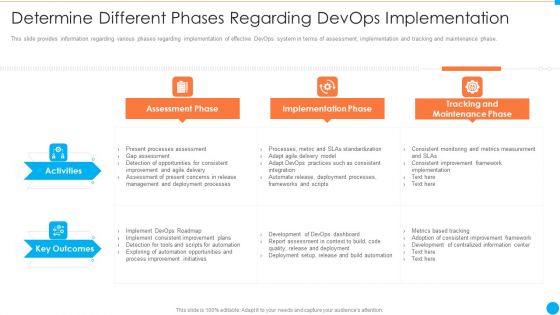
Determine Different Phases Regarding Devops Implementation IT Infrastructure By Executing Devops Approach Rules PDF
This slide provides information regarding various phases regarding implementation of effective DevOps system in terms of assessment, implementation and tracking and maintenance phase. This is a determine different phases regarding devops implementation it infrastructure by executing devops approach rules pdf template with various stages. Focus and dispense information on three stages using this creative set, that comes with editable features. It contains large content boxes to add your information on topics like assessment phase, implementation phase, tracking and maintenance phase. You can also showcase facts, figures, and other relevant content using this PPT layout. Grab it now.

Content Performance Improvement Plan Ppt Powerpoint Presentation Infographic Template Maker
This is a content performance improvement plan ppt powerpoint presentation infographic template maker. The topics discussed in this diagram are content, performance improvement plan, business, management. This is a completely editable PowerPoint presentation, and is available for immediate download.

Improving Buyer Journey Through Strategic Customer Engagement Dashboard To Track Customer Loyalty Program Download PDF
This slide presents the performance of various metrics related to customer engagement through a gamified loyalty program. It includes statistics on various KPIs such as total enrolments, reward points, loyalty rewards, customers and feedback. Crafting an eye-catching presentation has never been more straightforward. Let your presentation shine with this tasteful yet straightforward Improving Buyer Journey Through Strategic Customer Engagement Dashboard To Track Customer Loyalty Program Download PDF template. It offers a minimalistic and classy look that is great for making a statement. The colors have been employed intelligently to add a bit of playfulness while still remaining professional. Construct the ideal Improving Buyer Journey Through Strategic Customer Engagement Dashboard To Track Customer Loyalty Program Download PDF that effortlessly grabs the attention of your audience Begin now and be certain to wow your customers

Business Charts Examples Sitting Small Person And Red Query Mark Concept Idea PowerPoint Templates
We present our business charts examples sitting small person and red query mark concept idea PowerPoint templates.Present our People PowerPoint Templates because You should Bet on your luck with our PowerPoint Templates and Slides. Be assured that you will hit the jackpot. Present our Shapes PowerPoint Templates because You canTake a leap off the starting blocks with our PowerPoint Templates and Slides. They will put you ahead of the competition in quick time. Download and present our Business PowerPoint Templates because Our PowerPoint Templates and Slides will steer your racing mind. Hit the right buttons and spur on your audience. Use our Success PowerPoint Templates because Our PowerPoint Templates and Slides will give good value for money. They also have respect for the value of your time. Download our Marketing PowerPoint Templates because You canTake a leap off the starting blocks with our PowerPoint Templates and Slides. They will put you ahead of the competition in quick time.Use these PowerPoint slides for presentations relating to 3d, answer, ask, broker, choice,communication, confusion, education,faq, figure, find, frequently, guy, help,icon, idea, info, information,interrogation, little, man, mark, mystery,object, operator, person, problem,punctuation, query, quest, question,questionable, questionail, render,request, riddle, search, seller, sign,small, solution, support, symbol, think. The prominent colors used in the PowerPoint template are Green, Red, Black. You can be sure our business charts examples sitting small person and red query mark concept idea PowerPoint templates will generate and maintain the level of interest you desire. They will create the impression you want to imprint on your audience. Use our choice PowerPoint templates and PPT Slides are topically designed to provide an attractive backdrop to any subject. Professionals tell us our business charts examples sitting small person and red query mark concept idea PowerPoint templates look good visually. Customers tell us our communication PowerPoint templates and PPT Slides will help you be quick off the draw. Just enter your specific text and see your points hit home. Customers tell us our business charts examples sitting small person and red query mark concept idea PowerPoint templates will help you be quick off the draw. Just enter your specific text and see your points hit home. Use our choice PowerPoint templates and PPT Slides are second to none.

Agile Development Approach IT Overview Of Extreme Programming Framework Themes PDF
This slide describes the extreme programming framework of agile that includes project requirements, stories, test cases, tasks, completion, customer input, iteration planning meeting, customer testing and acceptance tests. This is a Agile Development Approach IT Overview Of Extreme Programming Framework Themes PDF template with various stages. Focus and dispense information on one stages using this creative set, that comes with editable features. It contains large content boxes to add your information on topics like Automated Unit Testing, Extreme Programming, Project Requirements, Test Cases, Iteration. You can also showcase facts, figures, and other relevant content using this PPT layout. Grab it now.
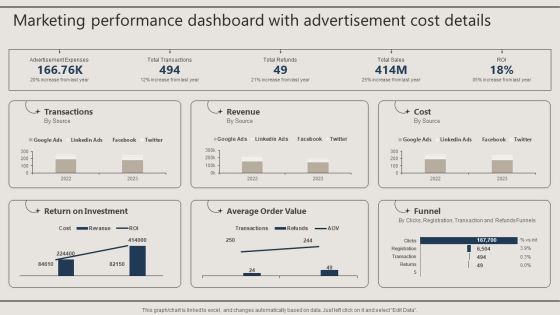
Marketing Performance Dashboard With Advertisement Cost Details Download PDF
Here you can discover an assortment of the finest PowerPoint and Google Slides templates. With these templates, you can create presentations for a variety of purposes while simultaneously providing your audience with an eye catching visual experience. Download Marketing Performance Dashboard With Advertisement Cost Details Download PDF to deliver an impeccable presentation. These templates will make your job of preparing presentations much quicker, yet still, maintain a high level of quality. Slidegeeks has experienced researchers who prepare these templates and write high quality content for you. Later on, you can personalize the content by editing the Marketing Performance Dashboard With Advertisement Cost Details Download PDF.
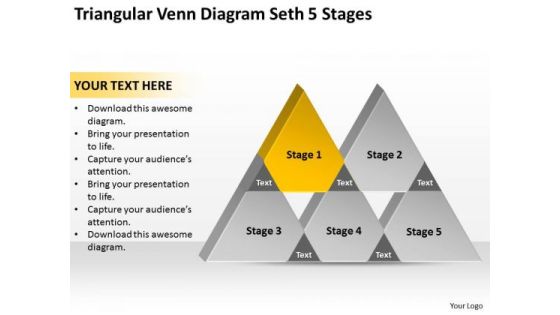
Triangular Venn Diagram Seth 5 Stages Ppt Retail Business Plan PowerPoint Templates
We present our triangular venn diagram seth 5 stages ppt retail business plan PowerPoint templates.Download our Arrows PowerPoint Templates because Our PowerPoint Templates and Slides will help you be quick off the draw. Just enter your specific text and see your points hit home. Use our Business PowerPoint Templates because Our PowerPoint Templates and Slides will give good value for money. They also have respect for the value of your time. Download and present our Process and Flows PowerPoint Templates because Our PowerPoint Templates and Slides will Activate the energies of your audience. Get their creative juices flowing with your words. Present our Flow Charts PowerPoint Templates because It will let you Set new benchmarks with our PowerPoint Templates and Slides. They will keep your prospects well above par. Download and present our Marketing PowerPoint Templates because Our PowerPoint Templates and Slides will give you great value for your money. Be assured of finding the best projection to highlight your words. Use these PowerPoint slides for presentations relating to pyramid, chart, diagram, graphic, set, isolated, isometric, perspective, step,symbol, process, shape, illustration, icon,portfolio,symbol, element, card, simple, idea, emblem, creative, illustration, options, instruction, web, direction, design, choice,infographic, banner, art, style, menu, background, advertising, promotion, product, button. The prominent colors used in the PowerPoint template are Yellow, Black, Gray.

Filled Radar Chart Ppt PowerPoint Presentation File Information
This is a filled radar chart ppt powerpoint presentation file information. This is a two stage process. The stages in this process are chart, business, marketing, finance, strategy.
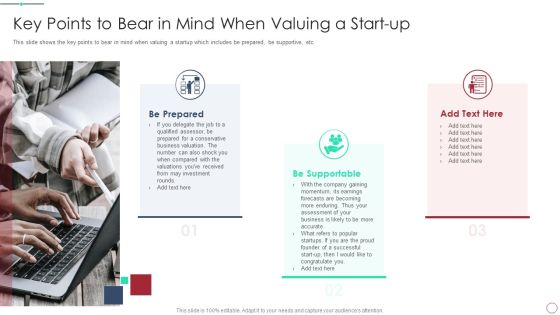
Initial Phase Investor Value For New Business Key Points To Bear In Mind When Valuing A Start Up Designs PDF
This slide shows the key points to bear in mind when valuing a startup which includes be prepared, be supportive, etc. This is a initial phase investor value for new business key points to bear in mind when valuing a start up designs pdf template with various stages. Focus and dispense information on three stages using this creative set, that comes with editable features. It contains large content boxes to add your information on topics like qualified, assessor, conservative, business. You can also showcase facts, figures, and other relevant content using this PPT layout. Grab it now.
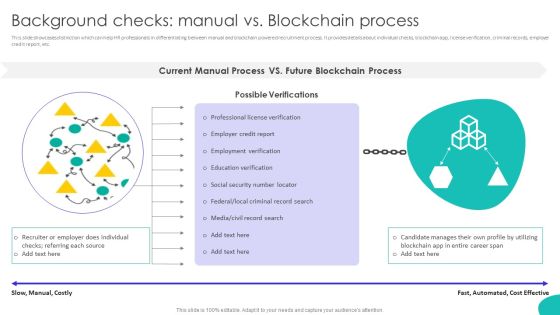
Improving Technology Based Background Checks Manual Vs Blockchain Process Information PDF
This slide showcases distinction which can help HR professionals in differentiating between manual and blockchain powered recruitment process. It provides details about individual checks, blockchain app, license verification, criminal records, employer credit report, etc. Slidegeeks is one of the best resources for PowerPoint templates. You can download easily and regulate Improving Technology Based Background Checks Manual Vs Blockchain Process Information PDF for your personal presentations from our wonderful collection. A few clicks is all it takes to discover and get the most relevant and appropriate templates. Use our Templates to add a unique zing and appeal to your presentation and meetings. All the slides are easy to edit and you can use them even for advertisement purposes.
Stacked List Process Diagram 8 Stages Ppt Strategic Business Planning PowerPoint Templates
We present our stacked list process diagram 8 stages ppt strategic business planning PowerPoint templates.Use our Triangles PowerPoint Templates because It can be used to Set your controls for the heart of the sun. Our PowerPoint Templates and Slides will be the propellant to get you there. Present our Layers PowerPoint Templates because Our PowerPoint Templates and Slides will provide you a launch platform. Give a lift off to your ideas and send them into orbit. Download and present our Shapes PowerPoint Templates because Our PowerPoint Templates and Slides will provide you a launch platform. Give a lift off to your ideas and send them into orbit. Download our Business PowerPoint Templates because Our PowerPoint Templates and Slides will give you great value for your money. Be assured of finding the best projection to highlight your words. Download and present our Signs PowerPoint Templates because Our PowerPoint Templates and Slides are effectively colour coded to prioritise your plans They automatically highlight the sequence of events you desire.Use these PowerPoint slides for presentations relating to stacked, stack, step, triangle, red, business, geometrical, concept, vector, sign, render, hierarchy, success, spectrum, presentation, glossy, bright, symbol, diagram, layered, graphic, element, multicolor, level, layer, top, shape, abstract, union, graph, modern, creative, illustration, icon, geometric, figure, stage, system, shiny, web, design, group, color, colorful, pyramid, progress, conceptual, construction, structure, 3d. The prominent colors used in the PowerPoint template are Blue, Gray, Black.

Average Sales Compensation And Salary Dashboard Introduction PDF
The following slide showcases compensation administration dashboard highlighting sales compensation. The dashboard further includes average monthly compensation per employee. Pitch your topic with ease and precision using this Average Sales Compensation And Salary Dashboard Introduction PDF. This layout presents information on Salary Dashboard, Average Sales Compensation. It is also available for immediate download and adjustment. So, changes can be made in the color, design, graphics or any other component to create a unique layout.

Dashboard To Manage Marketing Campaigns Of Multiple Brands Ppt PowerPoint Presentation Diagram PDF
This slide showcases dashboard that can help organization to manage the marketing campaigns in multi brand strategy. Its key elements are lead breakdown, total leads, key conversion metrics etc. Coming up with a presentation necessitates that the majority of the effort goes into the content and the message you intend to convey. The visuals of a PowerPoint presentation can only be effective if it supplements and supports the story that is being told. Keeping this in mind our experts created Dashboard To Manage Marketing Campaigns Of Multiple Brands Ppt PowerPoint Presentation Diagram PDF to reduce the time that goes into designing the presentation. This way, you can concentrate on the message while our designers take care of providing you with the right template for the situation.

Our Management Team Facebook Business Outline Information PDF
This slide showcases the management team which includes chairman, chief operating officer, financial officer, product officer, diversity officer, technology officer, head of global affairs, etc. Presenting Our Management Team Facebook Business Outline Information PDF to provide visual cues and insights. Share and navigate important information on three stages that need your due attention. This template can be used to pitch topics like Chief Technology Officer, Chief Operating Officer, Chief Financial Officer. In addtion, this PPT design contains high resolution images, graphics, etc, that are easily editable and available for immediate download.

Stock Photo Cloud Text With Colorful Design PowerPoint Slide
This power point image template has been designed with graphic of cloud text with colorful design. This PPT contains the concept of cloud technology. Use this image template for your cloud technology and business related presentations.

Vicious Circle Effect On Quality Assurance Venn Ppt Inspiration Visual Aids PDF
This is a vicious circle effect on quality assurance venn ppt inspiration visual aids pdf template with various stages. Focus and dispense information on four stages using this creative set, that comes with editable features. It contains large content boxes to add your information on topics like venn. You can also showcase facts, figures, and other relevant content using this PPT layout. Grab it now.
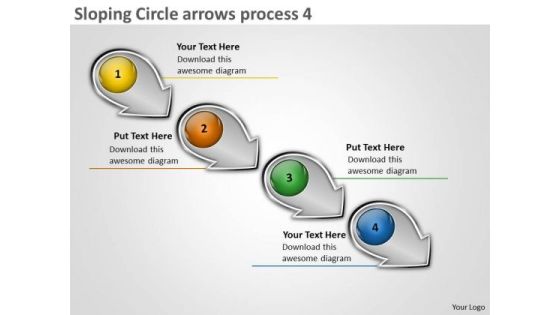
Sloping Circle Arrows Process 4 Production Flow Charts PowerPoint Templates
We present our sloping circle arrows process 4 production flow charts PowerPoint templates. Use our Arrows PowerPoint Templates because, Its also been said that prevention is better than cure, either way you have a store of knowledge for sure. Use our Spheres PowerPoint Templates because, and watch them strengthen your companys sinews. Use our Symbol PowerPoint Templates because, Sales Template:- Generation of sales is the core of any business. Use our Marketing PowerPoint Templates because, Business Process Design:- The template offers an excellent background to build up the various stages of your business process. Use our Process and Flows PowerPoint Templates because, Ideas roll along in your mind like billiard balls. Use these PowerPoint slides for presentations relating to Arrow, Business, Circle, Circular, Collection, Connection, Cursor, Decoration, Design, Dimensional, Direction, Element, Icon, Illustration, Information, Modern, Motion, Paper, Perspective, Plastic, Pointer, Pointing, Process, Recycle, Recycling, Reflective, Set, Shape, Shiny, Sign, Symbol, Technology. The prominent colors used in the PowerPoint template are Yellow, Orange, and Green

KPI Dashboard Highlighting Off Page Seo Performance Rules PDF
The purpose of this template is to outline KPI reporting dashboard showing results of off page SEO. The dashboard covers key metrics such as website ranking on search engine, traffic, sessions, backlinks and site audit. Showcasing this set of slides titled kpi dashboard highlighting off page seo performance rules pdf. The topics addressed in these templates are kpi dashboard highlighting off page seo performance. All the content presented in this PPT design is completely editable. Download it and make adjustments in color, background, font etc. as per your unique business setting.

Network Service Assessment Monitoring Dashboard With Throughput Time Structure PDF
Mentioned slide outlines a KPI dashboard which can be used to monitor network performance. The kpis highlighted in the dashboard are call setup time, packet loss, throughput time, round trip time etc. Showcasing this set of slides titled Network Service Assessment Monitoring Dashboard With Throughput Time Structure PDF. The topics addressed in these templates are Network Service Assessment Monitoring Dashboard With Throughput Time. All the content presented in this PPT design is completely editable. Download it and make adjustments in color, background, font etc. as per your unique business setting.

Average Employee Compensation And Salary Dashboard Download PDF
The following slide showcases workforce compensation management dashboard to keep a track of benefits provided to employees. The dashboard includes employee count by salary range, workforce details and count by rating. Showcasing this set of slides titled Average Employee Compensation And Salary Dashboard Download PDF. The topics addressed in these templates are Average Employee Compensation, Salary Dashboard. All the content presented in this PPT design is completely editable. Download it and make adjustments in color, background, font etc. as per your unique business setting.

Employee Payroll Compensation And Salary Dashboard With Expenses Professional PDF
The following slide showcases payroll and compensation dashboard to assist HR team analyze and track important KPIs. The dashboard depicts expenses , items processed and compensation comparison. Showcasing this set of slides titled Employee Payroll Compensation And Salary Dashboard With Expenses Professional PDF. The topics addressed in these templates are Employee Payroll Compensation, Salary Dashboard With Expenses. All the content presented in this PPT design is completely editable. Download it and make adjustments in color, background, font etc. as per your unique business setting.

Payroll Administration Software Dashboard To Monitor Employee Performance Summary PDF
This slide represents the dashboard for payroll management of employees to track their performance and take actions to improve them. This dashboard is depicting the employee performance impact in different departments and the salary is paid to employees along with their deductions. Showcasing this set of slides titled Payroll Administration Software Dashboard To Monitor Employee Performance Summary PDF. The topics addressed in these templates are Payroll Administration Software Dashboard, Monitor Employee Performance. All the content presented in this PPT design is completely editable. Download it and make adjustments in color, background, font etc. as per your unique business setting.
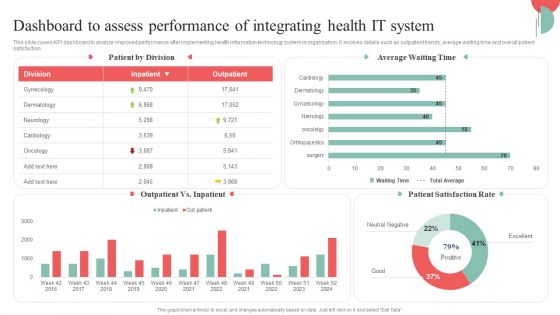
Incorporating HIS To Enhance Healthcare Services Dashboard To Assess Performance Of Integrating Health IT System Diagrams PDF
This slide covers KPI dashboard to analyze improved performance after implementing health information technology system in organization. It involves details such as outpatient trends, average waiting time and overall patient satisfaction. Create an editable Incorporating HIS To Enhance Healthcare Services Dashboard To Assess Performance Of Integrating Health IT System Diagrams PDF that communicates your idea and engages your audience. Whether youre presenting a business or an educational presentation, pre designed presentation templates help save time. Incorporating HIS To Enhance Healthcare Services Dashboard To Assess Performance Of Integrating Health IT System Diagrams PDF is highly customizable and very easy to edit, covering many different styles from creative to business presentations. Slidegeeks has creative team members who have crafted amazing templates. So, go and get them without any delay.

Brand Personality Improvement To Increase Profits Brand Equity Performance Assessment Dashboard Diagrams PDF
This slide provides information regarding brand equity performance assessment dashboard that highlights customer lifecycle value, customer adoption rate, mentions, engagement, etc. Do you have to make sure that everyone on your team knows about any specific topic I yes, then you should give Brand Personality Improvement To Increase Profits Brand Equity Performance Assessment Dashboard Diagrams PDF a try. Our experts have put a lot of knowledge and effort into creating this impeccable Brand Personality Improvement To Increase Profits Brand Equity Performance Assessment Dashboard Diagrams PDF. You can use this template for your upcoming presentations, as the slides are perfect to represent even the tiniest detail. You can download these templates from the Slidegeeks website and these are easy to edit. So grab these today.
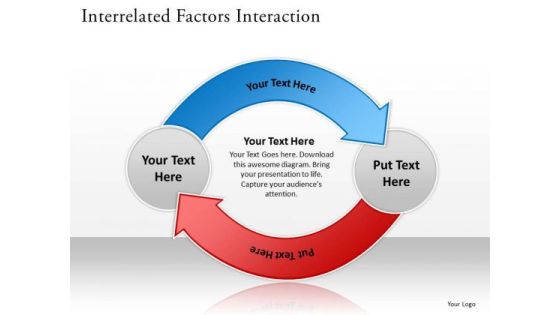
Interaction Ppt Slides Diagrams Templates PowerPoint 2007 Cycle Process
We present our interaction ppt slides diagrams templates powerpoint 2007 Cycle Process.Use our Arrows PowerPoint Templates because it illustrates the symbols of human growth. Present our Business PowerPoint Templates because your fledgling career is in the chrysallis stage. Nurture it and watch it grow into a beautiful butterfly. Present our Circle Charts PowerPoint Templates because this slide demonstrates how they contribute to the larger melting pot. Download and present our Signs PowerPoint Templates because getting it done may not be enough. Download our Shapes PowerPoint Templates because this unique template give you an enthusiastic response and a purposeful Aye- Aye Sir.Use these PowerPoint slides for presentations relating to Adjustment, Arrangement, Bank, Base, Buckle, Clipping, Collaboration, Communication, Complex, Computer, Computer Science, Cropped, Curl, Cycle, Cyclical, Databank, Database, Descriptive, Dynamic, Exchange, Flow, Harmonization, Icon, Interaction, Interactive, Internet, Intricate, Isolated, Maintenance, Migration, Network, Perpetual, Procedure, Rapport, Refresh, Reliance, Repeat, Rotation, Safeguard, Save, Shift, Structured, Synchronization, Technical, Technology. The prominent colors used in the PowerPoint template are Blue, Gray, Red. We assure you our interaction ppt slides diagrams templates powerpoint 2007 Cycle Process are Precious. Customers tell us our Clipping PowerPoint templates and PPT Slides are Bright. The feedback we get is that our interaction ppt slides diagrams templates powerpoint 2007 Cycle Process are Perfect. We assure you our Communication PowerPoint templates and PPT Slides are Fabulous. People tell us our interaction ppt slides diagrams templates powerpoint 2007 Cycle Process are Swanky. We assure you our Buckle PowerPoint templates and PPT Slides effectively help you save your valuable time.

Financial Kpi Dashboard To Evaluate Fundraising Impact Developing Fundraising Techniques Diagrams PDF
This slide showcases dashboard that can help organization to evaluate key changes in financial KPIs post fundraising. Its key components are net profit margin, revenue, gross profit margin, debt to equity and return on equity. From laying roadmaps to briefing everything in detail, our templates are perfect for you. You can set the stage with your presentation slides. All you have to do is download these easy-to-edit and customizable templates. Financial Kpi Dashboard To Evaluate Fundraising Impact Developing Fundraising Techniques Diagrams PDF will help you deliver an outstanding performance that everyone would remember and praise you for. Do download this presentation today.

Marketing Analytics Dashboard With Conversion Rate Summary PDF
The purpose of this slide is to outline marketing analytics dashboard. The dashboard provides information about key metrices such as total impressions, clicks, cost, conversion value, rate, ROAS, market share by different ad platforms etc. Pitch your topic with ease and precision using this Marketing Analytics Dashboard With Conversion Rate Summary PDF. This layout presents information on Marketing Analytics Dashboard With Conversion Rate. It is also available for immediate download and adjustment. So, changes can be made in the color, design, graphics or any other component to create a unique layout.
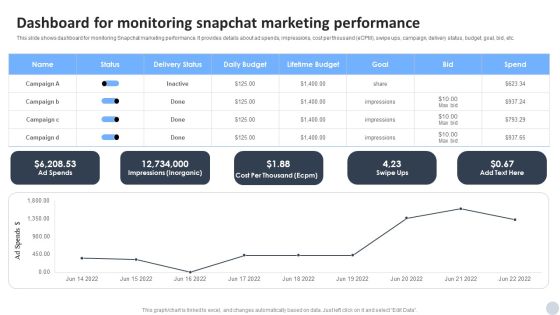
Social Media Marketing Strategies To Generate Lead Dashboard For Monitoring Snapchat Marketing Performance Infographics PDF
This slide shows dashboard for monitoring Snapchat marketing performance. It provides details about ad spends, impressions, cost per thousand eCPM, swipe ups, campaign, delivery status, budget, goal, bid, etc. Create an editable Social Media Marketing Strategies To Generate Lead Dashboard For Monitoring Snapchat Marketing Performance Infographics PDF that communicates your idea and engages your audience. Whether you are presenting a business or an educational presentation, pre designed presentation templates help save time. Social Media Marketing Strategies To Generate Lead Dashboard For Monitoring Snapchat Marketing Performance Infographics PDF is highly customizable and very easy to edit, covering many different styles from creative to business presentations. Slidegeeks has creative team members who have crafted amazing templates. So, go and get them without any delay.

Dashboard Ppt Pictures Example PDF
Deliver an awe inspiring pitch with this creative dashboard ppt pictures example pdf bundle. Topics like dashboard can be discussed with this completely editable template. It is available for immediate download depending on the needs and requirements of the user.

Artificial Intelligence Transformation Playbook Kpi Dashboard For Tracking Business Performance Designs PDF
Mentioned slide portrays KPI dashboard that can be used by organizations to measure their business performance post AI introduction. KPIS covered here are progress, Before versus After AI Implementation, risks and issues. Deliver an awe inspiring pitch with this creative artificial intelligence transformation playbook kpi dashboard for tracking business performance designs pdf bundle. Topics like risk and issues, progress, performance kpis, before versus after all implementation can be discussed with this completely editable template. It is available for immediate download depending on the needs and requirements of the user.

AI Playbook For Business KPI Dashboard For Tracking Business Performance Demonstration PDF
Mentioned slide portrays KPI dashboard that can be used by organizations to measure their business performance post AI introduction. KPIS covered here are progress, before versus after AI implementation, risks and issues. Deliver and pitch your topic in the best possible manner with this AI Playbook For Business KPI Dashboard For Tracking Business Performance Demonstration PDF. Use them to share invaluable insights on Performance KPIs, Progress, Risk And Issues and impress your audience. This template can be altered and modified as per your expectations. So, grab it now.

Responsible Technology Playbook Key Phases Involved In Consequence Scanning Ideas PDF
This slide provides information regarding consequence scanning recommendation structure segregation into two phases ideation and action. Ideation phase includes introduction, quiet time while action phase includes action sorting, dot voting, discussion, etc. Do you have an important presentation coming up Are you looking for something that will make your presentation stand out from the rest Look no further than Responsible Technology Playbook Key Phases Involved In Consequence Scanning Ideas PDF. With our professional designs, you can trust that your presentation will pop and make delivering it a smooth process. And with Slidegeeks, you can trust that your presentation will be unique and memorable. So why wait Grab Responsible Technology Playbook Key Phases Involved In Consequence Scanning Ideas PDF today and make your presentation stand out from the rest.

Investor Pitch Deck To Generate Capital From Pre Seed Round Target Audience Segmentation Diagrams PDF
The slide provides the details about the target customers of the company by geography country, area, climate, demography age, gender, nationality etc. and income group high, upper middle, lower middle. Presenting investor pitch deck to generate capital from pre seed round target audience segmentation diagrams pdf to provide visual cues and insights. Share and navigate important information on three stages that need your due attention. This template can be used to pitch topics like demographic, income group, geographic. In addtion, this PPT design contains high resolution images, graphics, etc, that are easily editable and available for immediate download.

Digital Products And Services Change Management Ppt Slides Diagrams PDF
This is a digital products and services change management ppt slides diagrams pdf template with various stages. Focus and dispense information on eight stages using this creative set, that comes with editable features. It contains large content boxes to add your information on topics like build a plan, management, business, communicate through phases. You can also showcase facts, figures, and other relevant content using this PPT layout. Grab it now.

Dashboard Showing Effective Management Of Sales Pipeline Rules PDF
This slide shows the process steps followed by the company for the recruitment of new employees. It stars from Identifying the hiring needs and ends with employment offer. Deliver an awe inspiring pitch with this creative Dashboard Showing Effective Management Of Sales Pipeline Rules PDF bundle. Topics like Dashboard Showing Effective Management Of Sales Pipeline can be discussed with this completely editable template. It is available for immediate download depending on the needs and requirements of the user.
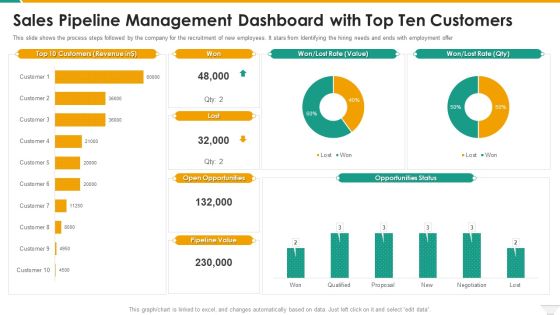
Sales Pipeline Management Dashboard With Top Ten Customers Microsoft PDF
This slide shows the process steps followed by the company for the recruitment of new employees. It stars from Identifying the hiring needs and ends with employment offer. Deliver an awe inspiring pitch with this creative Sales Pipeline Management Dashboard With Top Ten Customers Microsoft PDF bundle. Topics like Sales Pipeline Management Dashboard With Top Ten Customers can be discussed with this completely editable template. It is available for immediate download depending on the needs and requirements of the user.

Risk Assessment Matrix With Vulnerability And Threat Level Cybersecurity Risk Assessment Themes PDF
This slide showcases assessment matrix to identify risk associated with different class of information assets. It calculates severity of risk on the basis of threat and vulnerability level. Find highly impressive Risk Assessment Matrix With Vulnerability And Threat Level Cybersecurity Risk Assessment Themes PDF on Slidegeeks to deliver a meaningful presentation. You can save an ample amount of time using these presentation templates. No need to worry to prepare everything from scratch because Slidegeeks experts have already done a huge research and work for you. You need to download Risk Assessment Matrix With Vulnerability And Threat Level Cybersecurity Risk Assessment Themes PDF for your upcoming presentation. All the presentation templates are 100 parcent editable and you can change the color and personalize the content accordingly. Download now.
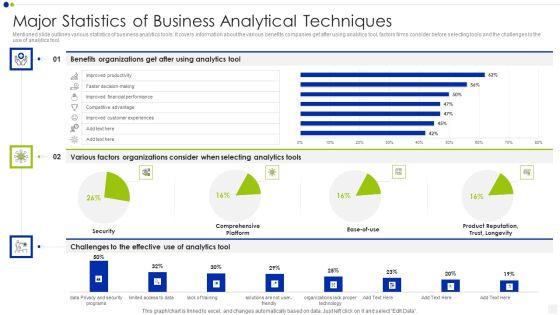
Major Statistics Of Business Analytical Techniques Infographics PDF
Mentioned slide outlines various statistics of business analytics tools. It covers information about the various benefits companies get after using analytics tool, factors firms consider before selecting tools and the challenges to the use of analytics tool. Showcasing this set of slides titled major statistics of business analytical techniques infographics pdf. The topics addressed in these templates are security, analytics, organizations. All the content presented in this PPT design is completely editable. Download it and make adjustments in color, background, font etc. as per your unique business setting.

Shareholder Valuation Dashboard Guidelines PDF
This slide shows the dashboard related to shareholders valuation which includes company valuation details, total dividend growth, etc.Deliver and pitch your topic in the best possible manner with this shareholder valuation dashboard guidelines pdf. Use them to share invaluable insights on shareholder valuation dashboard and impress your audience. This template can be altered and modified as per your expectations. So, grab it now.

Framework For Digital Transformation And Modernization Dashboard For Digital Enablement Template PDF
The purpose of this slide is to provide information regarding the dashboard that will determine digital enablement efforts of the firm in the areas of strategy, customer experience, organizational alignment, people and culture, etc. Create an editable Framework For Digital Transformation And Modernization Dashboard For Digital Enablement Template PDF that communicates your idea and engages your audience. Whether youre presenting a business or an educational presentation, pre designed presentation templates help save time. Framework For Digital Transformation And Modernization Dashboard For Digital Enablement Template PDF is highly customizable and very easy to edit, covering many different styles from creative to business presentations. Slidegeeks has creative team members who have crafted amazing templates. So, go and get them without any delay.
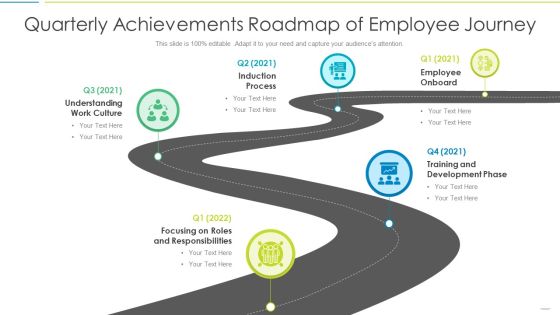
Quarterly Achievements Roadmap Of Employee Journey Designs PDF
Persuade your audience using this quarterly achievements roadmap of employee journey designs pdf. This PPT design covers five stages, thus making it a great tool to use. It also caters to a variety of topics including understanding work culture, induction process, employee onboard, focusing on roles and responsibilities, training and development phase. Download this PPT design now to present a convincing pitch that not only emphasizes the topic but also showcases your presentation skills.

Agile Software Programming Module For Information Technology Most Used Agile Methodologies Download PDF
This slide covers agile most used methodologies to be used by company and scrum approaches. Deliver an awe inspiring pitch with this creative agile software programming module for information technology most used agile methodologies download pdf bundle. Topics like st used agile methodologies and approaches can be discussed with this completely editable template. It is available for immediate download depending on the needs and requirements of the user.

Email Engagement Dashboard Profile Ppt Infographics Images PDF
Email engagement metrics help you understand which email campaigns saw the highest open rate and click-through rate. It also gives you an idea of how different age groups interact with your emails helping you customize the content accordingly. Deliver an awe-inspiring pitch with this creative email engagement dashboard profile ppt infographics images pdf bundle. Topics like email engagement dashboard can be discussed with this completely editable template. It is available for immediate download depending on the needs and requirements of the user.

Company Performance Dashboard With Quarterly Revenue Download PDF
This slide showcases the quarterly organizational performance dashboard. It include campaign performance, acquisitions by campaign and sales performance. Showcasing this set of slides titled company performance dashboard with quarterly revenue download pdf. The topics addressed in these templates are marketing, performance. All the content presented in this PPT design is completely editable. Download it and make adjustments in color, background, font etc. as per your unique business setting.
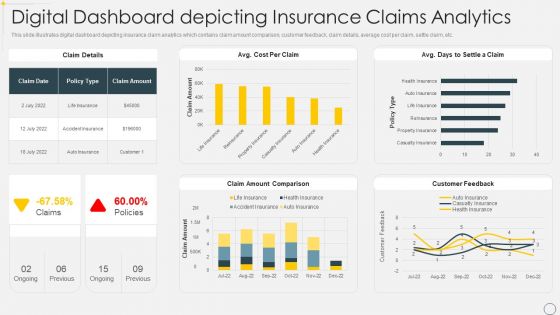
Digital Dashboard Depicting Insurance Claims Analytics Pictures PDF
This slide illustrates digital dashboard depicting insurance claim analytics which contains claim amount comparison, customer feedback, claim details, average cost per claim, settle claim, etc. Showcasing this set of slides titled Digital Dashboard Depicting Insurance Claims Analytics Pictures PDF. The topics addressed in these templates are Policy, Cost, Comparison. All the content presented in this PPT design is completely editable. Download it and make adjustments in color, background, font etc. as per your unique business setting.

Cloud Computing Configuration Performance Management Kpi Dashboard Formats PDF
This slide covers cloud infrastructure performance management dashboard. It involves details such as average response time, application logs, server requests, database, request and error rate.Showcasing this set of slides titled Cloud Computing Configuration Performance Management Kpi Dashboard Formats PDF. The topics addressed in these templates are Database, Application Logs, Average Response Time. All the content presented in this PPT design is completely editable. Download it and make adjustments in color, background, font etc. as per your unique business setting.


 Continue with Email
 Sign up for an account
 Home
Home