Data Analysis Icon

Share Market Dashboard Highlighting Price Moving Average Trend Themes PDF
Following slide outlines stock market dashboard of an industry. The various metrics highlighted in the slide are stock codes, previous day price of stock, percent of price change, maximum and lowest price of stock, moving average trend etc. Pitch your topic with ease and precision using this Share Market Dashboard Highlighting Price Moving Average Trend Themes PDF. This layout presents information on Moving Average, Stock Price, Performing Stocks. It is also available for immediate download and adjustment. So, changes can be made in the color, design, graphics or any other component to create a unique layout.
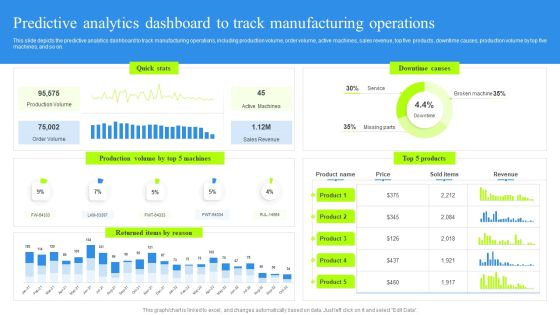
Predictive Analytics Dashboard To Track Manufacturing Operations Rules PDF
This slide depicts the predictive analytics dashboard to track manufacturing operations, including production volume, order volume, active machines, sales revenue, top five products, downtime causes, production volume by top five machines, and so on. Present like a pro with Predictive Analytics Dashboard To Track Manufacturing Operations Rules PDF Create beautiful presentations together with your team, using our easy-to-use presentation slides. Share your ideas in real-time and make changes on the fly by downloading our templates. So whether you are in the office, on the go, or in a remote location, you can stay in sync with your team and present your ideas with confidence. With Slidegeeks presentation got a whole lot easier. Grab these presentations today.
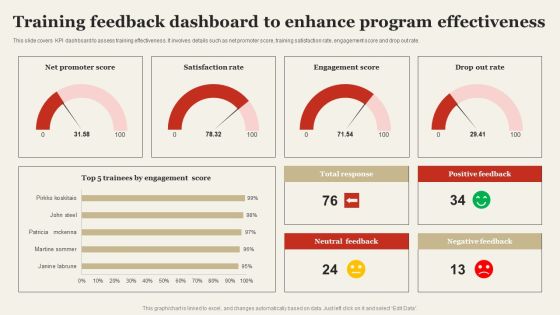
Training Feedback Dashboard To Enhance Program Effectiveness Themes PDF
This slide covers KPI dashboard to assess training effectiveness. It involves details such as net promoter score, training satisfaction rate, engagement score and drop out rate. Coming up with a presentation necessitates that the majority of the effort goes into the content and the message you intend to convey. The visuals of a PowerPoint presentation can only be effective if it supplements and supports the story that is being told. Keeping this in mind our experts created Training Feedback Dashboard To Enhance Program Effectiveness Themes PDF to reduce the time that goes into designing the presentation. This way, you can concentrate on the message while our designers take care of providing you with the right template for the situation.

Leaning Circle Arrow Process 2 Flow Chart Slides PowerPoint
We present our leaning circle arrow process 2 flow chart Slides PowerPoint. Use our Arrows PowerPoint Templates because; amplify your views, ideas and thoughts from very basic aspects to the highly technical and complicated issues using this template as a tool. Use our Spheres PowerPoint Templates because, Goal Pie Chart Template: - You have a clear vision of the cake you want. Use our Symbol PowerPoint Templates because; heighten the anticipation of your audience with this slide listing. Use our Marketing PowerPoint Templates because, this one depicts the popular chart. Use our Process and Flows PowerPoint Templates because; educate your listeners on the means to keep it ticking over. Use these PowerPoint slides for presentations relating to Arrow, Business, Circle, Circular, Collection, Connection, Cursor, Decoration, Design, Dimensional, Direction, Element, Icon, Illustration, Information, Modern, Motion, Paper, Perspective, Plastic, Pointer, Pointing, Process, Recycle, Recycling, Reflective, Set, Shape, Shiny, Sign, Symbol, Technology. The prominent colors used in the PowerPoint template are Yellow, Orange, and Gray

Customer Relationship Management Dashboard Customer Database- Example Themes PDF
Deliver an awe inspiring pitch with this creative customer relationship management dashboard customer database- example themes pdf bundle. Topics like salutation, chief executive, close database, direct line, postcode can be discussed with this completely editable template. It is available for immediate download depending on the needs and requirements of the user.
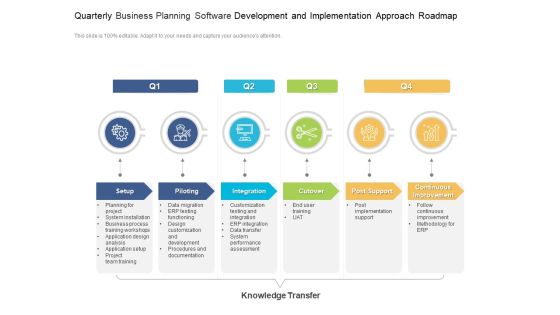
Quarterly Business Planning Software Development And Implementation Approach Roadmap Pictures
Presenting our innovatively-structured quarterly business planning software development and implementation approach roadmap pictures Template. Showcase your roadmap process in different formats like PDF, PNG, and JPG by clicking the download button below. This PPT design is available in both Standard Screen and Widescreen aspect ratios. It can also be easily personalized and presented with modified font size, font type, color, and shapes to measure your progress in a clear way.

Quarterly Planning And Approach Roadmap For Dissertation Conclusions Sample
Presenting our jaw-dropping quarterly planning and approach roadmap for dissertation conclusions sample. You can alternate the color, font size, font type, and shapes of this PPT layout according to your strategic process. This PPT presentation is compatible with Google Slides and is available in both standard screen and widescreen aspect ratios. You can also download this well-researched PowerPoint template design in different formats like PDF, JPG, and PNG. So utilize this visually-appealing design by clicking the download button given below.

Quarterly Business Intelligence Approach Quantification And Support Roadmap Download
Presenting our innovatively structured quarterly business intelligence approach quantification and support roadmap download Template. Showcase your roadmap process in different formats like PDF, PNG, and JPG by clicking the download button below. This PPT design is available in both Standard Screen and Widescreen aspect ratios. It can also be easily personalized and presented with modified font size, font type, color, and shapes to measure your progress in a clear way.
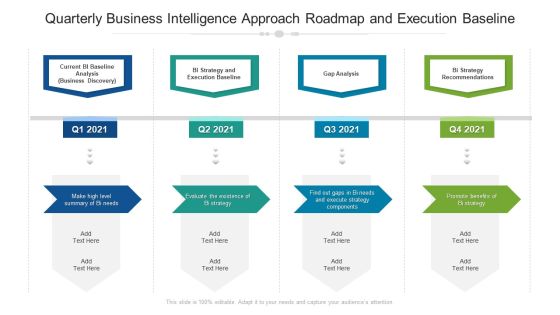
Quarterly Business Intelligence Approach Roadmap And Execution Baseline Slides
Introducing our quarterly business intelligence approach roadmap and execution baseline slides. This PPT presentation is Google Slides compatible, therefore, you can share it easily with the collaborators for measuring the progress. Also, the presentation is available in both standard screen and widescreen aspect ratios. So edit the template design by modifying the font size, font type, color, and shapes as per your requirements. As this PPT design is fully editable it can be presented in PDF, JPG and PNG formats.
Inclined Circle Arrows 3 Stages Flow Chart Slides PowerPoint
We present our inclined circle arrows 3 stages flow chart Slides PowerPoint. Use our Arrows PowerPoint Templates because, Emphasize on any critical or key factors within them. Use our Spheres PowerPoint Templates because; in any endeavor people matter most. Use our Symbol PowerPoint Templates because, Cycle Template: - Rolling along while gathering profits along the way is the aim. Use our Marketing PowerPoint Templates because; Use our creative template to lay down your views. Use our Process and Flows PowerPoint Templates because, See satisfaction spread across the room as they unravel your gifted views. Use these PowerPoint slides for presentations relating to Arrow, Business, Circle, Circular, Collection, Connection, Cursor, Decoration, Design, Dimensional, Direction, Element, Icon, Illustration, Information, Modern, Motion, Paper, Perspective, Plastic, Pointer, Pointing, Process, Recycle, Recycling, Reflective, Set, Shape, Shiny, Sign, Symbol, Technology. The prominent colors used in the PowerPoint template are Yellow, Orange, and Green
Orientated Circle Arrow Process 5 Typical Flow Chart PowerPoint Templates
We present our orientated circle arrow process 5 typical flow chart PowerPoint templates. Use our Arrows PowerPoint Templates because, Master them all and you have it made. Use our Spheres PowerPoint Templates because, At times, however, there is a crucial aspect that requires extra attention. Use our Symbol PowerPoint Templates because, Brilliant ideas popping up all over the place. Use our Marketing PowerPoint Templates because; Use our templates for your colleagues knowledge to feed. Use our Process and Flows PowerPoint Templates because, Brainstorming Light Bulbs: - The atmosphere in the workplace is electric. Use these PowerPoint slides for presentations relating to Arrow, Business, Circle, Circular, Collection, Connection, Cursor, Decoration, Design, Dimensional, Direction, Element, Icon, Illustration, Information, Modern, Motion, Paper, Perspective, Plastic, Pointer, Pointing, Process, Recycle, Recycling, Reflective, Set, Shape, Shiny, Sign, Symbol, Technology. The prominent colors used in the PowerPoint template are Orange, Gray, and Black

Puzzle Representation 2 Stages Ppt Flow Chart Slides Free PowerPoint
We present our puzzle representation 2 stages ppt flow chart Slides free PowerPoint. Use our Arrows PowerPoint Templates because, now you need to get it all together to form the complete picture and reach the goal. Use our Spheres PowerPoint Templates because, you have analyzed the illness and know the need. Use our Symbol PowerPoint Templates because, Business Template: - There is a vision, a need you can meet. Use our Marketing PowerPoint Templates because, Original thinking is the need of the hour. Use our Process and Flows PowerPoint Templates because, our template will help pinpoint their viability. Use these PowerPoint slides for presentations relating to Arrow, Business, Circle, Circular, Collection, Connection, Cursor, Decoration, Design, Dimensional, Direction, Element, Icon, Illustration, Information, Modern, Motion, Paper, Perspective, Plastic, Pointer, Pointing, Process, Recycle, Recycling, Reflective, Set, Shape, Shiny, Sign, Symbol, Technology. The prominent colors used in the PowerPoint template are Blue, Gray, and Black
Sloping Circle Arrows Process 4 System Flow Charts PowerPoint Slides
We present our sloping circle arrows process 4 system flow charts PowerPoint Slides. Use our Arrows PowerPoint Templates because, Brilliant ideas popping up all over the place. Use our Spheres PowerPoint Templates because, one pushes the other till it all comes back full circle. Use our Symbol PowerPoint Templates because; now imprint them on the minds of your audience via our slides. Use our Marketing PowerPoint Templates because, There are so many different pieces to the puzzle. Use our Process and Flows PowerPoint Templates because, Cycle Template:- Rolling along while gathering profits along the way is the aim. Use these PowerPoint slides for presentations relating to Arrow, Business, Circle, Circular, Collection, Connection, Cursor, Decoration, Design, Dimensional, Direction, Element, Icon, Illustration, Information, Modern, Motion, Paper, Perspective, Plastic, Pointer, Pointing, Process, Recycle, Recycling, Reflective, Set, Shape, Shiny, Sign, Symbol, Technology. The prominent colors used in the PowerPoint template are Yellow, Gray, and Black
Sloping Circle Arrows Process Flow Chart Description PowerPoint Templates
We present our sloping circle arrows process flow chart description PowerPoint templates. Use our Arrows PowerPoint Templates because, The Venn graphic comprising interlinking circles geometrically demonstrate how various functions operating independently, to a large extent, are essentially interdependent. Use our Spheres PowerPoint Templates because, Explain to your group how they mesh together to drive the whole. Use our Symbol PowerPoint Templates because, the lessons have been analyzed, studied and conclusions drawn. Use our Marketing PowerPoint Templates because, you have some hits, you had some misses. Use our Process and Flows PowerPoint Templates because, Clarity of thought has been the key to your growth. Use these PowerPoint slides for presentations relating to Arrow, Business, Circle, Circular, Collection, Connection, Cursor, Decoration, Design, Dimensional, Direction, Element, Icon, Illustration, Information, Modern, Motion, Paper, Perspective, Plastic, Pointer, Pointing, Process, Recycle, Recycling, Reflective, Set, Shape, Shiny, Sign, Symbol, Technology. The prominent colors used in the PowerPoint template are Green, Gray, and Black

Quality Control Dashboard Ppt PowerPoint Presentation Visual Aids Summary PDF
Following slide shows quality control dashboard covering target and measurement percentage of process under control. It also includes statistics of number of defects per lot, corrective actions and cost of quantity.Deliver an awe-inspiring pitch with this creative quality control dashboard ppt powerpoint presentation visual aids summary pdf. bundle. Topics like process under control, cost of quality, target can be discussed with this completely editable template. It is available for immediate download depending on the needs and requirements of the user.
Search Engine Marketing Develop Campaign Performance Tracking Framework Graphics PDF
The following slide depicts campaign performance management dashboard to measure the results. It includes elements such as conversions funnel, conversion rates, opportunity value, landing pages, sources google, twitter, Facebook etc. This Search Engine Marketing Develop Campaign Performance Tracking Framework Graphics PDF from Slidegeeks makes it easy to present information on your topic with precision. It provides customization options, so you can make changes to the colors, design, graphics, or any other component to create a unique layout. It is also available for immediate download, so you can begin using it right away. Slidegeeks has done good research to ensure that you have everything you need to make your presentation stand out. Make a name out there for a brilliant performance.

Metrics To Measure Business Performance Customer Churn Rate Dashboard Background PDF
Mentioned slide covers customer churn rate dashboard. It includes details of monthly customer churn rate, accounts opened, churned accounts demographics and churn heatmap. Deliver an awe inspiring pitch with this creative Metrics To Measure Business Performance Customer Churn Rate Dashboard Background PDF bundle. Topics likeCustomer Churn Rate, Churn Heatmap, Churned Accounts can be discussed with this completely editable template. It is available for immediate download depending on the needs and requirements of the user.

Customer Churn Rate Dashboard Company Performance Evaluation Using KPI Slides PDF
Mentioned slide covers customer churn rate dashboard. It includes details of monthly customer churn rate, accounts opened, churned accounts demographics and churn heatmap. Deliver an awe inspiring pitch with this creative Customer Churn Rate Dashboard Company Performance Evaluation Using KPI Slides PDF bundle. Topics like Churn Heatmap, Demographics, Churned Accounts can be discussed with this completely editable template. It is available for immediate download depending on the needs and requirements of the user.
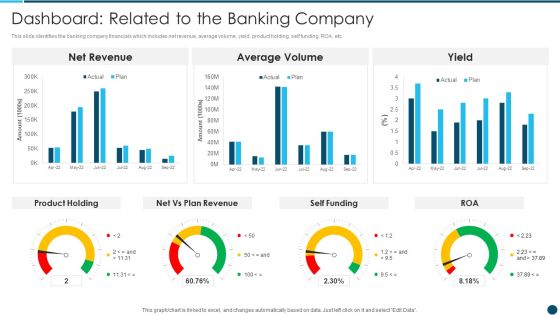
Digital Technology Adoption In Banking Industry Case Competition Dashboard Related Background PDF
This slide identifies the banking company financials which includes net revenue, average volume, yield, product holding, self funding, ROA, etc.Deliver an awe inspiring pitch with this creative Digital Technology Adoption In Banking Industry Case Competition Dashboard Related Background PDF bundle. Topics like Net Revenue, Average Volume, Product Holding can be discussed with this completely editable template. It is available for immediate download depending on the needs and requirements of the user.
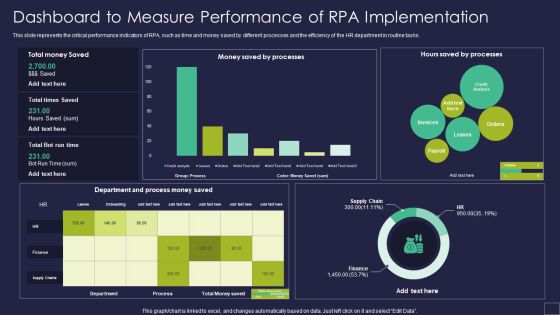
Dashboard To Measure Performance Of RPA Implementation Robotic Process Automation Technology Slides PDF
This slide represents the critical performance indicators of RPA, such as time and money saved by different processes and the efficiency of the HR department in routine tasks. Deliver an awe inspiring pitch with this creative Dashboard To Measure Performance Of RPA Implementation Robotic Process Automation Technology Slides PDF bundle. Topics like Department Process, Saved Processes, Hours Saved can be discussed with this completely editable template. It is available for immediate download depending on the needs and requirements of the user.
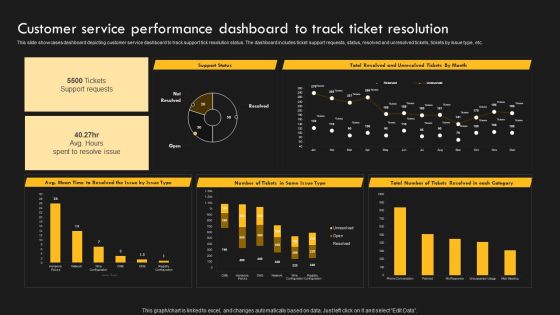
Service Improvement Techniques For Client Retention Customer Service Performance Dashboard Diagrams PDF
This slide showcases dashboard depicting customer service dashboard to track support tick resolution status. The dashboard includes ticket support requests, status, resolved and unresolved tickets, tickets by issue type, etc. Find highly impressive Service Improvement Techniques For Client Retention Customer Service Performance Dashboard Diagrams PDF on Slidegeeks to deliver a meaningful presentation. You can save an ample amount of time using these presentation templates. No need to worry to prepare everything from scratch because Slidegeeks experts have already done a huge research and work for you. You need to download Service Improvement Techniques For Client Retention Customer Service Performance Dashboard Diagrams PDF for your upcoming presentation. All the presentation templates are 100 percent editable and you can change the color and personalize the content accordingly. Download now.

Four Phases Workstreams For Agile Resource Planning Rules PDF
This slide covers four workstreams for agile resource planning. It involves four phases such as product vision, product roadmap, release plan and iteration plan. Presenting Four Phases Workstreams For Agile Resource Planning Rules PDF to dispense important information. This template comprises four stages. It also presents valuable insights into the topics including Enable Transforming, Professional Looking, Contact Influencers. This is a completely customizable PowerPoint theme that can be put to use immediately. So, download it and address the topic impactfully.

Latest Methodologies Of Construction Essential Construction Activities Management Dashboard Mockup PDF
This slide provides information regarding essential construction activities management dashboard with details about site inspection, rework costs, safety meetings, etc. From laying roadmaps to briefing everything in detail, our templates are perfect for you. You can set the stage with your presentation slides. All you have to do is download these easy-to-edit and customizable templates. Latest Methodologies Of Construction Essential Construction Activities Management Dashboard Mockup PDF will help you deliver an outstanding performance that everyone would remember and praise you for. Do download this presentation today.

Four Phases Of Site Business Plan Review Process Information PDF
This slide showcases sequential steps involved in site plan review which are project submittal, internal or internal review, decision or final documents and permitting or construction. Persuade your audience using this Four Phases Of Site Business Plan Review Process Information PDF. This PPT design covers four stages, thus making it a great tool to use. It also caters to a variety of topics including Development Construction, External Review, Internal Review. Download this PPT design now to present a convincing pitch that not only emphasizes the topic but also showcases your presentation skills.
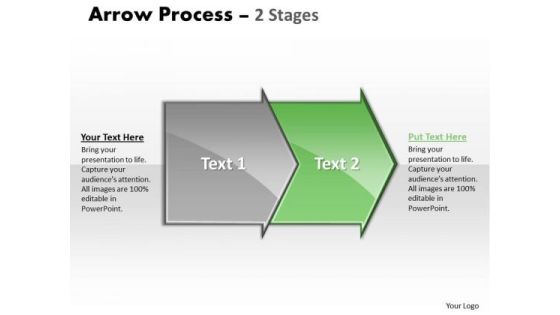
Process Ppt Theme Horizontal Illustration Through Shapes Arrows PowerPoint 3 Graphic
We present our process PPT Theme Horizontal illustration through shapes arrows PowerPoint 3 Graphic. Use our Arrows PowerPoint Templates because; illustrate how each element flows seamlessly onto the next stage. Use our Process and flows PowerPoint Templates because, you have the right arrows in your quiver. Use our Business PowerPoint Templates because, you have played a stellar role and have a few ideas. Use our Symbol PowerPoint Templates because, to go for Gold and not just silver. Use our Metaphor PowerPoint Templates because; Use your findings to help arrive at an accurate diagnosis. Use these PowerPoint slides for presentations relating to Arrow, Background, Business, Chart, Diagram, Financial, Graphic, Gray, Icon, Illustration, Management, Orange, Perspective, Planning, Process, Stages, Steps, Text. The prominent colors used in the PowerPoint template are Green, Gray, and Black

Business Kpi Dashboard Diagram Powerpoint Templates
This is a business kpi dashboard diagram powerpoint templates. This is a six stage process. The stages in this process are analytics, cost per sales, reporting, kpis, dashboard, visualization.
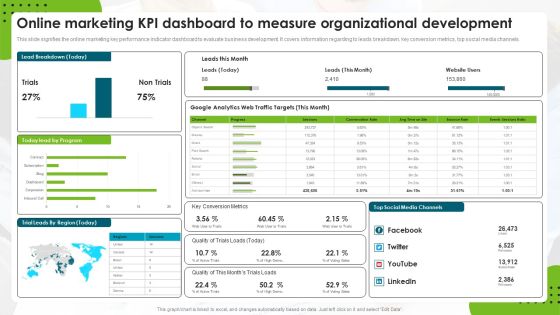
Online Marketing Kpi Dashboard To Measure Organizational Development Rules PDF
This slide signifies the online marketing key performance indicator dashboard to evaluate business development. It covers information regarding to leads breakdown, key conversion metrics, top social media channels. Pitch your topic with ease and precision using this Online Marketing Kpi Dashboard To Measure Organizational Development Rules PDF. This layout presents information on Web Traffic Targets, Google Analytics, Social Media Channels. It is also available for immediate download and adjustment. So, changes can be made in the color, design, graphics or any other component to create a unique layout.

Consumer Journey Mapping Techniques Dashboard For Tracking Digital Content Performance Clipart PDF
This slide covers the KPI dashboard for analyzing online content. It includes metrics such as blog visitors, pageviews, newsletter conversion rate, new signups, new customers, etc. Showcasing this set of slides titled Consumer Journey Mapping Techniques Dashboard For Tracking Digital Content Performance Clipart PDF. The topics addressed in these templates are Purchase Amount, Customers, Tracking Digital Content Performance. All the content presented in this PPT design is completely editable. Download it and make adjustments in color, background, font etc. as per your unique business setting.
Ppt Templates Natural Renewable Sources Of Green Energy PowerPoint Slides
PPT templates Natural renewable Sources of Green energy PowerPoint Slides-These high quality powerpoint pre-designed slides and powerpoint templates have been carefully created by our professional team to help you impress your audience. All slides have been created and are 100% editable in powerpoint. Each and every property of any graphic - color, size, orientation, shading, outline etc. can be modified to help you build an effective powerpoint presentation. Any text can be entered at any point in the powerpoint template or slide. Simply DOWNLOAD, TYPE and PRESENT!-These PowerPoint slides can be used to represent concepts relating to-Bulb, car, clean, collection, concept, conservation, design, drawing, earth, eco, ecology, electric, electricity, energy, environment, environmental, global, grass, green, house, icon, illustration, industry, information, interface, internet, isolated, leaf, light, natural, nature, painting, plant, power, renewable, sign, sketch, sky, solar, sun, symbol, technology, tree, vector, water, white, wind, windmill-PPT templates Natural renewable Sources of Green energy PowerPoint Slides

Strategic Guide To Perform Marketing Social Media Campaign Management Dashboard Brochure PDF
This slide showcases a dashboard for managing ad social media campaign to assists marketers in tracking success of ads, content engagement and reach. It highlights element such as date period, goals completion all, goals conversion rate, target progress bar, users, sessions, etc. Create an editable Strategic Guide To Perform Marketing Social Media Campaign Management Dashboard Brochure PDF that communicates your idea and engages your audience. Whether youre presenting a business or an educational presentation, pre-designed presentation templates help save time. Strategic Guide To Perform Marketing Social Media Campaign Management Dashboard Brochure PDF is highly customizable and very easy to edit, covering many different styles from creative to business presentations. Slidegeeks has creative team members who have crafted amazing templates. So, go and get them without any delay.
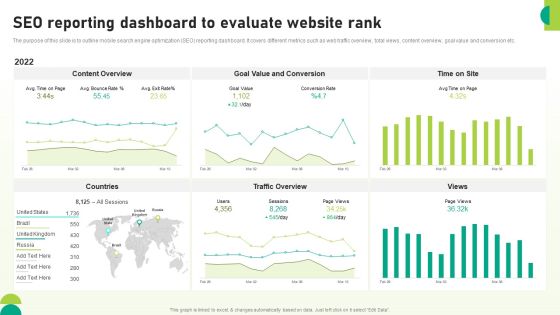
Utilizing SEO To Boost Customer SEO Reporting Dashboard To Evaluate Website Rank Background PDF
The purpose of this slide is to outline mobile search engine optimization SEO reporting dashboard. It covers different metrics such as web traffic overview, total views, content overview, goal value and conversion etc. Take your projects to the next level with our ultimate collection of Utilizing SEO To Boost Customer SEO Reporting Dashboard To Evaluate Website Rank Background PDF. Slidegeeks has designed a range of layouts that are perfect for representing task or activity duration, keeping track of all your deadlines at a glance. Tailor these designs to your exact needs and give them a truly corporate look with your own brand colors theyll make your projects stand out from the rest.
Merchandise Launch Kickoff Playbook Product Launch Activities Tracking Dashboard Ideas PDF
This slide provides information regarding product launch activities tracking dashboard in terms of project budget, projected launch date, overdue tasks, workload, risks, etc. Get a simple yet stunning designed Merchandise Launch Kickoff Playbook Product Launch Activities Tracking Dashboard Ideas PDF. It is the best one to establish the tone in your meetings. It is an excellent way to make your presentations highly effective. So, download this PPT today from Slidegeeks and see the positive impacts. Our easy to edit Merchandise Launch Kickoff Playbook Product Launch Activities Tracking Dashboard Ideas PDF can be your go-to option for all upcoming conferences and meetings. So, what are you waiting for Grab this template today.
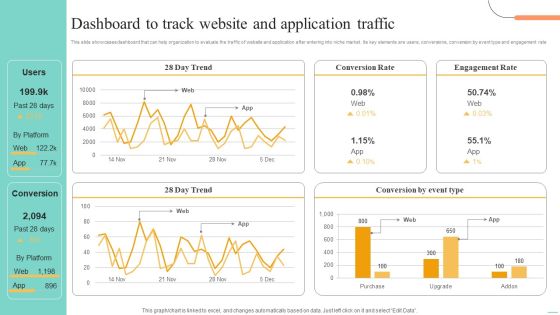
Price Leadership Technique Dashboard To Track Website And Application Traffic Themes PDF
This slide showcases dashboard that can help organization to evaluate the traffic of website and application after entering into niche market. Its key elements are users, conversions, conversion by event type and engagement rate. Here you can discover an assortment of the finest PowerPoint and Google Slides templates. With these templates, you can create presentations for a variety of purposes while simultaneously providing your audience with an eye catching visual experience. Download Price Leadership Technique Dashboard To Track Website And Application Traffic Themes PDF to deliver an impeccable presentation. These templates will make your job of preparing presentations much quicker, yet still, maintain a high level of quality. Slidegeeks has experienced researchers who prepare these templates and write high quality content for you. Later on, you can personalize the content by editing the Price Leadership Technique Dashboard To Track Website And Application Traffic Themes PDF.

Implementing BPM Techniques Banking Dashboard To Determine Total Loans And Deposits Information Clipart PDF
Mentioned slide portrays banking dashboard providing information on total loans and deposits by region and by district. Deliver an awe inspiring pitch with this creative Implementing BPM Techniques Banking Dashboard To Determine Total Loans And Deposits Information Clipart PDF bundle. Topics like Banking Dashboard, Deposits Information, Growth can be discussed with this completely editable template. It is available for immediate download depending on the needs and requirements of the user.
Digital Resilience Biomarker Technologies IT Dashboard For Digital Biomarkers Tracking Elements PDF
This slide represents the dashboard for digital biomarkers tracking, and it covers details about coughing, talking, physical activity, respiration, cardiac activity, body orientation, and snoring, including the date and time of these activities. Present like a pro with Digital Resilience Biomarker Technologies IT Dashboard For Digital Biomarkers Tracking Elements PDF Create beautiful presentations together with your team, using our easy to use presentation slides. Share your ideas in real time and make changes on the fly by downloading our templates. So whether you are in the office, on the go, or in a remote location, you can stay in sync with your team and present your ideas with confidence. With Slidegeeks presentation got a whole lot easier. Grab these presentations today.

Dashboards And Scorecards Comparison Diagram Ppt Slides
This is a dashboards and scorecards comparison diagram ppt slides. This is a three stage process. The stages in this process are dashboard, balanced scorecard, differences, performance management, periodically monthly, gps shows how will arrive, is used for, is update, in automobile it is, performance monitoring, in real time, automobile dashboard shows how your car is operating.

Implementing Fixed Asset Management Key Statistics Associated With Fixed Asset Management Themes PDF
This slide represents statistics related to fixed asset management. It includes asset tracking system, ownership cost, ghost assets, tax and insurance etc. Presenting Implementing Fixed Asset Management Key Statistics Associated With Fixed Asset Management Themes PDF to provide visual cues and insights. Share and navigate important information on four stages that need your due attention. This template can be used to pitch topics like Total Cost, Fixed Asset, Tracking System. In addtion, this PPT design contains high resolution images, graphics, etc, that are easily editable and available for immediate download.

Application Development Life Cycle Phase 3 Building Or Developing The Product Diagrams PDF
This slide describes the building or development of the product phase of SDLC, including the programming tools and languages such as C, C, Pascal, Java, and PHP. This is a application development life cycle phase 2 designing the product architecture template pdf template with various stages. Focus and dispense information on six stages using this creative set, that comes with editable features. It contains large content boxes to add your information on topics like phase 3 building or developing the product. You can also showcase facts, figures, and other relevant content using this PPT layout. Grab it now.
Devops Deployment Initiative IT Tracking Essential Devops Activities Dashboard Download PDF
This slide provides information regarding essential DevOps activities tracking dashboard in terms of project budget, workload, overdue tasks, etc. Deliver and pitch your topic in the best possible manner with this devops deployment initiative it tracking essential devops activities dashboard download pdf, Use them to share invaluable insights on tracking essential devops activities dashboard and impress your audience. This template can be altered and modified as per your expectations. So, grab it now.
New Product Development And Launch To Market Product Management Activities Tracking Dashboard Demonstration PDF
This slide provides information regarding essential product management activities tracking dashboard in terms of project budget, workload, overdue tasks, etc. Deliver and pitch your topic in the best possible manner with this new product development and launch to market product management activities tracking dashboard demonstration pdf . Use them to share invaluable insights on product management activities tracking dashboard and impress your audience. This template can be altered and modified as per your expectations. So, grab it now.
Key Parameters To Establish Overall Devops Value IT Tracking Essential Devops Activities Dashboard Pictures PDF
This slide provides information regarding essential DevOps activities tracking dashboard in terms of project budget, workload, overdue tasks, etc. Deliver an awe inspiring pitch with this creative key parameters to establish overall devops value it tracking essential devops activities dashboard pictures pdf bundle. Topics like tracking essential devops activities dashboard can be discussed with this completely editable template. It is available for immediate download depending on the needs and requirements of the user.
Product Development Using Agile Tracking Essential Product Management Activities Dashboard Formats PDF
This slide provides information regarding essential product management activities tracking dashboard in terms of project budget, workload, overdue tasks, etc. Deliver and pitch your topic in the best possible manner with this Product Development Using Agile Tracking Essential Product Management Activities Dashboard Formats PDF Use them to share invaluable insights on Tracking Essential Product Management Activities Dashboard and impress your audience. This template can be altered and modified as per your expectations. So, grab it now.

Quarterly Roadmap For Building Market Expansion Strategy Information PDF
This slide includes roadmap for building market extension strategy to capture market share and to expand business presence. This phases comprises of identify and prioritize market, formulate entry strategy, and construct plan of action. Persuade your audience using this Quarterly Roadmap For Building Market Expansion Strategy Information PDF. This PPT design covers three stages, thus making it a great tool to use. It also caters to a variety of topics including Identify And Prioritize Market, Construct Plan, Formulate Market Entry Strategy. Download this PPT design now to present a convincing pitch that not only emphasizes the topic but also showcases your presentation skills.
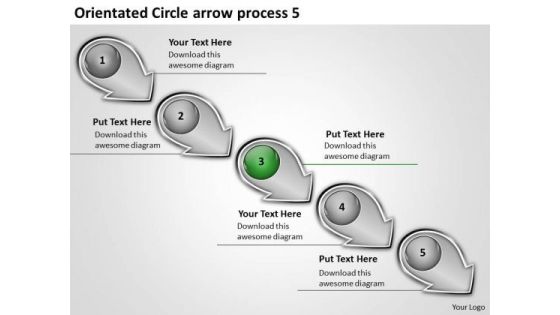
Orientated Circle Arrow Process 5 Business Typical Flow Chart PowerPoint Templates
We present our orientated circle arrow process 5 business typical flow chart PowerPoint templates. Use our Arrows PowerPoint Templates because; however it requires care and diligence to function well. Use our Spheres PowerPoint Templates because, Ideas roll along in your mind like billiard balls. Use our Symbol PowerPoint Templates because, we provide the means to project your views. Use our Marketing PowerPoint Templates because; Lay down the fundamentals to build upon. Use our Process and Flows PowerPoint Templates because, Use this slide to detail and highlight your thought process, your views and your positive expectations. Use these PowerPoint slides for presentations relating to Arrow, Business, Circle, Circular, Collection, Connection, Cursor, Decoration, Design, Dimensional, Direction, Element, Icon, Illustration, Information, Modern, Motion, Paper, Perspective, Plastic, Pointer, Pointing, Process, Recycle, Recycling, Reflective, Set, Shape, Shiny, Sign, Symbol, Technology. The prominent colors used in the PowerPoint template are Green, Gray, and Black

Orientated Circle Arrow Process 5 What Is Flow Charts PowerPoint Slides
We present our orientated circle arrow process 5 what is flow charts PowerPoint Slides. Use our Arrows PowerPoint Templates because, you have the basic goal in mind. Use our Spheres PowerPoint Templates because, to take your team soaring to the pinnacle they crave. Use our Symbol PowerPoint Templates because, Its also been said that prevention is better than cure, either way you have a store of knowledge for sure. Use our Marketing PowerPoint Templates because, it is in your DNA to analyses possible causes to the minutest detail. Use our Process and Flows PowerPoint Templates because, you have the plans to increase the strength of your business relationships. Use these PowerPoint slides for presentations relating to Arrow, Business, Circle, Circular, Collection, Connection, Cursor, Decoration, Design, Dimensional, Direction, Element, Icon, Illustration, Information, Modern, Motion, Paper, Perspective, Plastic, Pointer, Pointing, Process, Recycle, Recycling, Reflective, Set, Shape, Shiny, Sign, Symbol, Technology. The prominent colors used in the PowerPoint template are Red, Gray, and Black
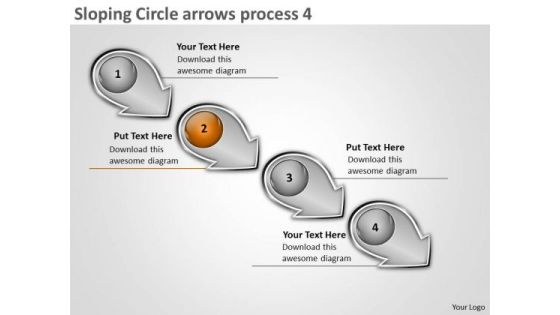
Sloping Circle Arrows Process 4 Business System Flow Charts PowerPoint Slides
We present our sloping circle arrows process 4 business system flow charts PowerPoint Slides. Use our Arrows PowerPoint Templates because; educate your listeners on the means to keep it ticking over. Use our Spheres PowerPoint Templates because, guaranteed to focus the minds of your team. Use our Symbol PowerPoint Templates because, you have analyzed the illness and know the need. Use our Marketing PowerPoint Templates because, Our PowerPoint templates give this step by step process to achieve the aim. Use our Process and Flows PowerPoint Templates because, Gears interconnected: - The Gear Train is a basic element of living and daily business. Use these PowerPoint slides for presentations relating to Arrow, Business, Circle, Circular, Collection, Connection, Cursor, Decoration, Design, Dimensional, Direction, Element, Icon, Illustration, Information, Modern, Motion, Paper, Perspective, Plastic, Pointer, Pointing, Process, Recycle, Recycling, Reflective, Set, Shape, Shiny, Sign, Symbol, Technology. The prominent colors used in the PowerPoint template are Orange, Gray, and Black

Business Dashboard Diagram Ppt Powerpoint Slides
This is a business dashboard diagram ppt powerpoint slides. This is a three stage process. The stages in this process are low, medium, high.
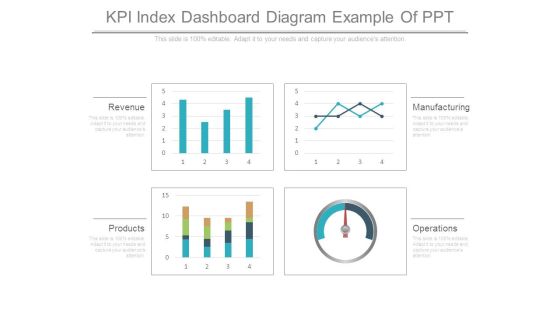
Kpi Index Dashboard Diagram Example Of Ppt
This is a kpi index dashboard diagram example of ppt. This is a four stage process. The stages in this process are revenue, products, operations, manufacturing.
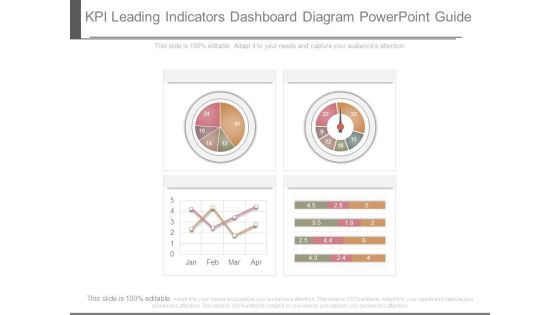
Kpi Leading Indicators Dashboard Diagram Powerpoint Guide
This is a kpi leading indicators dashboard diagram powerpoint guide. This is a four stage process. The stages in this process are business, success, process.

Dashboard Business Intelligence Diagram Powerpoint Slides
This is a dashboard business intelligence diagram powerpoint slides. This is a four stage process. The stages in this process are quickbase, flexible, simple, organized.

Online Survey Technology PowerPoint Themes And PowerPoint Slides 0511
Microsoft PowerPoint Theme and Slide with a web browser window shows the words online survey and a check mark in box
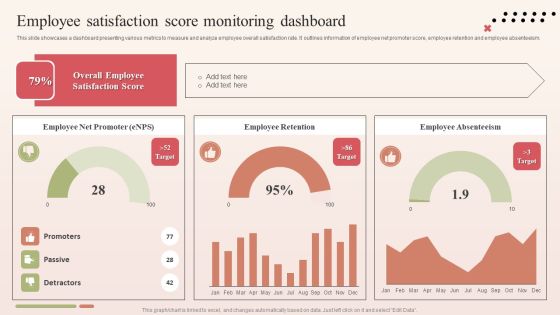
Employee Satisfaction Score Monitoring Dashboard Slides PDF
This slide showcases a dashboard presenting various metrics to measure and analyze employee overall satisfaction rate. It outlines information of employee net promoter score, employee retention and employee absenteeism. Are you in need of a template that can accommodate all of your creative concepts This one is crafted professionally and can be altered to fit any style. Use it with Google Slides or PowerPoint. Include striking photographs, symbols, depictions, and other visuals. Fill, move around, or remove text boxes as desired. Test out color palettes and font mixtures. Edit and save your work, or work with colleagues. Download Employee Satisfaction Score Monitoring Dashboard Slides PDF and observe how to make your presentation outstanding. Give an impeccable presentation to your group and make your presentation unforgettable.
Product Sales Performance Tracking Dashboard Introduction PDF
This slide provides information regarding dashboard utilized by firm to monitor sales performance of products offered. The performance is tracked through revenues generated, online vs offline purchases, cost of goods sold, etc. Are you in need of a template that can accommodate all of your creative concepts This one is crafted professionally and can be altered to fit any style. Use it with Google Slides or PowerPoint. Include striking photographs, symbols, depictions, and other visuals. Fill, move around, or remove text boxes as desired. Test out color palettes and font mixtures. Edit and save your work, or work with colleagues. Download Product Sales Performance Tracking Dashboard Introduction PDF and observe how to make your presentation outstanding. Give an impeccable presentation to your group and make your presentation unforgettable.
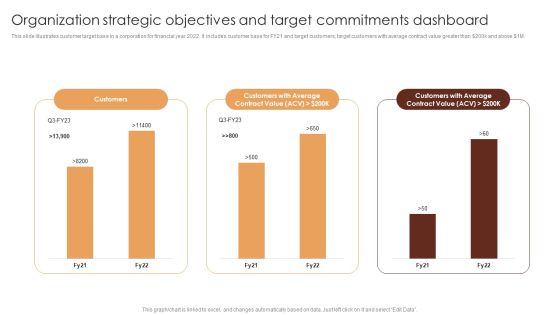
Organization Strategic Objectives And Target Commitments Dashboard Themes PDF
This slide illustrates customer target base in a corporation for financial year 2022. It includes customer base for FY21 and target customers, target customers with average contract value greater than dollar 200k and above dollar 1M. Pitch your topic with ease and precision using this Organization Strategic Objectives And Target Commitments Dashboard Themes PDF. This layout presents information on Customers Average, Contract Value, Customers. It is also available for immediate download and adjustment. So, changes can be made in the color, design, graphics or any other component to create a unique layout.
Enhancing CX Strategy Customer Service Kpi Tracking Dashboard Themes PDF
This Enhancing CX Strategy Customer Service Kpi Tracking Dashboard Themes PDF from Slidegeeks makes it easy to present information on your topic with precision. It provides customization options, so you can make changes to the colors, design, graphics, or any other component to create a unique layout. It is also available for immediate download, so you can begin using it right away. Slidegeeks has done good research to ensure that you have everything you need to make your presentation stand out. Make a name out there for a brilliant performance.
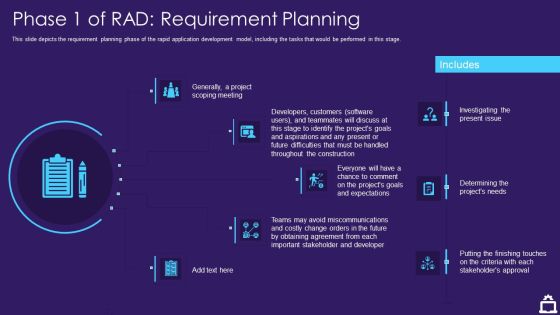
RAD Approach IT Phase 1 Of RAD Requirement Planning Ppt Infographic Template Show PDF
This slide depicts the requirement planning phase of the rapid application development model, including the tasks that would be performed in this stage. This is a rad approach it phase 1 of rad requirement planning ppt infographic template show pdf template with various stages. Focus and dispense information on five stages using this creative set, that comes with editable features. It contains large content boxes to add your information on topics like phase 1 of rad requirement planning. You can also showcase facts, figures, and other relevant content using this PPT layout. Grab it now.

Enhancing Digital Visibility Using SEO Content Strategy KPI Dashboard To Evaluate SEO Performance Diagrams PDF
This slide shows key performance indicators dashboard which can be used by marketing managers to measure SEO performance. It includes metrics such as health score, domain rating, referring domains, backlinks, etc. This Enhancing Digital Visibility Using SEO Content Strategy KPI Dashboard To Evaluate SEO Performance Diagrams PDF is perfect for any presentation, be it in front of clients or colleagues. It is a versatile and stylish solution for organizing your meetings. The Enhancing Digital Visibility Using SEO Content Strategy KPI Dashboard To Evaluate SEO Performance Diagrams PDF features a modern design for your presentation meetings. The adjustable and customizable slides provide unlimited possibilities for acing up your presentation. Slidegeeks has done all the homework before launching the product for you. So, do not wait, grab the presentation templates today

Certified Ethical Hacker Ceh Job Description Collection Of Information Technology Certifications Themes PDF
This slide covers Certified ethical hacker CEH certifications Training and Exam Cost, Job Description, Roles and responsibilities and average salary package etc. Presenting certified ethical hacker ceh job description collection of information technology certifications themes pdf to provide visual cues and insights. Share and navigate important information on four stages that need your due attention. This template can be used to pitch topics like Networks, Systems, Organization, secure device. In addtion, this PPT design contains high resolution images, graphics, etc, that are easily editable and available for immediate download.
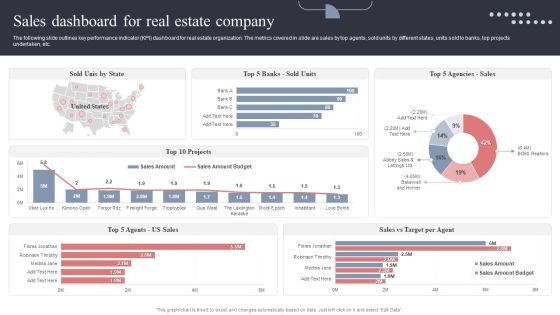
Sales Dashboard For Real Estate Company Topics PDF
The following slide outlines key performance indicator KPI dashboard for real estate organization. The metrics covered in slide are sales by top agents, sold units by different states, units sold to banks, top projects undertaken, etc. This Sales Dashboard For Real Estate Company Topics PDF is perfect for any presentation, be it in front of clients or colleagues. It is a versatile and stylish solution for organizing your meetings. The Sales Dashboard For Real Estate Company Topics PDF features a modern design for your presentation meetings. The adjustable and customizable slides provide unlimited possibilities for acing up your presentation. Slidegeeks has done all the homework before launching the product for you. So, do not wait, grab the presentation templates today
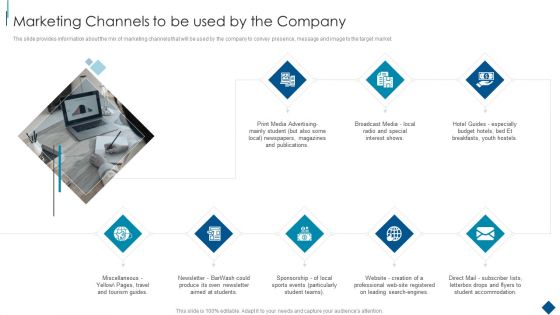
Confidential Information Memorandum Marketing Channels To Be Used By The Company Themes PDF
The slide provides information about the mix of marketing channels that will be used by the company to convey presence, message and image to the target market. This is a Confidential Information Memorandum Marketing Channels To Be Used By The Company Themes PDF template with various stages. Focus and dispense information on eight stages using this creative set, that comes with editable features. It contains large content boxes to add your information on topics like Print Media Advertising, Newspapers Magazines Publications, Broadcast Media Local. You can also showcase facts, figures, and other relevant content using this PPT layout. Grab it now.


 Continue with Email

 Home
Home


