Data Analysis Icon
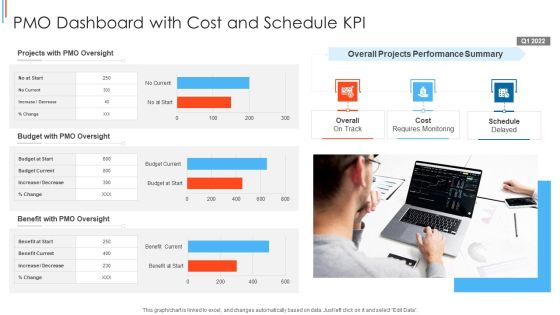
PMO Dashboard With Cost And Schedule KPI Template PDF
Showcasing this set of slides titled PMO Dashboard With Cost And Schedule KPI Themes PDF The topics addressed in these templates are Projects With Pmo Oversight, Budget With Pmo Oversight, Benefit With Pmo Oversight All the content presented in this PPT design is completely editable. Download it and make adjustments in color, background, font etc. as per your unique business setting.
Project Performance Dashboard With Tracking And Control Phase Background PDF
Following slide exhibits project performance dashboard with monitoring and control phase which can be used by project managers to review the overall project. It includes metrics like project cost performance, project performance, time vs project phase and percentage of project phase completed. Pitch your topic with ease and precision using this Project Performance Dashboard With Tracking And Control Phase Background PDF This layout presents information on Earned Value, Project Cost Performance, Project Performance. It is also available for immediate download and adjustment. So, changes can be made in the color, design, graphics or any other component to create a unique layout.
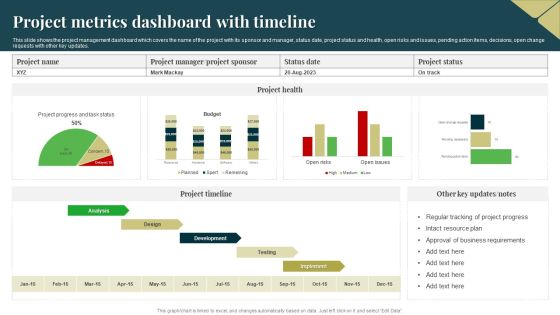
Project Metrics Dashboard With Timeline Themes PDF
This slide shows the project management dashboard which covers the name of the project with its sponsor and manager, status date, project status and health, open risks and issues, pending action items, decisions, open change requests with other key updates. Showcasing this set of slides titled Project Metrics Dashboard With Timeline Themes PDF. The topics addressed in these templates are Resource Plan, Business Requirements, Development. All the content presented in this PPT design is completely editable. Download it and make adjustments in color, background, font etc. as per your unique business setting.

Business Arrows PowerPoint Templates Marketing Wealth Planning Process Ppt Slides
Business Arrows PowerPoint Templates Marketing Wealth Planning Process PPT Slides-This PowerPoint slide has multicolor arrows that serve to show growth or progress-Business Arrows PowerPoint Templates Marketing Wealth Planning Process PPT Slides-This template can be used for presentations relating to Accounting, Amount, Arrow, Bank, Bar, Benefit, Business, Calculate, Calculation, Capitalist, Cash, Chart, Communication, Company, Concern, Connection, Corporate, Data, Diagram, Digital, Drawing, Earnings, Economic, Economy, Enterprise, Figures, Finance, Financial, Flow, Forecast, Gain, Goal, Graph, Growth, Illustration, Increase, Information, Interest, Investing, Investment, Investor, Management, Market, Money, Move, Network, Objective, Plan

Budget Assessment Dashboard With Project Financials Rules PDF
The following slide shows project management financials and budget portfolio dashboard. It provides information about workflow phase, statistics, baseline work, actual cost, remaining cost, etc. Showcasing this set of slides titled Budget Assessment Dashboard With Project Financials Rules PDF. The topics addressed in these templates are Portfolio Statistics, Portfolio Summery, Projects By State. All the content presented in this PPT design is completely editable. Download it and make adjustments in color, background, font etc. as per your unique business setting.

Estimating Business Overall Profitability Ratios To Measure The Organization Earnings Themes PDF
The following slide outlines different profitability ratios which can be used by the investors to measure the financial position of the company. It covers information about gross profit and net profit margin. The Estimating Business Overall Profitability Ratios To Measure The Organization Earnings Themes PDF is a compilation of the most recent design trends as a series of slides. It is suitable for any subject or industry presentation, containing attractive visuals and photo spots for businesses to clearly express their messages. This template contains a variety of slides for the user to input data, such as structures to contrast two elements, bullet points, and slides for written information. Slidegeeks is prepared to create an impression.
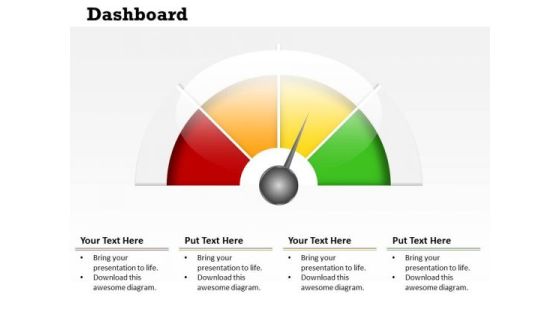
Business Framework Model Dashboard Design Business Strategy Diagram
Get The Doers Into Action. Activate Them With Our Business Framework Model Dashboard Design Business Strategy Diagram Powerpoint Templates.

Impact Of Supplier Relationships Challenges On Business Productivity Diagrams PDF
Mentioned slide illustrates supplier relationship management challenges impact on business led to reduce business performance. It includes key performance indicators such as lead time, compliance rate, defective product, product quality and timely product delivery. The Impact Of Supplier Relationships Challenges On Business Productivity Diagrams PDF is a compilation of the most recent design trends as a series of slides. It is suitable for any subject or industry presentation, containing attractive visuals and photo spots for businesses to clearly express their messages. This template contains a variety of slides for the user to input data, such as structures to contrast two elements, bullet points, and slides for written information. Slidegeeks is prepared to create an impression.

PowerPoint Org Chart Visualization Of Innovative Ideas Mind Map Templates
We present our powerpoint org chart visualization of innovative ideas mind map templates.Use our Technology PowerPoint Templates because These PowerPoint Templates and Slides will give the updraft to your ideas. See them soar to great heights with ease. Download our Marketing PowerPoint Templates because Our PowerPoint Templates and Slides are a sure bet. Gauranteed to win against all odds. Use our Arrows PowerPoint Templates because Our PowerPoint Templates and Slides will effectively help you save your valuable time. They are readymade to fit into any presentation structure. Use our Light Bulbs PowerPoint Templates because Our PowerPoint Templates and Slides are effectively colour coded to prioritise your plans They automatically highlight the sequence of events you desire. Present our Business PowerPoint Templates because Our PowerPoint Templates and Slides will definately Enhance the stature of your presentation. Adorn the beauty of your thoughts with their colourful backgrounds.Use these PowerPoint slides for presentations relating to Chart, flow, organization, flowchart, diagram, sitemap, process, box, arrow, graph, business, graphical, data, design, important, rectangle, corporate, plan, president, concept, hierarchy, glossy, teamwork, tier, chain, supervisor, relation, steps, glassy, connection, ladder, administration, group, connect, organize, connectivity, site-map, office, financial, structure, officer, glass. The prominent colors used in the PowerPoint template are Yellow, Gray, White.
Project Management Tracking Dashboard To Review Decision Download PDF
The below slide depicts the key performing indicators in project decision making. It includes elements such as overall status, progress, progress, time, cost and work volume. Pitch your topic with ease and precision using this Project Management Tracking Dashboard To Review Decision Download PDF. This layout presents information on Progress, Activity Status, Overall Status. It is also available for immediate download and adjustment. So, changes can be made in the color, design, graphics or any other component to create a unique layout.

Business Process Flowchart Examples 3d Men On Http Protocol PowerPoint Slides
We present our business process flowchart examples 3d men on http protocol PowerPoint Slides.Download and present our Computer PowerPoint Templates because Our PowerPoint Templates and Slides are conceived by a dedicated team. Use them and give form to your wondrous ideas. Download and present our Internet PowerPoint Templates because Our PowerPoint Templates and Slides will let you Hit the right notes. Watch your audience start singing to your tune. Download and present our Symbol PowerPoint Templates because You canTake a leap off the starting blocks with our PowerPoint Templates and Slides. They will put you ahead of the competition in quick time. Download and present our Success PowerPoint Templates because Our PowerPoint Templates and Slides will provide weight to your words. They will bring out the depth of your thought process. Present our Business PowerPoint Templates because our PowerPoint Templates and Slides will give your ideas the shape.Use these PowerPoint slides for presentations relating to 3d, address, browser, cartoon, character, computer, connection, cyberspace, data, design, display, domain, e-commerce, e-mail, ecommerce, engineer, help, hosting, http, hyperlink, icon, iconic, illustration, information, internet, isolated, laptop, male, man, network, notebook, pc, people, person, puppet, render, seo, service, sign, site, style, surf, symbol, technology, web, webdesign, webhosting, webpage, website, white. The prominent colors used in the PowerPoint template are Yellow, Black, Brown. PowerPoint presentation experts tell us our business process flowchart examples 3d men on http protocol PowerPoint Slides will make the presenter look like a pro even if they are not computer savvy. Use our browser PowerPoint templates and PPT Slides are visually appealing. You can be sure our business process flowchart examples 3d men on http protocol PowerPoint Slides will generate and maintain the level of interest you desire. They will create the impression you want to imprint on your audience. Presenters tell us our connection PowerPoint templates and PPT Slides look good visually. You can be sure our business process flowchart examples 3d men on http protocol PowerPoint Slides will get their audience's attention. Professionals tell us our connection PowerPoint templates and PPT Slides will make the presenter look like a pro even if they are not computer savvy.
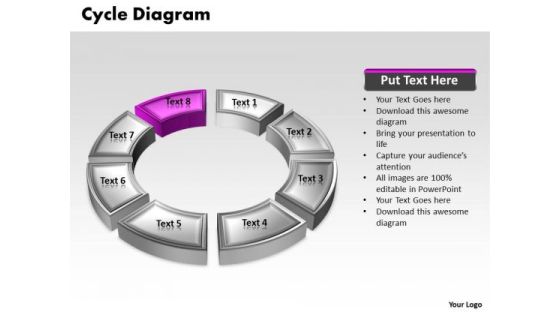
Ppt Pink Animated Text Cycle Cause And Effect Diagram PowerPoint Template Templates
PPT pink animated text cycle cause and effect diagram powerpoint template Templates-This Eight Way Round chart Diagram is an effective way of displaying Interconnected information. You can edit text, color, shade and style as per you need.-PPT pink animated text cycle cause and effect diagram powerpoint template Templates-Abstract, Blank, Business, Chart, Circular, Circulation, Cycle, Design, Diagram, Empty, Executive, Icon, Illustration, Management, Model, Numbers, Organization, Procedure, Process

Monthly Project Progress Details Dashboard Ppt PowerPoint Presentation Gallery Clipart PDF
The slide presents a dashboard showing progress status of project. It includes task timeline, status, priority, budget and pending items. Showcasing this set of slides titled Monthly Project Progress Details Dashboard Ppt PowerPoint Presentation Gallery Clipart PDF. The topics addressed in these templates are Goals Approval, Technical Applications, Task Priority. All the content presented in this PPT design is completely editable. Download it and make adjustments in color, background, font etc. as per your unique business setting.
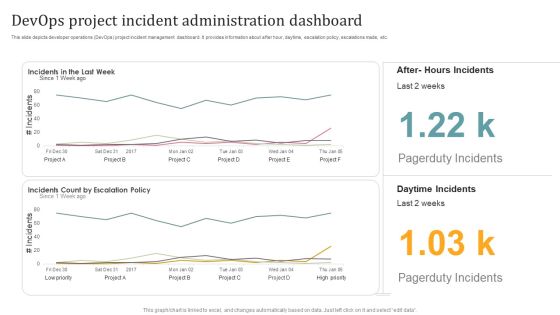
Devops Project Incident Administration Dashboard Diagrams PDF
This slide depicts developer operations DevOps project incident management dashboard. It provides information about after hour, daytime, escalation policy, escalations made, etc. Showcasing this set of slides titled Devops Project Incident Administration Dashboard Diagrams PDF. The topics addressed in these templates are Devops Project Incident, Administration Dashboard. All the content presented in this PPT design is completely editable. Download it and make adjustments in color, background, font etc. as per your unique business setting.

Stock Photo Video Marketing Text On Blue Key PowerPoint Slide
This image slide displays blue color video marketing key with video camera icon. This image slide has been designed with graphic of computer keyboard with video marketing key. Use this image slide in technology, marketing, sales and business. This image slide make your presentations outshine.

Steps To Develop Workforce Performance Evaluation System Ppt PowerPoint Presentation Infographic Template Visual Aids PDF
The slide shows steps to develop an effective performance evaluation system for an organization which ensures accountability, fairness and growth. It include develop evaluation form, determine performance measure, establish feedback instructions, determine disciplinary and terminating policies and set a schedule for conduct.Presenting Steps To Develop Workforce Performance Evaluation System Ppt PowerPoint Presentation Infographic Template Visual Aids PDF to dispense important information. This template comprises five stages. It also presents valuable insights into the topics including Workforce Evaluation, Productivity, Improvement Icon. This is a completely customizable PowerPoint theme that can be put to use immediately. So, download it and address the topic impactfully.
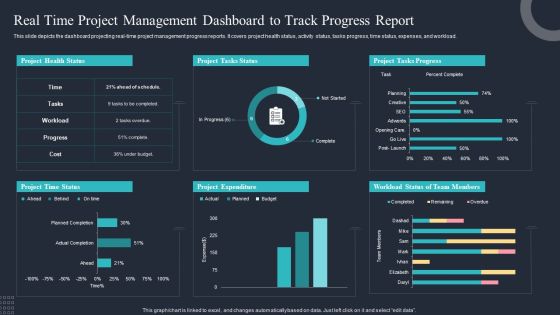
Real Time Project Management Dashboard To Track Progress Report Clipart PDF
This slide depicts the dashboard projecting real-time project management progress reports. It covers project health status, activity status, tasks progress, time status, expenses, and workload. Showcasing this set of slides titled Real Time Project Management Dashboard To Track Progress Report Clipart PDF. The topics addressed in these templates are Project Health Status, Project Tasks Status, Project Tasks Progress. All the content presented in this PPT design is completely editable. Download it and make adjustments in color, background, font etc. as per your unique business setting.

Coca Cola Holistic Marketing Communication Strategy Inspiration PDF
Presenting Coca Cola Holistic Marketing Communication Strategy Inspiration PDF to dispense important information. This template comprises three stages. It also presents valuable insights into the topics including Coca Cola Holistic Marketing, Communication Strategy, Report Icon. This is a completely customizable PowerPoint theme that can be put to use immediately. So, download it and address the topic impactfully.
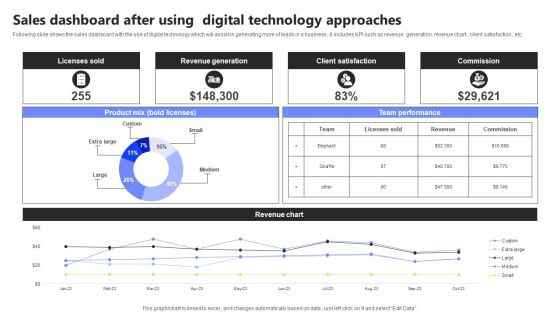
Sales Dashboard After Using Digital Technology Approaches Infographics PDF
Following slide shows the sales dashboard with the use of digital technology which will assist in generating more of leads in a business . It includes KPI such as revenue generation, revenue chart , client satisfaction , etc. Showcasing this set of slides titled Sales Dashboard After Using Digital Technology Approaches Infographics PDF. The topics addressed in these templates are Licenses Sold, Revenue Generation, Client Satisfaction. All the content presented in this PPT design is completely editable. Download it and make adjustments in color, background, font etc. as per your unique business setting.
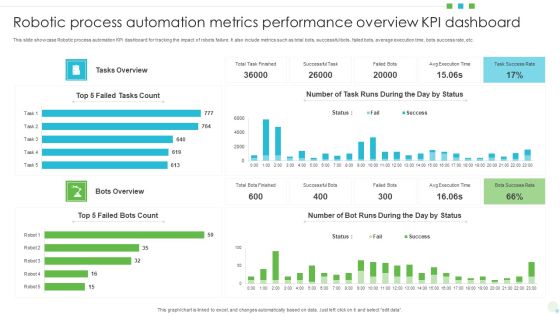
Robotic Process Automation Metrics Performance Overview KPI Dashboard Download PDF
This slide showcase Robotic process automation KPI dashboard for tracking the impact of robots failure. It also include metrics such as total bots, successful bots, failed bots, average execution time, bots success rate, etc. Showcasing this set of slides titled Robotic Process Automation Metrics Performance Overview KPI Dashboard Download PDF. The topics addressed in these templates are Robotic Process Automation, Metrics Performance Overview, Kpi Dashboard. All the content presented in this PPT design is completely editable. Download it and make adjustments in color, background, font etc. as per your unique business setting.
Concentric Process 3 Stages Ppt Business Plan PowerPoint Slides
We present our concentric process 3 stages ppt business plan PowerPoint Slides.Use our Business PowerPoint Templates because It will get your audience in sync. Use our Venn Diagrams PowerPoint Templates because Watching this your Audience will Grab their eyeballs, they wont even blink. Download and present our Layers PowerPoint Templates because our PowerPoint Templates and Slides will give your ideas the shape. Present our Circle Charts PowerPoint Templates because You can Be the star of the show with our PowerPoint Templates and Slides. Rock the stage with your ideas. Use our Shapes PowerPoint Templates because You have the co-ordinates for your destination of success. Let our PowerPoint Templates and Slides map out your journey.Use these PowerPoint slides for presentations relating to Diagram, process, business, graphic, design, ideas, model, data, chart, project, schema, corporate, implementation, tag, plan, engineering, concept, vector, success, symbol, stack, circle, guide, work flow, development, shape, team, management, cycle, steps, illustration, system, strategy, objects, phase, professional, organization, implement, background, image, detail, structure, product. The prominent colors used in the PowerPoint template are Green, Gray, Black.
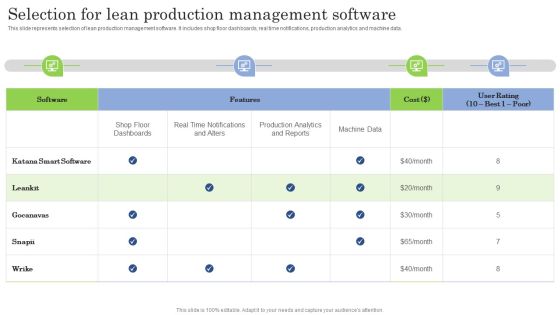
Selection For Lean Production Management Software Ppt PowerPoint Presentation Diagram PDF
This slide represents selection of lean production management software. It includes shop floor dashboards, real time notifications, production analytics and machine data. Are you searching for a Selection For Lean Production Management Software Ppt PowerPoint Presentation Diagram PDF that is uncluttered, straightforward, and original Its easy to edit, and you can change the colors to suit your personal or business branding. For a presentation that expresses how much effort you have put in, this template is ideal. With all of its features, including tables, diagrams, statistics, and lists, its perfect for a business plan presentation. Make your ideas more appealing with these professional slides. Download Selection For Lean Production Management Software Ppt PowerPoint Presentation Diagram PDF from Slidegeeks today.

World Business PowerPoint Templates Diagram Of Plan
We present our world business powerpoint templates diagram of plan.Download our Circle Charts PowerPoint Templates because You can Create a matrix with our PowerPoint Templates and Slides. Feel the strength of your ideas click into place. Download and present our Process and Flows PowerPoint Templates because They will Put your wonderful verbal artistry on display. Our PowerPoint Templates and Slides will provide you the necessary glam and glitter. Use our Flow Charts PowerPoint Templates because You can Double your output with our PowerPoint Templates and Slides. They make beating deadlines a piece of cake. Present our Business PowerPoint Templates because Our PowerPoint Templates and Slides will Activate the energies of your audience. Get their creative juices flowing with your words. Download and present our Shapes PowerPoint Templates because You can Be the star of the show with our PowerPoint Templates and Slides. Rock the stage with your ideas.Use these PowerPoint slides for presentations relating to Website, network, statistics, item, junction, corporate, business, plan, presentation, template, diagram, circle, brochure, data, process, report, marketing, different, management, graph, modern, illustration, connection, chart, sphere, options, strategy, catalog, world, spherical, segments, text, information, structure, parts, communication. The prominent colors used in the PowerPoint template are Blue, Black, Gray.

Radio Aerials Earth PowerPoint Themes And PowerPoint Slides 0411
Microsoft PowerPoint Theme and Slide with satellite aerial globe

Customer Texting Platforms Dashboard Indicating Conversation Stats And Sources Details Ideas PDF
This slide showcase customer messaging platform dashboard indicating conversation stats and sources details beneficial for companies to make any changes or improvements in prevailing bulk texts being sent to consumers. It contains information about assigned, unanswered, operators online, average response time, duration of conversation, users, message sources, etc.Showcasing this set of slides titled customer texting platforms dashboard indicating conversation stats and sources details ideas pdf The topics addressed in these templates are total conversations, total assigned, total unanswered All the content presented in this PPT design is completely editable. Download it and make adjustments in color, background, font etc. as per your unique business setting.
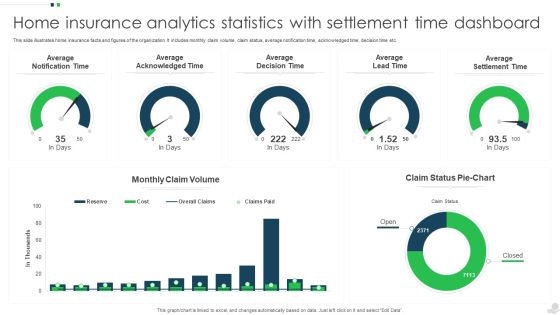
Home Insurance Analytics Statistics With Settlement Time Dashboard Ideas PDF
This slide illustrates home insurance facts and figures of the organization. It includes monthly claim volume, claim status, average notification time, acknowledged time, decision time etc. Pitch your topic with ease and precision using this Home Insurance Analytics Statistics With Settlement Time Dashboard Ideas PDF. This layout presents information on Average Acknowledged Time, Average Decision Time, Average Lead Time. It is also available for immediate download and adjustment. So, changes can be made in the color, design, graphics or any other component to create a unique layout.

SRE Process Flowchart Ppt PowerPoint Presentation Gallery Slides PDF
The following slide showcases the workflow diagram of SRE to clarify functioning. It also includes elements such as reliability objectives, software testing, failure data, reliability tools etc. Persuade your audience using this one. This PPT design covers one stages, thus making it a great tool to use. It also caters to a variety of topics including Set Reliability Objectives, Develop Operational Profile, Perform Software Testing. Download this PPT design now to present a convincing pitch that not only emphasizes the topic but also showcases your presentation skills.

Business Flowchart 3d Man With Blog And Globe PowerPoint Templates
We present our business flowchart 3d man with blog and globe PowerPoint templates.Download our Global PowerPoint Templates because It will Raise the bar of your Thoughts. They are programmed to take you to the next level. Use our People PowerPoint Templates because It can Bubble and burst with your ideas. Download and present our Business PowerPoint Templates because Our PowerPoint Templates and Slides will let you meet your Deadlines. Present our Internet PowerPoint Templates because Our PowerPoint Templates and Slides are aesthetically designed to attract attention. We gaurantee that they will grab all the eyeballs you need. Present our Computer PowerPoint Templates because Our PowerPoint Templates and Slides will let you Hit the right notes. Watch your audience start singing to your tune.Use these PowerPoint slides for presentations relating to 3d, Blog, Character, Communication, Computer, Concepts, Connecting, Continent, Data, Discussion, Earth, Figure, Friendship, Global, Guy, Human, Icon, Idea, Information, Internet, Leadership, Manager, Map, Medium, Men, Message, Network, Page, People, Person, Puppet, Render, Shapes, Sign, Standing, Symbol, Text, Three-Dimensional, Web, Weblog, World, Www. The prominent colors used in the PowerPoint template are Blue, White, Gray. Use our business flowchart 3d man with blog and globe PowerPoint templates will make the presenter successul in his career/life. We assure you our Concepts PowerPoint templates and PPT Slides will make the presenter look like a pro even if they are not computer savvy. Use our business flowchart 3d man with blog and globe PowerPoint templates will save the presenter time. Customers tell us our Continent PowerPoint templates and PPT Slides have awesome images to get your point across. Presenters tell us our business flowchart 3d man with blog and globe PowerPoint templates are topically designed to provide an attractive backdrop to any subject. PowerPoint presentation experts tell us our Character PowerPoint templates and PPT Slides are designed by a team of presentation professionals.

Project Limitations Dashboard With Cost And Time Graphics PDF
This slide showcases dashboard to track key metrics necessary for project success and effective management of constraints. It includes elements such as health, tasks, progress, workload, etc. Pitch your topic with ease and precision using this Project Limitations Dashboard With Cost And Time Graphics PDF. This layout presents information on Time, Workload, Tasks, Progress. It is also available for immediate download and adjustment. So, changes can be made in the color, design, graphics or any other component to create a unique layout.
Multiple Projects Progress Tracking Report Management Dashboard With Duration Summary PDF
This slide shows the dashboard representing status of various projects which would be helpful in project management. It shows information related to project status, tasks status, milestones completed, upcoming milestones, critical tasks, projects names along with their start and end date, duration etc.Pitch your topic with ease and precision using this Multiple Projects Progress Tracking Report Management Dashboard With Duration Summary PDF. This layout presents information on Start Date, Finish Date, Percent Complete. It is also available for immediate download and adjustment. So, changes can be made in the color, design, graphics or any other component to create a unique layout.

3d Circular Layout Diagram 5 Stages Network Marketing Business Plan PowerPoint Slides
We present our 3d circular layout diagram 5 stages network marketing business plan PowerPoint Slides.Download and present our Process and Flows PowerPoint Templates because You should Bet on your luck with our PowerPoint Templates and Slides. Be assured that you will hit the jackpot. Present our Flow Charts PowerPoint Templates because You can safely bank on our PowerPoint Templates and Slides. They will provide a growth factor to your valuable thoughts. Download and present our Ring Charts PowerPoint Templates because Our PowerPoint Templates and Slides will let your team Walk through your plans. See their energy levels rise as you show them the way. Present our Marketing PowerPoint Templates because Our PowerPoint Templates and Slides help you meet the demand of the Market. Just browse and pick the slides that appeal to your intuitive senses. Download our Success PowerPoint Templates because you can Add colour to your speech with our PowerPoint Templates and Slides. Your presentation will leave your audience speechless.Use these PowerPoint slides for presentations relating to Account, accounting, analyzing, business, calculate, chart, circle, concept, data, diagram, display, division, economy, five, finance, financial, graph, graphic, growth, illustration, information, market, marketing, part, partition, percentage, performance, pie, piece, planning, portion,presentation, profit, progress, report, round, sales, shape, slice, statistic, stock, success, survey, symbol, wealth. The prominent colors used in the PowerPoint template are Purple, Green lime, Blue light.

Managing Hybrid Waterfall Business Approach Project Dashboard Summary PDF
This slide illustrates agile key performance indicators for individual sprints. It includes tasks, story points, bugs, burndown charts, statistics etc. Showcasing this set of slides titled Managing Hybrid Waterfall Business Approach Project Dashboard Summary PDF. The topics addressed in these templates are Tasks, Story Points, Bugs. All the content presented in this PPT design is completely editable. Download it and make adjustments in color, background, font etc. as per your unique business setting.
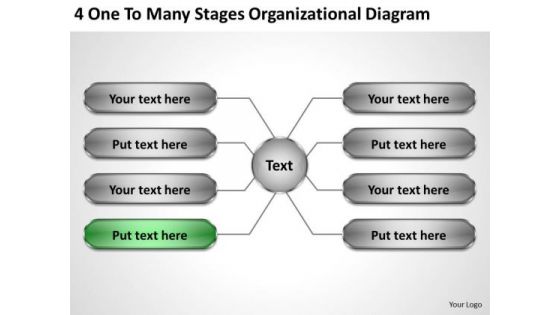
Sales Concepts 4 One To Many Stages Organizational Diagram Ppt Business Strategy Development
We present our sales concepts 4 one to many stages organizational diagram ppt business strategy development.Download our Business PowerPoint Templates because You are an avid believer in ethical practices. Highlight the benefits that accrue with our PowerPoint Templates and Slides. Download and present our Marketing PowerPoint Templates because our bewitching PowerPoint Templates and Slides will delight your audience with the magic of your words. Present our Finance PowerPoint Templates because You can Stir your ideas in the cauldron of our PowerPoint Templates and Slides. Cast a magic spell on your audience. Download and present our Circle Charts PowerPoint Templates because our PowerPoint Templates and Slides are the string of your bow. Fire of your ideas and conquer the podium. Download and present our Process and Flows PowerPoint Templates because You aspire to touch the sky with glory. Let our PowerPoint Templates and Slides provide the fuel for your ascent.Use these PowerPoint slides for presentations relating to diagram, process, plan, parts, vector, graph, business, boxes, wheel, network, statistics, item, junction, corporate, arrow, presentation, template, circle, brochure, data, report, marketing, different, management, multicolored, modern, illustration, three, pie, connection, chart, sphere, options, strategy, catalog, spherical, segments, schematic, tab, company, banner, menu, information, note, navigation, structure, communication. The prominent colors used in the PowerPoint template are Green, Gray, Black.

Monthly Project Progress Report Dashboard With Assigned Tasks Ppt Styles Clipart PDF
This slide showcases monthly project status dashboard with assigned tasks. It provides information about kick off meeting, resource plan, technical requests, development, hardware configuration, budget, pending items, etc. Pitch your topic with ease and precision using this Monthly Project Progress Report Dashboard With Assigned Tasks Ppt Styles Clipart PDF. This layout presents information on Pending Items, Budget, Kick Off Meeting. It is also available for immediate download and adjustment. So, changes can be made in the color, design, graphics or any other component to create a unique layout.
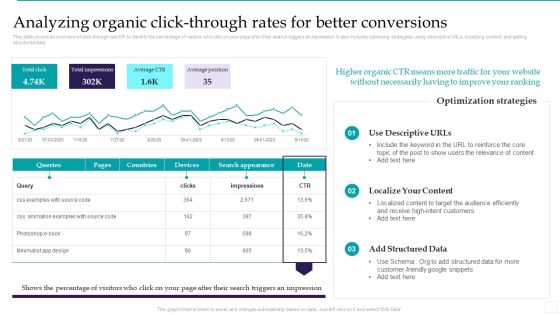
Optimizing Marketing Analytics To Enhance Organizational Growth Analyzing Organic Click Through Rates Elements PDF
This slide covers an overview of click through rate KPI to identify the percentage of visitors who click on your page after their search triggers an impression. It also includes optimizing strategies, using descriptive URLs, localizing content, and adding structured data. This Optimizing Marketing Analytics To Enhance Organizational Growth Analyzing Organic Click Through Rates Elements PDF from Slidegeeks makes it easy to present information on your topic with precision. It provides customization options, so you can make changes to the colors, design, graphics, or any other component to create a unique layout. It is also available for immediate download, so you can begin using it right away. Slidegeeks has done good research to ensure that you have everything you need to make your presentation stand out. Make a name out there for a brilliant performance.
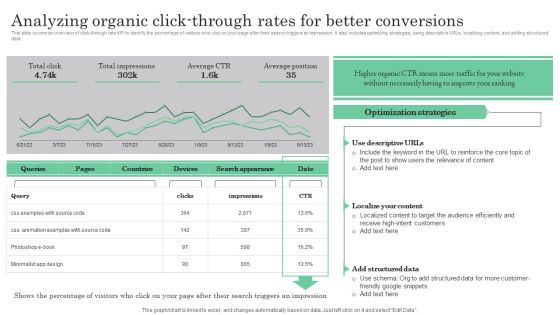
Online Marketing Analytics To Enhance Business Growth Analyzing Organic Click Through Rates For Better Guidelines PDF
This slide covers an overview of click-through rate KPI to identify the percentage of visitors who click on your page after their search triggers an impression. It also includes optimizing strategies, using descriptive URLs, localizing content, and adding structured data. Boost your pitch with our creative Online Marketing Analytics To Enhance Business Growth Analyzing Organic Click Through Rates For Better Guidelines PDF. Deliver an awe-inspiring pitch that will mesmerize everyone. Using these presentation templates you will surely catch everyones attention. You can browse the ppts collection on our website. We have researchers who are experts at creating the right content for the templates. So you do not have to invest time in any additional work. Just grab the template now and use them.
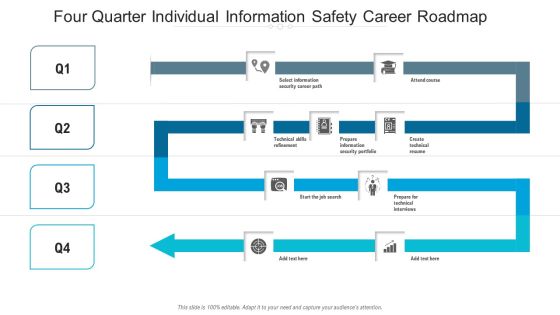
Four Quarter Individual Information Safety Career Roadmap Diagrams
We present our four quarter individual information safety career roadmap diagrams. This PowerPoint layout is easy to edit so you can change the font size, font type, color, and shape conveniently. In addition to this, the PowerPoint layout is Google Slides compatible, so you can share it with your audience and give them access to edit it. Therefore, download and save this well researched four quarter individual information safety career roadmap diagrams in different formats like PDF, PNG, and JPG to smoothly execute your business plan.
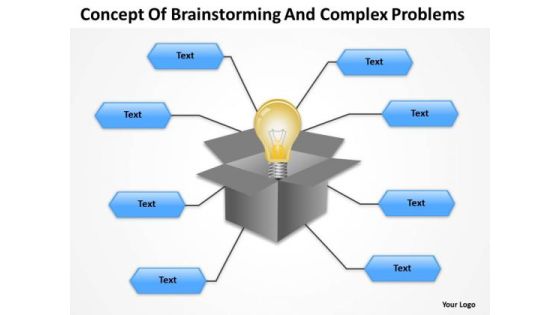
Organization Chart Template Concept Of Brainstormingand Complex Problems PowerPoint Templates
We present our organization chart template concept of brainstormingand complex problems powerpoint templates.Download our Technology PowerPoint Templates because Our PowerPoint Templates and Slides will let Your superior ideas hit the target always and everytime. Use our Marketing PowerPoint Templates because Timeline crunches are a fact of life. Meet all deadlines using our PowerPoint Templates and Slides. Download our Arrows PowerPoint Templates because Our PowerPoint Templates and Slides will give good value for money. They also have respect for the value of your time. Download and present our Light Bulbs PowerPoint Templates because Our PowerPoint Templates and Slides will let your words and thoughts hit bullseye everytime. Download our Business PowerPoint Templates because Our PowerPoint Templates and Slides will give you great value for your money. Be assured of finding the best projection to highlight your words. Use these PowerPoint slides for presentations relating to Chart, flow, organization, flowchart, diagram, sitemap, process, box, arrow, graph, business, light bulb, data, design, important, rectangle, corporate, plan, president, concept, hierarchy, glossy, teamwork, tier, chain, supervisor, relation, steps, glassy, connection, ladder, administration, group, connect, organize, connectivity, technology, office, financial, structure, officer, glass. The prominent colors used in the PowerPoint template are Yellow, Blue, Gray.
Multiple Project Progress Tracking Report Dashboard With Key Performance Indicators Brochure PDF
This slide shows the dashboard representing status of various projects and tracking their performance with the help of key performance indicators which are as follows schedule, budget, resources, risk and issues and quality of projects.Pitch your topic with ease and precision using this Multiple Project Progress Tracking Report Dashboard With Key Performance Indicators Brochure PDF. This layout presents information on Risks Issues, Quality Open Defects, Techno Blogger. It is also available for immediate download and adjustment. So, changes can be made in the color, design, graphics or any other component to create a unique layout.

Human Resource Organizational Management Approaches For Workforce Designs PDF
Presenting Human Resource Organizational Management Approaches For Workforce Designs PDF to dispense important information. This template comprises three stages. It also presents valuable insights into the topics including Human Resource Organizational, Management Approaches, Workforce Icon. This is a completely customizable PowerPoint theme that can be put to use immediately. So, download it and address the topic impactfully.

3d Circular Flow Diagram Representing Steps Mini Business Plan PowerPoint Templates
We present our 3d circular flow diagram representing steps mini business plan PowerPoint templates.Download our Finance PowerPoint Templates because let this slide illustrates others piggyback on you to see well over the horizon. Present our Business PowerPoint Templates because this slide will fire away with all the accuracy at your command. Present our Circle Charts PowerPoint Templates because the concept and strategy is your strength. Download our Flow charts PowerPoint Templates because this slide is an excellent backdrop for you to enlighten your audience on the process you have gone through and the vision you have for the future. Download and present our Arrows PowerPoint Templates because this PPt slide helps you to measure key aspects of the current process and collect relevant data.Use these PowerPoint slides for presentations relating to Arrow, Business, Chain, Chart, Circle, Circle, Frame, Color, Concept, Connect, Connection, Connectivity, Corporate, Data, Design, Diagram, Financial, Flow, Flowchart, Graph, Graphical, Group, Important, Organization, Organize, Plan, Process, Rectangle, Relation, Set, Steps, Structure, Teamwork. The prominent colors used in the PowerPoint template are Yellow, Gray, Black. Professionals tell us our 3d circular flow diagram representing steps mini business plan PowerPoint templates are Nifty. We assure you our Color PowerPoint templates and PPT Slides are Wistful. People tell us our 3d circular flow diagram representing steps mini business plan PowerPoint templates are Clever. Customers tell us our Chart PowerPoint templates and PPT Slides are Festive. Use our 3d circular flow diagram representing steps mini business plan PowerPoint templates will save the presenter time. We assure you our Concept PowerPoint templates and PPT Slides are Pleasant.
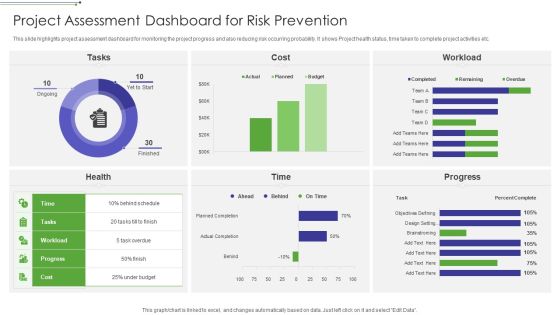
Project Assessment Dashboard For Risk Prevention Clipart PDF
This slide highlights project assessment dashboard for monitoring the project progress and also reducing risk occurring probability. It shows Project health status, time taken to complete project activities etc.Showcasing this set of slides titled Project Assessment Dashboard For Risk Prevention Clipart PDF The topics addressed in these templates are Project Assessment, Dashboard For Risk Prevention All the content presented in this PPT design is completely editable. Download it and make adjustments in color, background, font etc. as per your unique business setting.
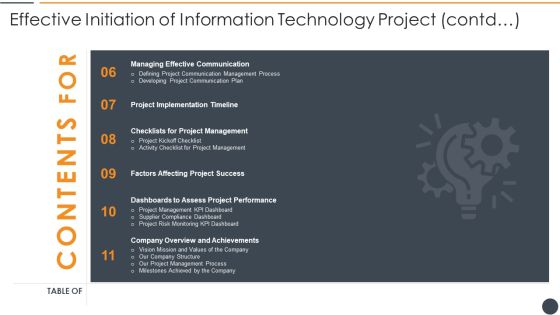
Effective Initiation Of Information Technology Project Contd Table Of Contents Themes PDF
This is a effective initiation of information technology project contd table of contents themes pdf template with various stages. Focus and dispense information on eleven stages using this creative set, that comes with editable features. It contains large content boxes to add your information on topics like managing effective communication, project implementation timeline, dashboards to assess project performance. You can also showcase facts, figures, and other relevant content using this PPT layout. Grab it now.
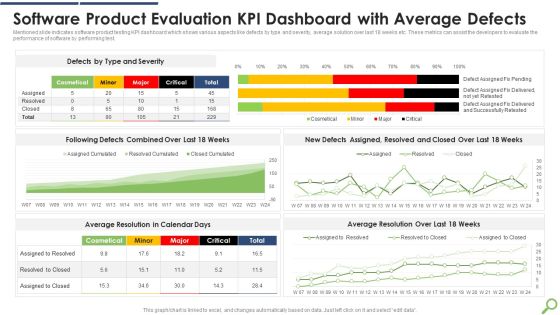
Software Product Evaluation KPI Dashboard With Average Defects Infographics PDF
Mentioned slide indicates software product testing KPI dashboard which shows various aspects like defects by type and severity, average solution over last 18 weeks etc. These metrics can assist the developers to evaluate the performance of software by performing test.Showcasing this set of slides titled Software Product Evaluation KPI Dashboard With Average Defects Infographics PDF The topics addressed in these templates are Software Product, Evaluation Dashboard, Average Defects All the content presented in this PPT design is completely editable. Download it and make adjustments in color, background, font etc. as per your unique business setting.

Cobots Global Statistics Dashboard To Track Cobot Performance Mockup PDF
This slide represents the cobots performance dashboard by covering details of battery level, performance, total hours, average time, time to return, energy consumption, and so on. If you are looking for a format to display your unique thoughts, then the professionally designed Cobots Global Statistics Dashboard To Track Cobot Performance Mockup PDF is the one for you. You can use it as a Google Slides template or a PowerPoint template. Incorporate impressive visuals, symbols, images, and other charts. Modify or reorganize the text boxes as you desire. Experiment with shade schemes and font pairings. Alter, share or cooperate with other people on your work. Download Cobots Global Statistics Dashboard To Track Cobot Performance Mockup PDF and find out how to give a successful presentation. Present a perfect display to your team and make your presentation unforgettable.
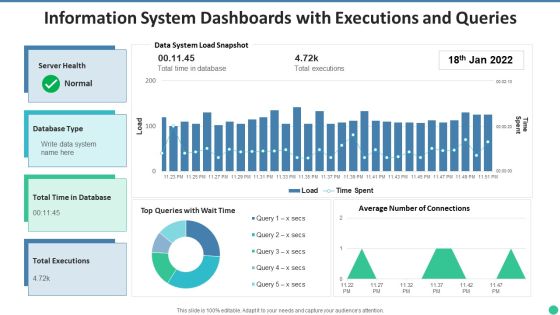
Information System Dashboards With Executions And Queries Topics PDF
Showcasing this set of slides titled information system dashboards with executions and queries topics pdf. The topics addressed in these templates are information system dashboards with executions and queries. All the content presented in this PPT design is completely editable. Download it and make adjustments in color, background, font etc. as per your unique business setting.

Ppt Concepts Of Circular Procedure 7 Phase Diagram PowerPoint Templates
PPT concepts of circular procedure 7 phase diagram PowerPoint Templates-This PowerPoint Diagram shows you the Circular Interpretation of the process which includes seven phases. This Diagram can be used for the Presentation on art, arrow, bright, calendar, chart, circle, circular, clip, clipart, collection, graphic, illustration, isolated, menu, process, round. -PPT concepts of circular procedure 7 phase diagram PowerPoint Templates-7Arrows, Art, Background, Beautiful, Bright, Business, Circle, Collection, Color, Colorful, Concentric, Concept, Decoration, Design, Icon, Illustration, Image, Isolated, Light, Pattern, Pie, Red, Render, Round, Sample, Shape, Solution, Style, Success, Symbol, Technology, Wheel

Project Overview Dashboard With Budget And Task Completion Progress Slides PDF
This slide elaborates about the project of the web development and its status on every step with budget allocation and the number of tasks completed or will be completing in certain amount of time. Showcasing this set of slides titled Project Overview Dashboard With Budget And Task Completion Progress Slides PDF. The topics addressed in these templates are Project Title, Budget, Risks. All the content presented in this PPT design is completely editable. Download it and make adjustments in color, background, font etc. as per your unique business setting.

Impact Of Marketing Strategies On Business Performance Ppt PowerPoint Presentation Diagram Lists PDF
The following slide showcases the positive outcome of marketing strategies on companys performance. Post-implementing marketing strategies company recorded significant increase in brand awareness rate, sales and profit, market share, and customer retention rate. The Impact Of Marketing Strategies On Business Performance Ppt PowerPoint Presentation Diagram Lists PDF is a compilation of the most recent design trends as a series of slides. It is suitable for any subject or industry presentation, containing attractive visuals and photo spots for businesses to clearly express their messages. This template contains a variety of slides for the user to input data, such as structures to contrast two elements, bullet points, and slides for written information. Slidegeeks is prepared to create an impression.

Digitalized Business Checklist Need Of Appointing Chief Digital Officer Diagrams PDF
This slide covers details about the requirement of Chief Digital Officer which will be considered as important in digital advancement of firm as he plays vital role in increasing firms digital capabilities. The Digitalized Business Checklist Need Of Appointing Chief Digital Officer Diagrams PDF is a compilation of the most recent design trends as a series of slides. It is suitable for any subject or industry presentation, containing attractive visuals and photo spots for businesses to clearly express their messages. This template contains a variety of slides for the user to input data, such as structures to contrast two elements, bullet points, and slides for written information. Slidegeeks is prepared to create an impression.

3 Stages Stacked Shapes Chart Ppt How To Type Business Plan PowerPoint Slides
We present our 3 stages stacked shapes chart ppt how to type business plan PowerPoint Slides.Present our Business PowerPoint Templates because Our PowerPoint Templates and Slides will let you Leave a lasting impression to your audiences. They possess an inherent longstanding recall factor. Present our Venn Diagrams PowerPoint Templates because You should Bet on your luck with our PowerPoint Templates and Slides. Be assured that you will hit the jackpot. Download and present our Layers PowerPoint Templates because Our PowerPoint Templates and Slides will give good value for money. They also have respect for the value of your time. Download and present our Circle Charts PowerPoint Templates because Your ideas provide food for thought. Our PowerPoint Templates and Slides will help you create a dish to tickle the most discerning palate. Download our Shapes PowerPoint Templates because You canTake a leap off the starting blocks with our PowerPoint Templates and Slides. They will put you ahead of the competition in quick time.Use these PowerPoint slides for presentations relating to diagram, process, business, graphic, design, ideas, model, data, chart, project, schema, corporate, implementation, tag, plan, engineering, concept, vector, success, symbol, stack, circle, guide, work flow, development, shape, team, management, cycle, steps, illustration, system, strategy, objects, phase, professional, organization, implement, background, image, detail, structure, product. The prominent colors used in the PowerPoint template are Blue, Gray, White.

Customer Need Assessment Kpi Dashboard Infographics PDF
The following slide highlights the spas to assess customers changing needs and make strategies to improve. It consists of NPS, responses, weekly variations in needs, positive and negative feedback etc. Showcasing this set of slides titled customer need assessment kpi dashboard infographics pdf. The topics addressed in these templates are customer need assessment kpi dashboard. All the content presented in this PPT design is completely editable. Download it and make adjustments in color, background, font etc. as per your unique business setting.
Product Management Team Performance Tracking KPI Dashboard Pictures PDF
This slide provides performance tracking dashboard for product development project team. It provides information regarding hours spent on project, deadlines, employee responsible, new leads and revenue generated. Pitch your topic with ease and precision using this Product Management Team Performance Tracking KPI Dashboard Pictures PDF. This layout presents information on Tracking KPI Dashboard, Product Management Team Performance. It is also available for immediate download and adjustment. So, changes can be made in the color, design, graphics or any other component to create a unique layout.
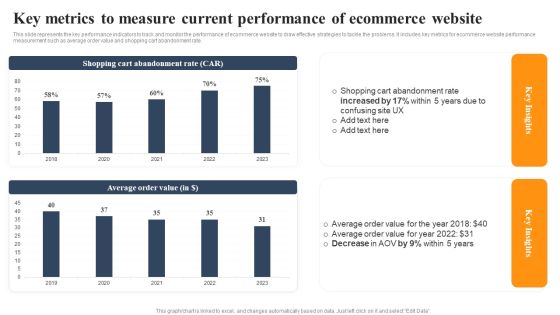
Implementing An Effective Ecommerce Management Framework Key Metrics Current Performance Of Ecommerce Website Slides PDF
This slide represents the key performance indicators to track and monitor the performance of ecommerce website to draw effective strategies to tackle the problems. It includes key metrics for ecommerce website performance measurement such as average order value and shopping cart abandonment rate. The Implementing An Effective Ecommerce Management Framework Key Metrics Current Performance Of Ecommerce Website Slides PDF is a compilation of the most recent design trends as a series of slides. It is suitable for any subject or industry presentation, containing attractive visuals and photo spots for businesses to clearly express their messages. This template contains a variety of slides for the user to input data, such as structures to contrast two elements, bullet points, and slides for written information. Slidegeeks is prepared to create an impression.

3d Homogeneous Puzzle Flow 6 Issue Chart Maker PowerPoint Slides
We present our 3d homogeneous puzzle flow 6 issue chart maker PowerPoint Slides. Use our Business PowerPoint Templates because, Marketing Strategy Business Template: - Maximizing sales of your product is the intended destination. Use our Puzzles or Jigsaws PowerPoint Templates because, At times, however, there is a crucial aspect that requires extra attention. Use our Shapes PowerPoint Templates because; motivate your team to cross all barriers. Use our Communication PowerPoint Templates because; Show them how to persistently hit bulls eye. Use our Process and Flows PowerPoint Templates because, Build on your foundation or prepare for change ahead to enhance the future. Use these PowerPoint slides for presentations relating to abstract, action, attach, box, business, center, chain, chart, color, communication, concept, connection, cube, cycle, data, diagram, flow, globe, horizontal, idea, illustration, individual, information, interaction, jigsaw, join pieces, process puzzle, relationship, shape, success. The prominent colors used in the PowerPoint template are Blue, Gray, and Black
Project Implementation Tactics Dashboard For Performance Tracking Demonstration PDF
The following slide presents dashboard which establishes means to execute , monitor and control projects effectively. It includes information about different quarters and work percentage. Showcasing this set of slides titled Project Implementation Tactics Dashboard For Performance Tracking Demonstration PDF. The topics addressed in these templates are Resource Plan, System Testing, Performance Tracking. All the content presented in this PPT design is completely editable. Download it and make adjustments in color, background, font etc. as per your unique business setting.
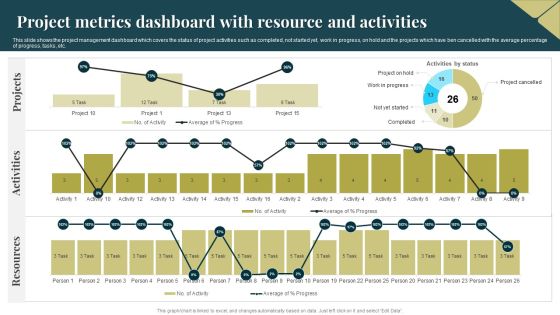
Project Metrics Dashboard With Resource And Activities Infographics PDF
This slide shows the project management dashboard which covers the status of project activities such as completed, not started yet, work in progress, on hold and the projects which have ben cancelled with the average percentage of progress, tasks, etc. Showcasing this set of slides titled Project Metrics Dashboard With Resource And Activities Infographics PDF. The topics addressed in these templates are Activities, Projects, Resources. All the content presented in this PPT design is completely editable. Download it and make adjustments in color, background, font etc. as per your unique business setting.
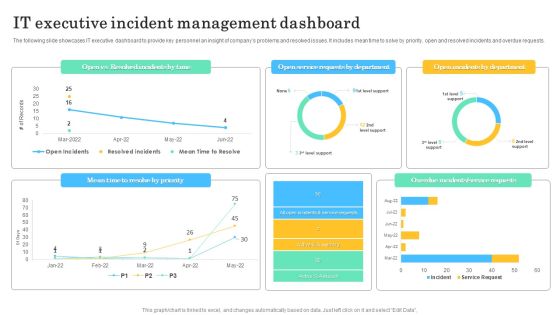
IT Executive Incident Management Dashboard Microsoft PDF
The following slide showcases IT executive dashboard to provide key personnel an insight of companys problems and resolved issues. It includes mean time to solve by priority, open and resolved incidents and overdue requests. Pitch your topic with ease and precision using this IT Executive Incident Management Dashboard Microsoft PDF. This layout presents information on IT Executive Incident, Management Dashboard. It is also available for immediate download and adjustment. So, changes can be made in the color, design, graphics or any other component to create a unique layout.

Project Metrics Dashboard With Budget Allocation Portrait PDF
This slide focuses on the project management dashboard which covers the description of tasks which are not yet started, work in progress, completed, projects that are on hold, cancelled with the issues and its status such as requested, approved, planning, in progress, etc. Showcasing this set of slides titled Project Metrics Dashboard With Budget Allocation Portrait PDF. The topics addressed in these templates are Projects, Resource, Allocated Budget. All the content presented in this PPT design is completely editable. Download it and make adjustments in color, background, font etc. as per your unique business setting.
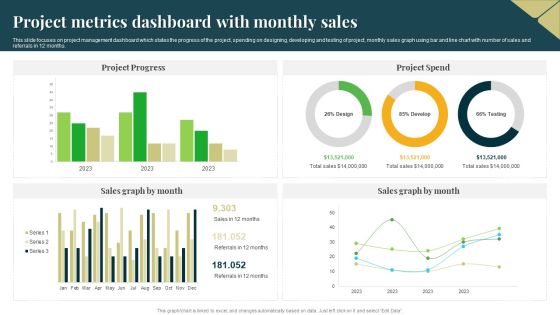
Project Metrics Dashboard With Monthly Sales Professional PDF
This slide focuses on project management dashboard which states the progress of the project, spending on designing, developing and testing of project, monthly sales graph using bar and line chart with number of sales and referrals in 12 months. Pitch your topic with ease and precision using this Project Metrics Dashboard With Monthly Sales Professional PDF. This layout presents information on Project Progress, Project Spend, Sales Graph. It is also available for immediate download and adjustment. So, changes can be made in the color, design, graphics or any other component to create a unique layout.


 Continue with Email

 Home
Home


