Data Analysis Icon
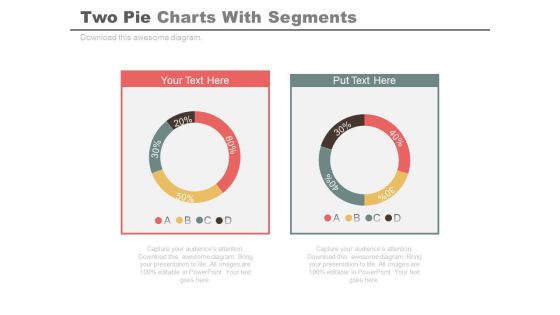
Two Pie Charts For Comparison And Analysis Powerpoint Slides
Develop competitive advantage with our above template of two pie charts. This PowerPoint diagram provides an effective way of displaying business information. You can edit text, color, shade and style as per you need.

Bar Graph For Yearly Statistical Analysis Powerpoint Slides
This PowerPoint template has been designed with bar graph. This PowerPoint diagram is useful to exhibit yearly statistical analysis. This diagram slide can be used to make impressive presentations.

Bar Graph With Yearly Statistical Analysis Powerpoint Slides
This PowerPoint template contains diagram of bar graph with yearly percentage ratios. You may download this slide to display statistical analysis. You can easily customize this template to make it more unique as per your need.
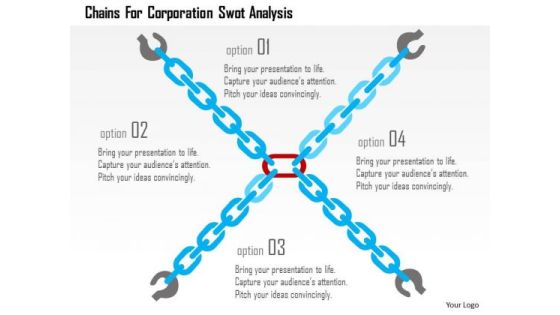
Business Diagram Chains For Corporation Swot Analysis Presentation Template
This image is designed with four interconnected chains graphics. You can use this slide to present SWOT analysis. This diagram provides an effective way of displaying information you can edit text, color, shade and style as per you need. Present your views using this innovative slide and be assured of leaving a lasting impression

Business Diagram 3d Magnifier For Swot Analysis Presentation Template
This business diagram displays magnifier graphic for SWOT analysis. This power point template can be used for SWOT analysis. Use this slide to make professional presentations.
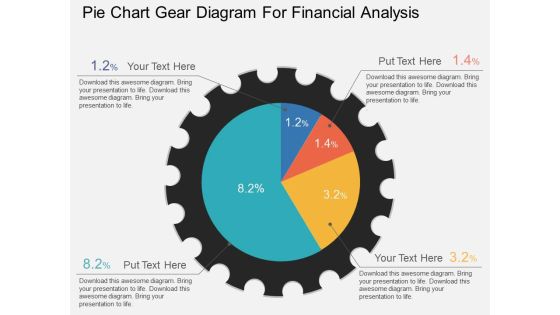
Pie Chart Gear Diagram For Financial Analysis Powerpoint Template
This PowerPoint template has been designed with graphic of pie chart gear diagram. This PPT slide can be used to display financial analysis. Download this PPT diagram slide to make your presentations more effective.

Circle Chart With Percentage Value Analysis Powerpoint Slides
This PowerPoint template has been designed with circular process diagram. This business diagram helps to exhibit financial process control and analysis. Use this diagram to visually support your content.

Venn Circles Infographic For Financial Analysis PowerPoint Templates
This PowerPoint template has been designed with Venn circles infographic. This infographic template useful for financial analysis. Accelerate the impact of your ideas using this template.

Business Diagram Four Points Of Swot Analysis Presentation Template
Our above business diagram has been designed with graphics of SWOT analysis. This slide is suitable to present SWOT analysis. Use this business diagram to present your work in a more smart and precise manner.

Pie Chart For Financial Ratio Analysis Powerpoint Slides
This PPT slide contains graphics of eight stage pie chart. Download this PowerPoint template slide for financial ratio analysis. This diagram is editable you can edit text, color, shade and style as per you need.

Four Text Boxes For Swot Analysis Powerpoint Slides
This PPT slide has been designed with graphics of four steps text boxes diagram. This business diagram helps to exhibit SWOT analysis. Use this PowerPoint template to build an exclusive presentation.

Pie Chart For Financial Ratio Analysis PowerPoint Templates
Create visually amazing presentations with this slide of pie chart. This PPT slide of pie chart for financial ratio analysis. Add this diagram in your presentations to visually support your content.
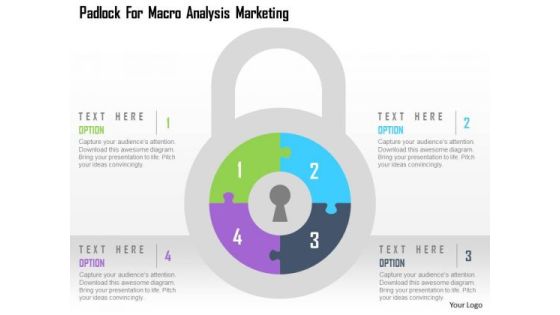
Business Diagram Padlock For Macro Analysis Marketing Presentation Template
This business diagram has been designed graphics of padlock displaying four options. This diagram helps to depict macro analysis. Download this diagram slide to make professional presentations.

Business Diagram Four Gears For Swot Analysis Presentation Template
This business slide displays graphics of four gears. Download this diagram to present SWOT analysis. Enlighten your audience with your breathtaking ideas.
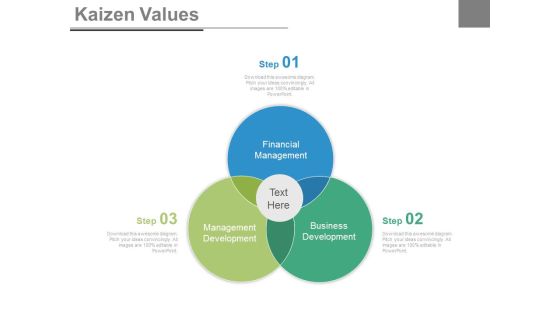
Venn Diagram For Kaizen Values Analysis Powerpoint Slides
This power point template has been designed with graphic of Venn diagram. Use this Venn diagram to display kaizen value analysis. Illustrate your ideas and imprint them in the minds of your team with this template.

Circular Diagram For Business Deal And Growth Analysis Powerpoint Template
This PowerPoint template has been designed with graphics of circular diagram. You may download this PPT diagram slide to display business deal and growth analysis. Chart the course you intend to take with this slide
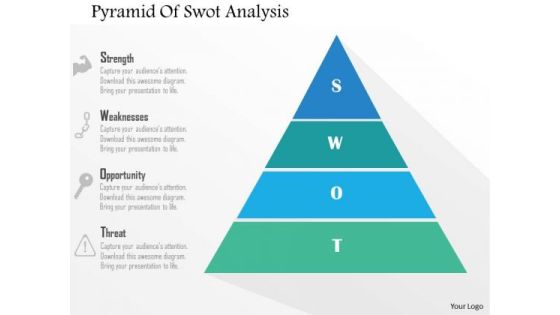
Business Diagram Pyramid Of Swot Analysis Presentation Template
Our above business slide displays pyramid diagram. You may use this diagram for presentations on SWOT analysis. Grab the attention of your listeners with this professional slide.

Business Diagram Infographic For Business Analysis Presentation Template
This business diagram contains business infographic. Our professionally designed business diagram helps to depict business analysis. Enlighten your audience with your breathtaking ideas.

Infographic Diagram For Business Process Analysis Powerpoint Slides
This PowerPoint slide contains business infographic diagram. This professional slide may be used to display business process analysis. Use this business template to make impressive presentations.
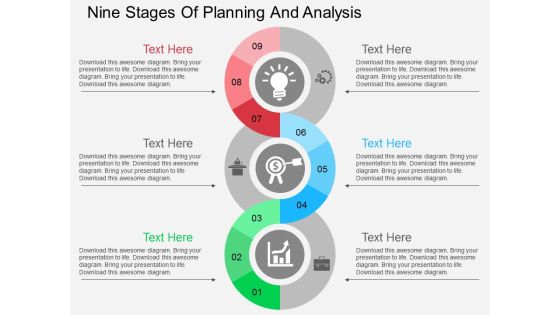
Nine Stages Of Planning And Analysis Powerpoint Templates
Our above business diagram has been designed with spiral info graphic diagram. This slide is suitable to present planning and analysis. Use this business diagram to present your work in a more smart and precise manner.

Big Data Types Unstructured Data Ppt PowerPoint Presentation Diagram Lists PDF
This slide depicts the unstructured data form of big data and how it can be any form such as videos, audio, likes, and comments. Deliver and pitch your topic in the best possible manner with this Big Data Types Unstructured Data Ppt PowerPoint Presentation Diagram Lists PDF. Use them to share invaluable insights on Unorganized Information, Social Media, Systems and impress your audience. This template can be altered and modified as per your expectations. So, grab it now.

Pie Chart On Magnifying Glass For Business Analysis PowerPoint Template
Visually support your presentation with our above template showing pie chart on magnifying glass. This slide has been professionally designed to emphasize the concept of market research and analysis. Deliver amazing presentations to mesmerize your audience.

Four Infographic Tags For Global Agenda Analysis Powerpoint Template
This business PowerPoint slide displays four infographic tags. This diagram is suitable to exhibit global agenda analysis. Download this PPT slide to make impressive presentations.

Bar Graph For Year Based Analysis Powerpoint Slides
This PowerPoint template has been designed with year based bar graph. This diagram may be used to display yearly statistical analysis. Use this PPT slide design to make impressive presentations.

World Map For Global Business Analysis Powerpoint Slides
This professionally designed PowerPoint template displays diagram of world map. You can download this diagram to exhibit global business analysis. Above PPT slide is suitable for business presentation.

Finger Print Circuit For Security Analysis Powerpoint Template
This PowerPoint template has been designed with finder print circuit diagram. Download this diagram to display technology and security analysis. Download this diagram slide to make impressive yet unique presentations.

Business Diagram Test Tubes For Research And Analysis Presentation Template
This diagram is suitable for research and analysis. This diagram template contains the graphic of test tubes. Adjust the above diagram into your Presentations to visually support your contents.
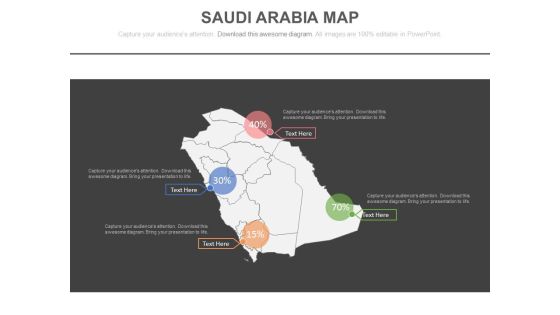
Saudi Arabia Map For Financial Strategy Analysis Powerpoint Slides
This PowerPoint template has been designed with Saudi Arabia Map. You may use this slide to display financial strategy analysis. This diagram provides an effective way of displaying information you can edit text, color, shade and style as per you need.
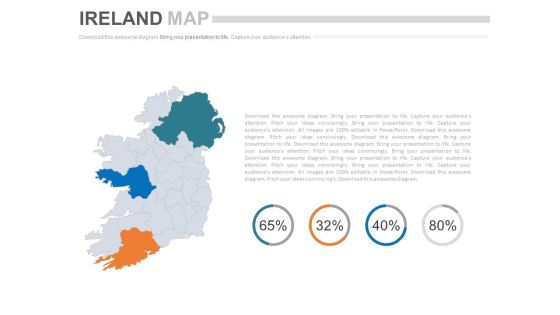
Ireland Map With Financial Ratio Analysis Powerpoint Slides
This PowerPoint template has been designed with Ireland Map and areas highlighted. You may use this slide to display financial strategy analysis. This diagram provides an effective way of displaying information you can edit text, color, shade and style as per you need.

Map Of India With Population Analysis Powerpoint Slides
This PowerPoint template has been designed with graphics of India map. You may use this slide to display population analysis. This diagram provides an effective way of displaying information you can edit text, color, shade and style as per you need.

Test Tubes And Beaker For Ratio Analysis Powerpoint Template
Visually support your presentation with our above template containing diagram of test tubes and beaker. This diagram is excellent visual tools for explaining ratio analysis. Use this diagram to make interactive presentations.

Business Diagram Colorful Gear For Swot Analysis Presentation Template
This business slide has been designed with graphics of colorful gear divided into four parts. Download this diagram to present SWOT analysis. Cement your ideas in the minds of your listeners with this slide.

Five Year Tags Analysis Timeline Diagram Powerpoint Slides
This PowerPoint template has been designed with five years tags. This PPT slide may be helpful to display year based business analysis. Download this PowerPoint timeline template to make impressive presentations.
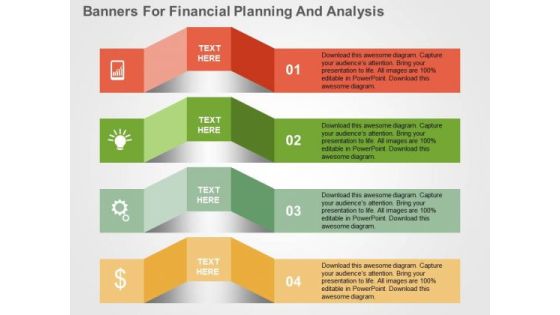
Banners For Financial Planning And Analysis PowerPoint Template
Visually support your presentation with our above template illustrating diagram of banners. It contains graphics of concepts of financial planning and analysis. Etch your views in the brains of your audience with this diagram slide.

Three Teams Skill Analysis Comparison Chart Powerpoint Slides
Create visually stunning and define your PPT presentations in a unique and inspiring manner using our above template. It contains graphics of comparison chart. This business slide helps to display teams skill analysis. Deliver amazing presentations to mesmerize your audience by using this PPT slide design.

Business Meeting For Planning And Analysis Powerpoint Template
Graphic of business meeting has been used to design this power point template diagram. This PPT diagram contains the concept of business planning and analysis. Use this PPT diagram for business and marketing related presentations.

Five Bars For Marketing Research And Analysis Powerpoint Template
This business slide contains diagram of five colorful bars. This diagram provides schematic representation of marketing research and analysis. Visual effect this slide helps in maintaining the flow of the discussion and provides more clarity to the subject.

Bar Graph For Profit Growth Analysis Powerpoint Slides
This PowerPoint template has been designed with bar graph with percentage values. This diagram is useful to exhibit profit growth analysis. This diagram slide can be used to make impressive presentations.

Associated Data IT Importance To Publish 5 Stars Linked Data Template PDF
This slide describes the importance of publishing five stars linked data, where five stars mean your data is linked with other available information throughout the internet, four stars mean detection of each object and making content easily discoverable, and so on. Deliver an awe inspiring pitch with this creative Associated Data IT Importance To Publish 5 Stars Linked Data Template PDF bundle. Topics like Uniform Resource, Internet, Material can be discussed with this completely editable template. It is available for immediate download depending on the needs and requirements of the user.

Fish Bone For Cause And Effect Analysis PowerPoint Templates
This PPT slide has been designed with graphic fish bone diagram. Download this fishbone slide to present cause and effect analysis. Accelerate the impact of your ideas using this image.
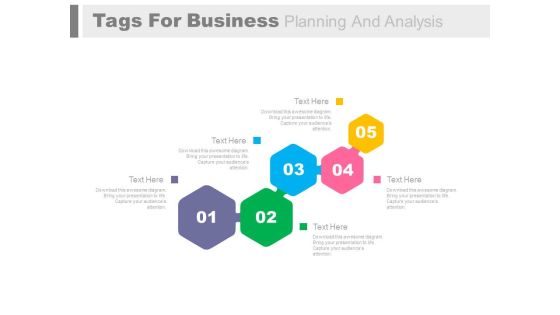
Five Steps For Business Process And Analysis Powerpoint Slides
Five steps process flow have been displayed in this business slide. This business diagram helps to exhibit business process and analysis. Use PowerPoint template to build an exclusive presentation.
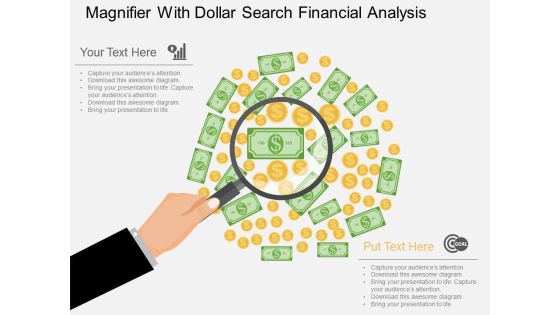
Magnifier With Dollar Search Financial Analysis Powerpoint Template
Our above business slide contains graphics of magnifier on dollar notes. This diagram can be used to display dollar search and financial analysis. Capture the attention of your audience with this professional slide.

Four Tags For Financial Review And Analysis Powerpoint Slides
This PowerPoint template has been designed with four tags and financial values. This PowerPoint template helps to exhibit financial review and analysis. Use this diagram slide to build an exclusive presentation.

World Map With Global Economic Analysis Powerpoint Slides
This PowerPoint template has been designed with graphics of world map. You can download this diagram to exhibit global business analysis. Above PPT slide is suitable for business presentation.

Bar Graph On Blackboard For Growth Analysis Powerpoint Template
Visually support your presentation with our above template containing bar graph on blackboard. This PowerPoint template helps to display growth analysis. Etch your views in the brains of your audience with this diagram slide.

Industry Analysis To Understand Business Position Among Competitors Diagrams PDF
This slide provides overview of industry analysis, evaluating business culture of competitors to understand business position among relative participants in market. It includes key components such as employee retention rate, recruitment cost, employee satisfaction rate and employee turnover rate. great for business strategies, office conferences, capital raising or task suggestions. If you desire to acquire more customers for your tech business and ensure they stay satisfied, create your own sales presentation with these plain slides.

Business Target Analysis Timeline With Year Tags Powerpoint Slides
This timeline slide design can be used for project planning and project management. It contains time line diagram with years tags. This timeline template can be used in presentations where you need to display a roadmap or it may be used for business target analysis.

Four Staged Linear Timeline For Growth Analysis Powerpoint Slides
This timeline slide design can be used to display yearly business growth. It contains timeline diagram with four years. This timeline template can be used in presentations where you need to display a roadmap or it may be used for business target analysis.
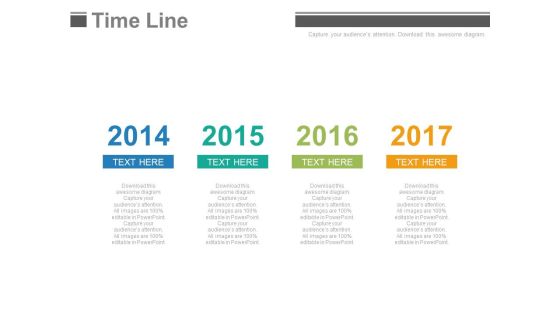
Year Base Timeline For Business Strategy And Analysis Powerpoint Slides
This PowerPoint template has been designed with year based timeline diagram. This timeline template can be used in presentations where you need to display business strategy and analysis. You can modify the template like add new milestones and tasks, or change the colors and shapes.

Year Based Linear Timeline For Sales Analysis Powerpoint Slides
This PowerPoint template has been designed with linear timeline diagram. This timeline template can be used in presentations where you need to display sales planning and analysis. You can modify the template like add new milestones and tasks, or change the colors and shapes.

Data Governance IT Benefits Of Process Oriented Data Stewardship Model Diagrams PDF
This slide represents the benefits of the process oriented data stewardship model that includes data stewardship considered a natural extension, a robust model to establish data stewardship, and easy to assess the information quality. Create an editable Data Governance IT Benefits Of Process Oriented Data Stewardship Model Diagrams PDF that communicates your idea and engages your audience. Whether you are presenting a business or an educational presentation, pre designed presentation templates help save time. Data Governance IT Benefits Of Process Oriented Data Stewardship Model Diagrams PDF is highly customizable and very easy to edit, covering many different styles from creative to business presentations. Slidegeeks has creative team members who have crafted amazing templates. So, go and get them without any delay.
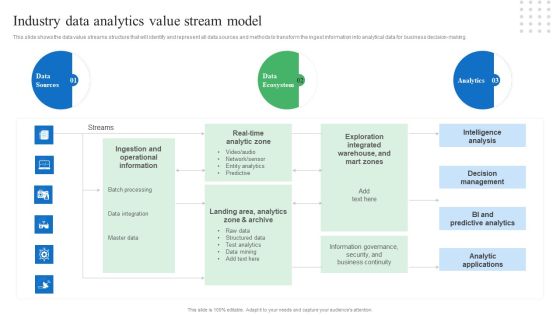
Toolkit For Data Science And Analytics Transition Industry Data Analytics Value Stream Model Brochure PDF
This slide shows the data value streams structure that will identify and represent all data sources and methods to transform the ingest information into analytical data for business decision-making. Whether you have daily or monthly meetings, a brilliant presentation is necessary. Toolkit For Data Science And Analytics Transition Industry Data Analytics Value Stream Model Brochure PDF can be your best option for delivering a presentation. Represent everything in detail using Toolkit For Data Science And Analytics Transition Industry Data Analytics Value Stream Model Brochure PDF and make yourself stand out in meetings. The template is versatile and follows a structure that will cater to your requirements. All the templates prepared by Slidegeeks are easy to download and edit. Our research experts have taken care of the corporate themes as well. So, give it a try and see the results.

Tablet For Finance Planning And Analysis PowerPoint Template
Our professionally designed business diagram is as an effective tool for communicating ideas and planning. It contains graphics of tablet with various symbols. Convey your views with this diagram slide. It will amplify the strength of your logic.
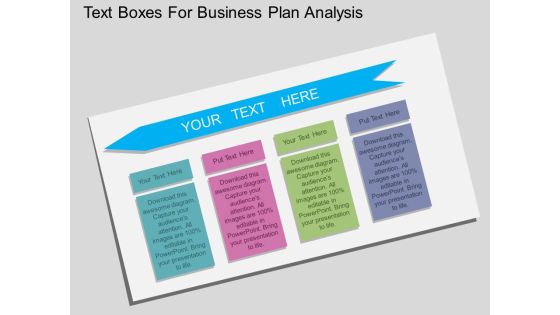
Text Boxes For Business Plan Analysis Powerpoint Template
This PowerPoint template contains diagram of four text boxes. You may download this slide to present quick marketing plan. Use this PPT diagram slide to organize the logic of your views.
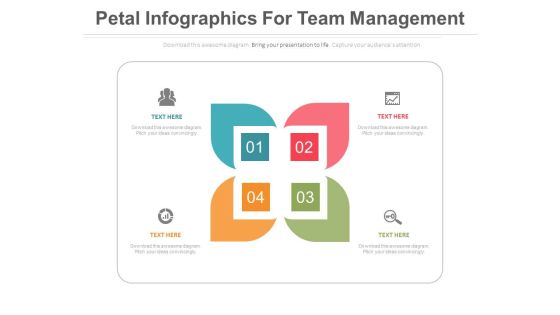
Petal Infographics For Value Chain Analysis Powerpoint Template
This business slide contains diagram of petals infographic. This diagram provides schematic representation of any information. Visual effect this slide helps in maintaining the flow of the discussion and provides more clarity to the subject.

Bar Graph With Line Chart For Analysis Powerpoint Slides
This PowerPoint template contains design of bar graph with line chart. You may download this slide to display strategy steps for business growth. You can easily customize this template to make it more unique as per your need.
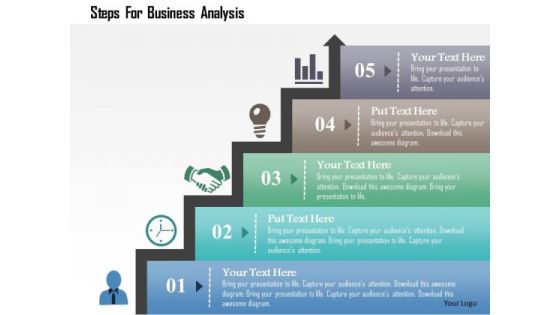
Business Diagram Steps For Business Analysis Presentation Template
Concept of time management has been defined in this power point template diagram. This diagram contains the graphic of bar graph. Amplify your thoughts via this appropriate business template.

Benefits Cost Analysis Chart Ppt Powerpoint Presentation Summary Visuals
This is a balance scale with cost and benefits ppt powerpoint presentation show. This is a two stage process. The stages in this process are business, finance, marketing, strategy, compare, management.

Circle Infographics For Market Research Analysis Powerpoint Template
This PowerPoint template has been designed with circular infographic diagram. You can use this PPT diagram slide to visually support your content. Above slide is suitable for business presentation.

Five Vertical Steps For Agenda Analysis Powerpoint Slides
This PPT slide contains five vertical steps diagram. Download this PowerPoint template to depict agenda points in informative and descriptive manner. Deliver amazing presentations to mesmerize your audience by using this agenda slide design.
 Home
Home