Data Analysis Icon
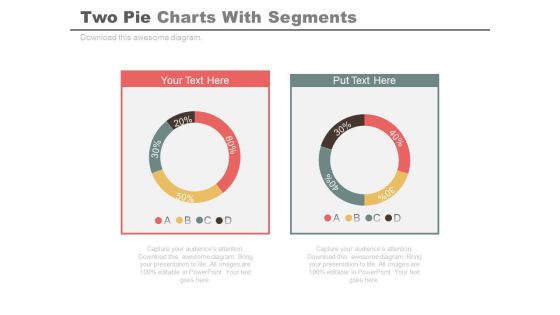
Two Pie Charts For Comparison And Analysis Powerpoint Slides
Develop competitive advantage with our above template of two pie charts. This PowerPoint diagram provides an effective way of displaying business information. You can edit text, color, shade and style as per you need.

Bar Graph For Yearly Statistical Analysis Powerpoint Slides
This PowerPoint template has been designed with bar graph. This PowerPoint diagram is useful to exhibit yearly statistical analysis. This diagram slide can be used to make impressive presentations.

Bar Graph With Yearly Statistical Analysis Powerpoint Slides
This PowerPoint template contains diagram of bar graph with yearly percentage ratios. You may download this slide to display statistical analysis. You can easily customize this template to make it more unique as per your need.
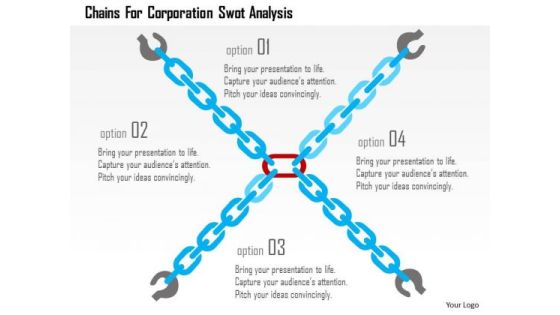
Business Diagram Chains For Corporation Swot Analysis Presentation Template
This image is designed with four interconnected chains graphics. You can use this slide to present SWOT analysis. This diagram provides an effective way of displaying information you can edit text, color, shade and style as per you need. Present your views using this innovative slide and be assured of leaving a lasting impression

Business Diagram 3d Magnifier For Swot Analysis Presentation Template
This business diagram displays magnifier graphic for SWOT analysis. This power point template can be used for SWOT analysis. Use this slide to make professional presentations.
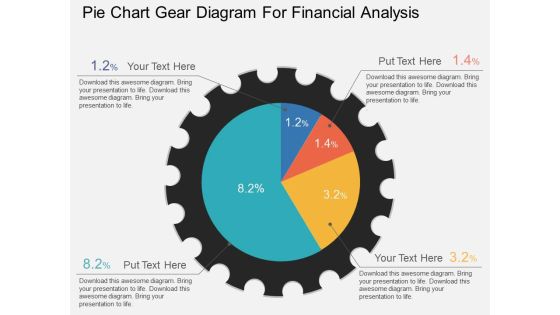
Pie Chart Gear Diagram For Financial Analysis Powerpoint Template
This PowerPoint template has been designed with graphic of pie chart gear diagram. This PPT slide can be used to display financial analysis. Download this PPT diagram slide to make your presentations more effective.

Circle Chart With Percentage Value Analysis Powerpoint Slides
This PowerPoint template has been designed with circular process diagram. This business diagram helps to exhibit financial process control and analysis. Use this diagram to visually support your content.

Venn Circles Infographic For Financial Analysis PowerPoint Templates
This PowerPoint template has been designed with Venn circles infographic. This infographic template useful for financial analysis. Accelerate the impact of your ideas using this template.

Business Diagram Four Points Of Swot Analysis Presentation Template
Our above business diagram has been designed with graphics of SWOT analysis. This slide is suitable to present SWOT analysis. Use this business diagram to present your work in a more smart and precise manner.

Pie Chart For Financial Ratio Analysis Powerpoint Slides
This PPT slide contains graphics of eight stage pie chart. Download this PowerPoint template slide for financial ratio analysis. This diagram is editable you can edit text, color, shade and style as per you need.

Four Text Boxes For Swot Analysis Powerpoint Slides
This PPT slide has been designed with graphics of four steps text boxes diagram. This business diagram helps to exhibit SWOT analysis. Use this PowerPoint template to build an exclusive presentation.

Pie Chart For Financial Ratio Analysis PowerPoint Templates
Create visually amazing presentations with this slide of pie chart. This PPT slide of pie chart for financial ratio analysis. Add this diagram in your presentations to visually support your content.
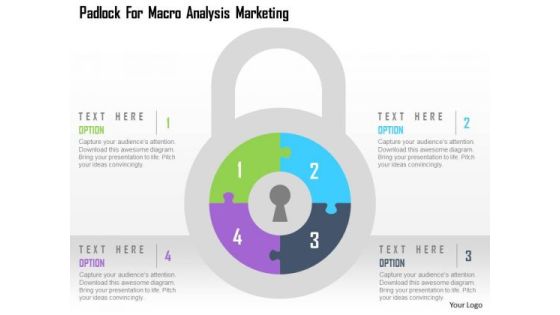
Business Diagram Padlock For Macro Analysis Marketing Presentation Template
This business diagram has been designed graphics of padlock displaying four options. This diagram helps to depict macro analysis. Download this diagram slide to make professional presentations.

Business Diagram Four Gears For Swot Analysis Presentation Template
This business slide displays graphics of four gears. Download this diagram to present SWOT analysis. Enlighten your audience with your breathtaking ideas.
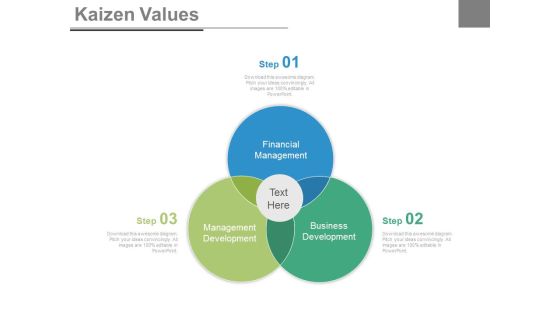
Venn Diagram For Kaizen Values Analysis Powerpoint Slides
This power point template has been designed with graphic of Venn diagram. Use this Venn diagram to display kaizen value analysis. Illustrate your ideas and imprint them in the minds of your team with this template.

Circular Diagram For Business Deal And Growth Analysis Powerpoint Template
This PowerPoint template has been designed with graphics of circular diagram. You may download this PPT diagram slide to display business deal and growth analysis. Chart the course you intend to take with this slide
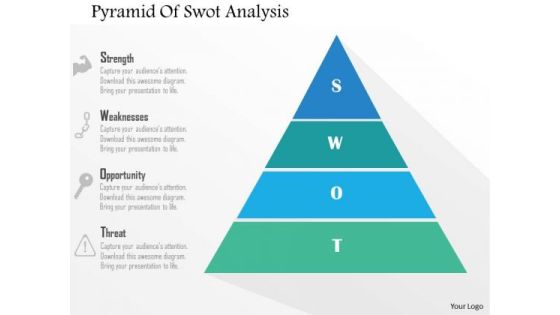
Business Diagram Pyramid Of Swot Analysis Presentation Template
Our above business slide displays pyramid diagram. You may use this diagram for presentations on SWOT analysis. Grab the attention of your listeners with this professional slide.

Business Diagram Infographic For Business Analysis Presentation Template
This business diagram contains business infographic. Our professionally designed business diagram helps to depict business analysis. Enlighten your audience with your breathtaking ideas.

Infographic Diagram For Business Process Analysis Powerpoint Slides
This PowerPoint slide contains business infographic diagram. This professional slide may be used to display business process analysis. Use this business template to make impressive presentations.
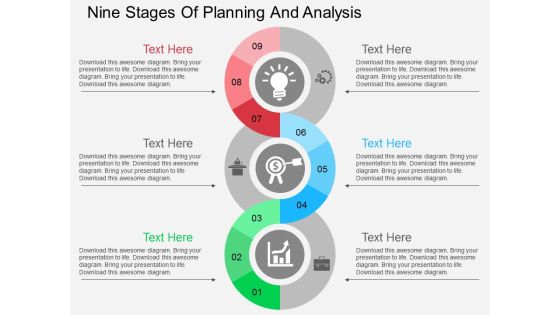
Nine Stages Of Planning And Analysis Powerpoint Templates
Our above business diagram has been designed with spiral info graphic diagram. This slide is suitable to present planning and analysis. Use this business diagram to present your work in a more smart and precise manner.

Big Data Types Unstructured Data Ppt PowerPoint Presentation Diagram Lists PDF
This slide depicts the unstructured data form of big data and how it can be any form such as videos, audio, likes, and comments. Deliver and pitch your topic in the best possible manner with this Big Data Types Unstructured Data Ppt PowerPoint Presentation Diagram Lists PDF. Use them to share invaluable insights on Unorganized Information, Social Media, Systems and impress your audience. This template can be altered and modified as per your expectations. So, grab it now.

Pie Chart On Magnifying Glass For Business Analysis PowerPoint Template
Visually support your presentation with our above template showing pie chart on magnifying glass. This slide has been professionally designed to emphasize the concept of market research and analysis. Deliver amazing presentations to mesmerize your audience.

Four Infographic Tags For Global Agenda Analysis Powerpoint Template
This business PowerPoint slide displays four infographic tags. This diagram is suitable to exhibit global agenda analysis. Download this PPT slide to make impressive presentations.

Bar Graph For Year Based Analysis Powerpoint Slides
This PowerPoint template has been designed with year based bar graph. This diagram may be used to display yearly statistical analysis. Use this PPT slide design to make impressive presentations.

World Map For Global Business Analysis Powerpoint Slides
This professionally designed PowerPoint template displays diagram of world map. You can download this diagram to exhibit global business analysis. Above PPT slide is suitable for business presentation.

Finger Print Circuit For Security Analysis Powerpoint Template
This PowerPoint template has been designed with finder print circuit diagram. Download this diagram to display technology and security analysis. Download this diagram slide to make impressive yet unique presentations.

Business Diagram Test Tubes For Research And Analysis Presentation Template
This diagram is suitable for research and analysis. This diagram template contains the graphic of test tubes. Adjust the above diagram into your Presentations to visually support your contents.
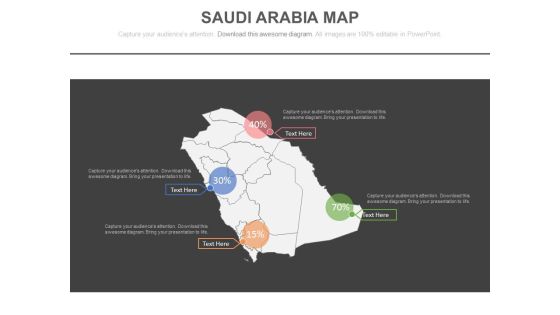
Saudi Arabia Map For Financial Strategy Analysis Powerpoint Slides
This PowerPoint template has been designed with Saudi Arabia Map. You may use this slide to display financial strategy analysis. This diagram provides an effective way of displaying information you can edit text, color, shade and style as per you need.
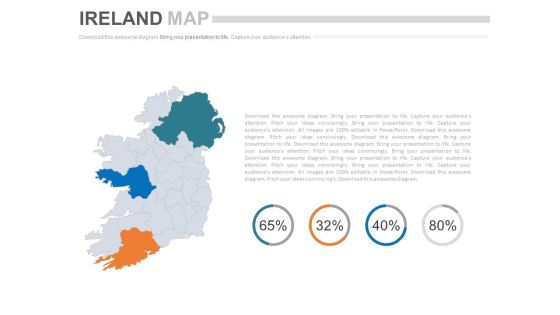
Ireland Map With Financial Ratio Analysis Powerpoint Slides
This PowerPoint template has been designed with Ireland Map and areas highlighted. You may use this slide to display financial strategy analysis. This diagram provides an effective way of displaying information you can edit text, color, shade and style as per you need.

Map Of India With Population Analysis Powerpoint Slides
This PowerPoint template has been designed with graphics of India map. You may use this slide to display population analysis. This diagram provides an effective way of displaying information you can edit text, color, shade and style as per you need.

Test Tubes And Beaker For Ratio Analysis Powerpoint Template
Visually support your presentation with our above template containing diagram of test tubes and beaker. This diagram is excellent visual tools for explaining ratio analysis. Use this diagram to make interactive presentations.

Business Diagram Colorful Gear For Swot Analysis Presentation Template
This business slide has been designed with graphics of colorful gear divided into four parts. Download this diagram to present SWOT analysis. Cement your ideas in the minds of your listeners with this slide.

Five Year Tags Analysis Timeline Diagram Powerpoint Slides
This PowerPoint template has been designed with five years tags. This PPT slide may be helpful to display year based business analysis. Download this PowerPoint timeline template to make impressive presentations.
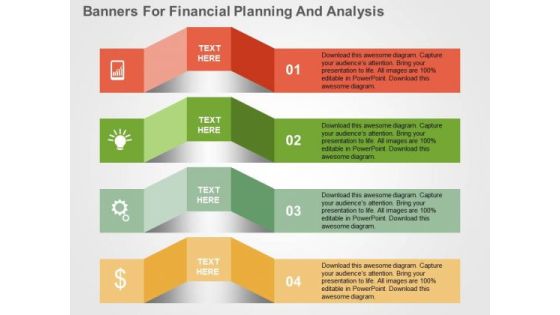
Banners For Financial Planning And Analysis PowerPoint Template
Visually support your presentation with our above template illustrating diagram of banners. It contains graphics of concepts of financial planning and analysis. Etch your views in the brains of your audience with this diagram slide.

Three Teams Skill Analysis Comparison Chart Powerpoint Slides
Create visually stunning and define your PPT presentations in a unique and inspiring manner using our above template. It contains graphics of comparison chart. This business slide helps to display teams skill analysis. Deliver amazing presentations to mesmerize your audience by using this PPT slide design.

Business Meeting For Planning And Analysis Powerpoint Template
Graphic of business meeting has been used to design this power point template diagram. This PPT diagram contains the concept of business planning and analysis. Use this PPT diagram for business and marketing related presentations.

Five Bars For Marketing Research And Analysis Powerpoint Template
This business slide contains diagram of five colorful bars. This diagram provides schematic representation of marketing research and analysis. Visual effect this slide helps in maintaining the flow of the discussion and provides more clarity to the subject.

Bar Graph For Profit Growth Analysis Powerpoint Slides
This PowerPoint template has been designed with bar graph with percentage values. This diagram is useful to exhibit profit growth analysis. This diagram slide can be used to make impressive presentations.

Associated Data IT Importance To Publish 5 Stars Linked Data Template PDF
This slide describes the importance of publishing five stars linked data, where five stars mean your data is linked with other available information throughout the internet, four stars mean detection of each object and making content easily discoverable, and so on. Deliver an awe inspiring pitch with this creative Associated Data IT Importance To Publish 5 Stars Linked Data Template PDF bundle. Topics like Uniform Resource, Internet, Material can be discussed with this completely editable template. It is available for immediate download depending on the needs and requirements of the user.

Fish Bone For Cause And Effect Analysis PowerPoint Templates
This PPT slide has been designed with graphic fish bone diagram. Download this fishbone slide to present cause and effect analysis. Accelerate the impact of your ideas using this image.
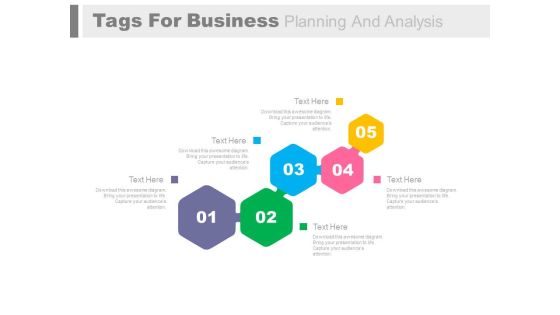
Five Steps For Business Process And Analysis Powerpoint Slides
Five steps process flow have been displayed in this business slide. This business diagram helps to exhibit business process and analysis. Use PowerPoint template to build an exclusive presentation.
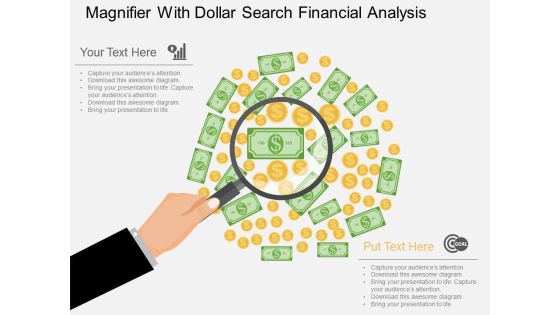
Magnifier With Dollar Search Financial Analysis Powerpoint Template
Our above business slide contains graphics of magnifier on dollar notes. This diagram can be used to display dollar search and financial analysis. Capture the attention of your audience with this professional slide.

Four Tags For Financial Review And Analysis Powerpoint Slides
This PowerPoint template has been designed with four tags and financial values. This PowerPoint template helps to exhibit financial review and analysis. Use this diagram slide to build an exclusive presentation.

World Map With Global Economic Analysis Powerpoint Slides
This PowerPoint template has been designed with graphics of world map. You can download this diagram to exhibit global business analysis. Above PPT slide is suitable for business presentation.

Bar Graph On Blackboard For Growth Analysis Powerpoint Template
Visually support your presentation with our above template containing bar graph on blackboard. This PowerPoint template helps to display growth analysis. Etch your views in the brains of your audience with this diagram slide.

Industry Analysis To Understand Business Position Among Competitors Diagrams PDF
This slide provides overview of industry analysis, evaluating business culture of competitors to understand business position among relative participants in market. It includes key components such as employee retention rate, recruitment cost, employee satisfaction rate and employee turnover rate. great for business strategies, office conferences, capital raising or task suggestions. If you desire to acquire more customers for your tech business and ensure they stay satisfied, create your own sales presentation with these plain slides.

Business Target Analysis Timeline With Year Tags Powerpoint Slides
This timeline slide design can be used for project planning and project management. It contains time line diagram with years tags. This timeline template can be used in presentations where you need to display a roadmap or it may be used for business target analysis.

Four Staged Linear Timeline For Growth Analysis Powerpoint Slides
This timeline slide design can be used to display yearly business growth. It contains timeline diagram with four years. This timeline template can be used in presentations where you need to display a roadmap or it may be used for business target analysis.
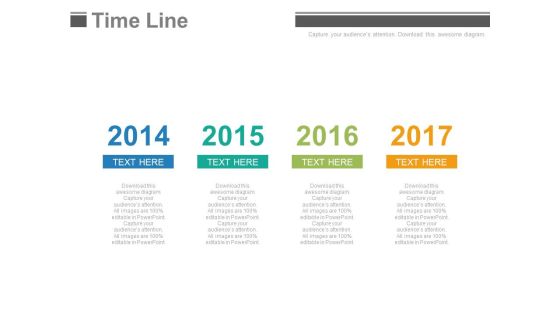
Year Base Timeline For Business Strategy And Analysis Powerpoint Slides
This PowerPoint template has been designed with year based timeline diagram. This timeline template can be used in presentations where you need to display business strategy and analysis. You can modify the template like add new milestones and tasks, or change the colors and shapes.

Year Based Linear Timeline For Sales Analysis Powerpoint Slides
This PowerPoint template has been designed with linear timeline diagram. This timeline template can be used in presentations where you need to display sales planning and analysis. You can modify the template like add new milestones and tasks, or change the colors and shapes.

Data Governance IT Benefits Of Process Oriented Data Stewardship Model Diagrams PDF
This slide represents the benefits of the process oriented data stewardship model that includes data stewardship considered a natural extension, a robust model to establish data stewardship, and easy to assess the information quality. Create an editable Data Governance IT Benefits Of Process Oriented Data Stewardship Model Diagrams PDF that communicates your idea and engages your audience. Whether you are presenting a business or an educational presentation, pre designed presentation templates help save time. Data Governance IT Benefits Of Process Oriented Data Stewardship Model Diagrams PDF is highly customizable and very easy to edit, covering many different styles from creative to business presentations. Slidegeeks has creative team members who have crafted amazing templates. So, go and get them without any delay.
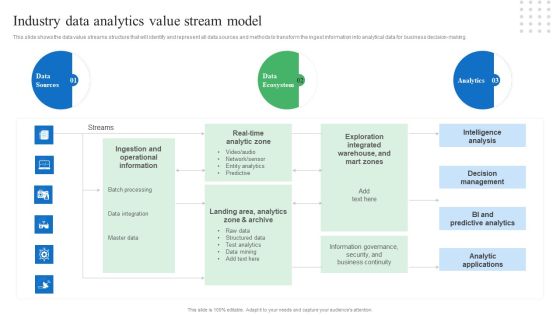
Toolkit For Data Science And Analytics Transition Industry Data Analytics Value Stream Model Brochure PDF
This slide shows the data value streams structure that will identify and represent all data sources and methods to transform the ingest information into analytical data for business decision-making. Whether you have daily or monthly meetings, a brilliant presentation is necessary. Toolkit For Data Science And Analytics Transition Industry Data Analytics Value Stream Model Brochure PDF can be your best option for delivering a presentation. Represent everything in detail using Toolkit For Data Science And Analytics Transition Industry Data Analytics Value Stream Model Brochure PDF and make yourself stand out in meetings. The template is versatile and follows a structure that will cater to your requirements. All the templates prepared by Slidegeeks are easy to download and edit. Our research experts have taken care of the corporate themes as well. So, give it a try and see the results.

Tablet For Finance Planning And Analysis PowerPoint Template
Our professionally designed business diagram is as an effective tool for communicating ideas and planning. It contains graphics of tablet with various symbols. Convey your views with this diagram slide. It will amplify the strength of your logic.
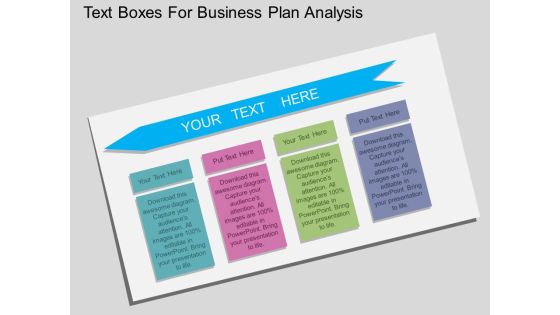
Text Boxes For Business Plan Analysis Powerpoint Template
This PowerPoint template contains diagram of four text boxes. You may download this slide to present quick marketing plan. Use this PPT diagram slide to organize the logic of your views.
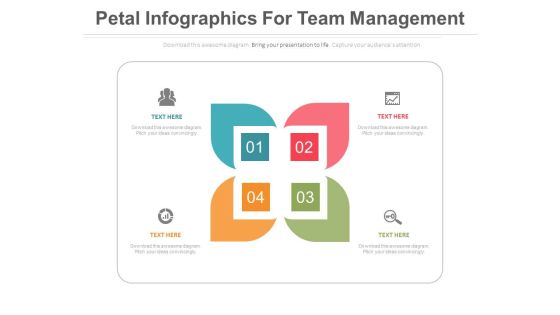
Petal Infographics For Value Chain Analysis Powerpoint Template
This business slide contains diagram of petals infographic. This diagram provides schematic representation of any information. Visual effect this slide helps in maintaining the flow of the discussion and provides more clarity to the subject.

Bar Graph With Line Chart For Analysis Powerpoint Slides
This PowerPoint template contains design of bar graph with line chart. You may download this slide to display strategy steps for business growth. You can easily customize this template to make it more unique as per your need.
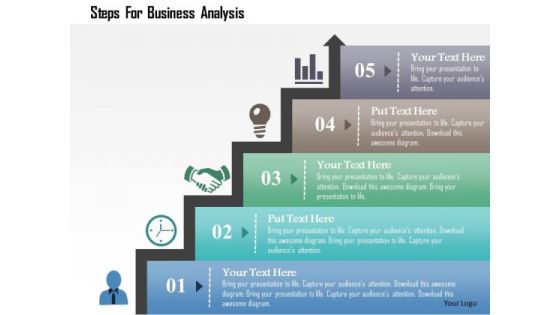
Business Diagram Steps For Business Analysis Presentation Template
Concept of time management has been defined in this power point template diagram. This diagram contains the graphic of bar graph. Amplify your thoughts via this appropriate business template.

Benefits Cost Analysis Chart Ppt Powerpoint Presentation Summary Visuals
This is a balance scale with cost and benefits ppt powerpoint presentation show. This is a two stage process. The stages in this process are business, finance, marketing, strategy, compare, management.

Circle Infographics For Market Research Analysis Powerpoint Template
This PowerPoint template has been designed with circular infographic diagram. You can use this PPT diagram slide to visually support your content. Above slide is suitable for business presentation.

Five Vertical Steps For Agenda Analysis Powerpoint Slides
This PPT slide contains five vertical steps diagram. Download this PowerPoint template to depict agenda points in informative and descriptive manner. Deliver amazing presentations to mesmerize your audience by using this agenda slide design.
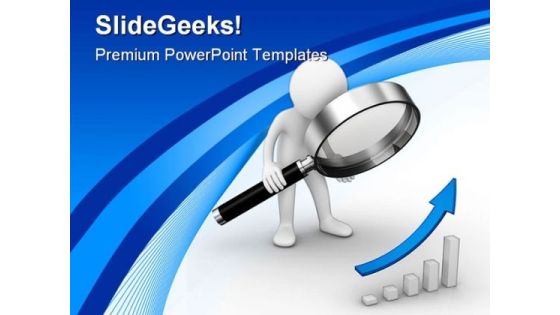
Graph Analysis Arrow Business PowerPoint Themes And PowerPoint Slides 0211
Microsoft PowerPoint Theme and Slide with a man analyzing a graph showing growth

Swot Analysis Business PowerPoint Themes And PowerPoint Slides 0811
Microsoft PowerPoint Theme and slide with a set of project management buttons

How Data Lakehouse Solves Data Lake Challenges Ppt PowerPoint Presentation Diagram Templates PDF
This slide describes how data lakehouse solves data lake challenges through transactional storage layer, comparable data structures, data management capabilities, classical analytics, and so on. Welcome to our selection of the How Data Lakehouse Solves Data Lake Challenges Ppt PowerPoint Presentation Diagram Templates PDF. These are designed to help you showcase your creativity and bring your sphere to life. Planning and Innovation are essential for any business that is just starting out. This collection contains the designs that you need for your everyday presentations. All of our PowerPoints are 100 percent editable, so you can customize them to suit your needs. This multi purpose template can be used in various situations. Grab these presentation templates today.

BI Implementation To Enhance Hiring Process Data Warehouse And Data Marts Business Intelligence Architecture Themes PDF
This slide represents the data warehouse and data marts architecture of business intelligence. It includes key recommendations such as utilized for distributing required information to each department etc.Crafting an eye-catching presentation has never been more straightforward. Let your presentation shine with this tasteful yet straightforward BI Implementation To Enhance Hiring Process Data Warehouse And Data Marts Business Intelligence Architecture Themes PDF template. It offers a minimalistic and classy look that is great for making a statement. The colors have been employed intelligently to add a bit of playfulness while still remaining professional. Construct the ideal BI Implementation To Enhance Hiring Process Data Warehouse And Data Marts Business Intelligence Architecture Themes PDF that effortlessly grabs the attention of your audience Begin now and be certain to wow your customers.
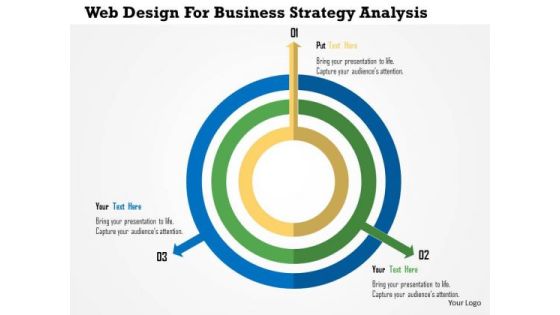
Business Diagram Web Design For Business Strategy Analysis Presentation Template
This business diagram has been designed with concentric circles with three arrows. This slide displays three steps of business process. Download this diagram slide to make professional presentations.

Corporate Vision And Mission Analysis Diagram Powerpoint Slides
This PPT slide contains corporate vision diagram slide. Use this PPT slide to depict companys vision and strategy. This PowerPoint template can be customized as per your requirements.
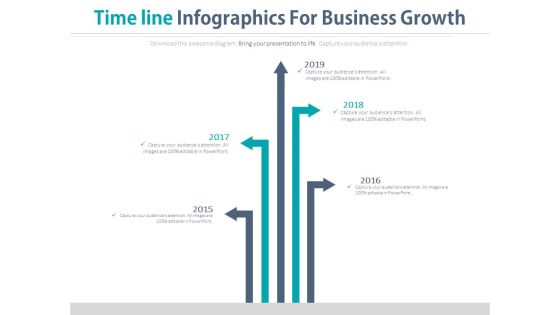
Five Arrows Timeline Diagram For Business Analysis Powerpoint Slides
This arrows timeline template can be used for multiple purposes including business planning, new milestones and tasks. It contains five arrows pointing in different directions. Download this PowerPoint timeline template to make impressive presentations.

Data Structure IT Introduction To Network Data Structuring Technique Diagrams PDF
Formulating a presentation can take up a lot of effort and time, so the content and message should always be the primary focus. The visuals of the PowerPoint can enhance the presenters message, so our Data Structure IT Introduction To Network Data Structuring Technique Diagrams PDF was created to help save time. Instead of worrying about the design, the presenter can concentrate on the message while our designers work on creating the ideal templates for whatever situation is needed. Slidegeeks has experts for everything from amazing designs to valuable content, we have put everything into Data Structure IT Introduction To Network Data Structuring Technique Diagrams PDF.
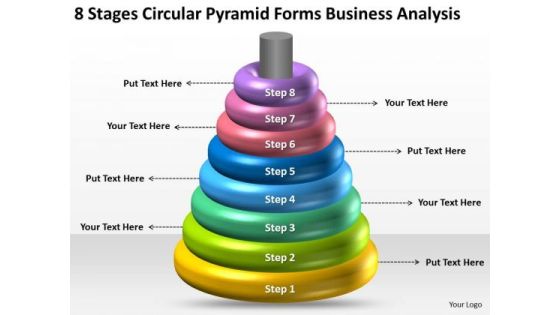
Circular Pyramid Forms Business Analysis Ppt Professional Plans PowerPoint Templates
We present our circular_pyramid_forms_business_analysis_ppt_professional_plans_PowerPoint_templates.Present our Process and Flows PowerPoint Templates because They will Put the wind in your sails. Skim smoothly over the choppy waters of the market. Use our Circle Charts PowerPoint Templates because Our PowerPoint Templates and Slides will definately Enhance the stature of your presentation. Adorn the beauty of your thoughts with their colourful backgrounds. Present our Business PowerPoint Templates because Our PowerPoint Templates and Slides offer you the widest possible range of options. Download and present our Marketing PowerPoint Templates because Watching this your Audience will Grab their eyeballs, they wont even blink. Present our Shapes PowerPoint Templates because Our PowerPoint Templates and Slides are created with admirable insight. Use them and give your group

Management Meeting For Business Agenda Analysis Powerpoint Template
Our professionally designed business diagram is as an effective tool for communicating ideas and planning. It contains diagram of management meeting. Convey innovative ideas relating to business agenda using this PPT slide.

Arrows Matrix For Business Vision Analysis Powerpoint Slides
This PowerPoint template has been designed with arrow matrix diagram. You may download this diagram slide to depict company?s vision, mission, goal and values. Add this slide to your presentation and impress your superiors.
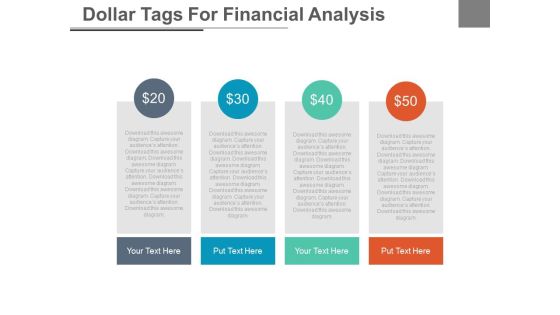
Four Tags With Dollar Values For Financial Analysis Powerpoint Slides
This PowerPoint template has been designed with dollar value pricing table chart. This PPT slide may be used for sample marketing proposal. Download this slide to build unique presentation.
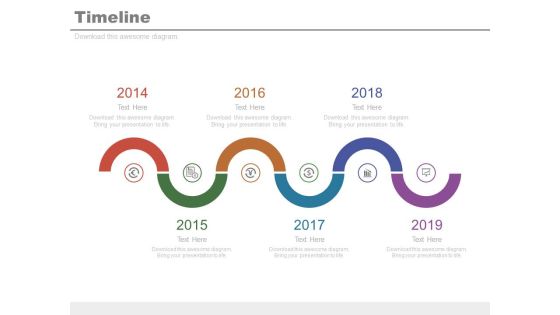
Six Staged Spiral Timeline For Financial Analysis Powerpoint Slides
This infographic template contains graphics of six staged spiral timeline diagram. This PPT slide may be helpful to display financial strategy timeline. Download this PowerPoint timeline template to make impressive presentations.

Timeline Design For Year Based Analysis Powerpoint Slides
This PowerPoint diagram consists of timeline tags design representing planning steps. This PowerPoint template may be used to display when events or steps should happen. This timeline design is most useful for showing important milestones and deadlines.
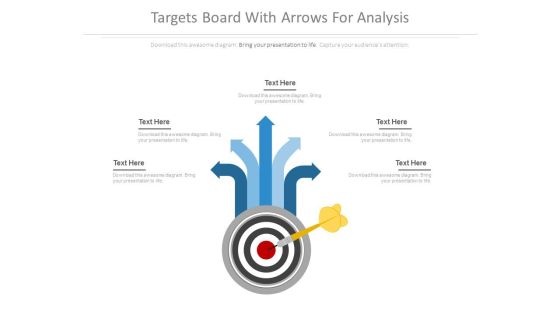
Targets Board With Arrows For Analysis Powerpoint Slides
This PowerPoint template has been designed with target diagram with arrows. Download this slide design for target management development processes. Enlighten others on the process with this innovative PowerPoint template.

Architecture Of Centralized Repository Data Lake Data Lake Creation With Hadoop Cluster Portrait PDF
This slide represents the architecture of the data lake by defining its three major components such as sources, data processing layer, and targets.Are you searching for a Architecture Of Centralized Repository Data Lake Data Lake Creation With Hadoop Cluster Portrait PDF that is uncluttered, straightforward, and original Its easy to edit, and you can change the colors to suit your personal or business branding. For a presentation that expresses how much effort you ve put in, this template is ideal With all of its features, including tables, diagrams, statistics, and lists, its perfect for a business plan presentation. Make your ideas more appealing with these professional slides. Download Architecture Of Centralized Repository Data Lake Data Lake Creation With Hadoop Cluster Portrait PDF from Slidegeeks today.

Data Lineage Methods Role Of Metadata In Data Lineage Process Themes PDF
This slide represents the role of metadata in the data lineage process, including how it collects information about a particular report or ETL process throughout the organization. It provides information about the companys different resources and their connections. Here you can discover an assortment of the finest PowerPoint and Google Slides templates. With these templates, you can create presentations for a variety of purposes while simultaneously providing your audience with an eye-catching visual experience. Download Data Lineage Methods Role Of Metadata In Data Lineage Process Themes PDF to deliver an impeccable presentation. These templates will make your job of preparing presentations much quicker, yet still, maintain a high level of quality. Slidegeeks has experienced researchers who prepare these templates and write high-quality content for you. Later on, you can personalize the content by editing the Data Lineage Methods Role Of Metadata In Data Lineage Process Themes PDF.

Importance To Publish 5 Stars Linked Data Integrating Linked Data To Enhance Operational Effectiveness Summary PDF
This slide describes the importance of publishing five stars-linked data, where five stars mean your data is linked with other available information throughout the internet, four stars mean detection of each object and making content easily discoverable, and so on.Boost your pitch with our creative Importance To Publish 5 Stars Linked Data Integrating Linked Data To Enhance Operational Effectiveness Summary PDF. Deliver an awe-inspiring pitch that will mesmerize everyone. Using these presentation templates you will surely catch everyones attention. You can browse the ppts collection on our website. We have researchers who are experts at creating the right content for the templates. So you do not have to invest time in any additional work. Just grab the template now and use them.

Toolkit For Data Science And Analytics Transition RACI Matrix For Analyzing Data In Project Diagrams PDF
The slide explains the RACI Matrix with the roles on vertical axis and tasks on horizontal axis for executing data analytics project. Explore a selection of the finest Toolkit For Data Science And Analytics Transition RACI Matrix For Analyzing Data In Project Diagrams PDF here. With a plethora of professionally designed and pre made slide templates, you can quickly and easily find the right one for your upcoming presentation. You can use our Toolkit For Data Science And Analytics Transition RACI Matrix For Analyzing Data In Project Diagrams PDF to effectively convey your message to a wider audience. Slidegeeks has done a lot of research before preparing these presentation templates. The content can be personalized and the slides are highly editable. Grab templates today from Slidegeeks.
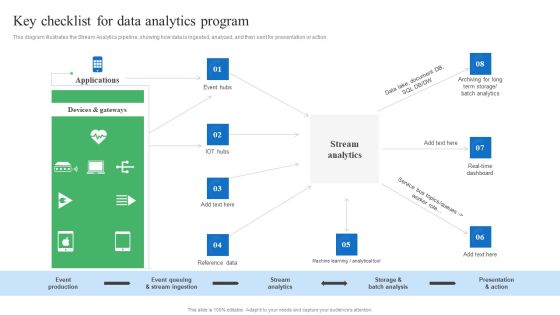
Toolkit For Data Science And Analytics Transition Key Checklist For Data Analytics Program Portrait PDF
This diagram illustrates the Stream Analytics pipeline, showing how data is ingested, analyzed, and then sent for presentation or action. Find highly impressive Toolkit For Data Science And Analytics Transition Key Checklist For Data Analytics Program Portrait PDF on Slidegeeks to deliver a meaningful presentation. You can save an ample amount of time using these presentation templates. No need to worry to prepare everything from scratch because Slidegeeks experts have already done a huge research and work for you. You need to download Toolkit For Data Science And Analytics Transition Key Checklist For Data Analytics Program Portrait PDF for your upcoming presentation. All the presentation templates are 100 percent editable and you can change the color and personalize the content accordingly. Download now.

Comprehensive Customer Data Platform Guide Optimizing Promotional Initiatives Trifecta Successful Customer Data Platform Story Designs PDF
The following slide depicts how CDP platform assisted Trifecta Nutrition to gain desired results and draft marketing messages. It includes elements such as challenges, solutions, outcomes, customized recommendations, analytics, real time metrics, soiled systems etc. Whether you have daily or monthly meetings, a brilliant presentation is necessary. Comprehensive Customer Data Platform Guide Optimizing Promotional Initiatives Trifecta Successful Customer Data Platform Story Designs PDF can be your best option for delivering a presentation. Represent everything in detail using Comprehensive Customer Data Platform Guide Optimizing Promotional Initiatives Trifecta Successful Customer Data Platform Story Designs PDF and make yourself stand out in meetings. The template is versatile and follows a structure that will cater to your requirements. All the templates prepared by Slidegeeks are easy to download and edit. Our research experts have taken care of the corporate themes as well. So, give it a try and see the results.

Data Lineage Implementation Horizontal Vertical And Physical Data Lineage Topics PDF
This slide represents the horizontal, vertical and physical lineage that defines the scope of data lineage. The horizontal lineage is recorded at different data model stages such as conceptual, logical, and physical and vertical lineage refers to the connections between components at these levels. Retrieve professionally designed Data Lineage Implementation Horizontal Vertical And Physical Data Lineage Topics PDF to effectively convey your message and captivate your listeners. Save time by selecting pre made slideshows that are appropriate for various topics, from business to educational purposes. These themes come in many different styles, from creative to corporate, and all of them are easily adjustable and can be edited quickly. Access them as PowerPoint templates or as Google Slides themes. You do not have to go on a hunt for the perfect presentation because Slidegeeks got you covered from everywhere.
Pie Chart For Data Presentation Vector Ppt PowerPoint Presentation Summary Files
Presenting this set of slides with name pie chart for data presentation vector ppt powerpoint presentation summary files. The topics discussed in these slides are data visualization icon, research analysis, business focus. This is a completely editable PowerPoint presentation and is available for immediate download. Download now and impress your audience.

Global Tiktok Users Statistical Data Portrait PDF
This slide shows the statistical data representing the analysis of global TikTok users on TikTok to help marketers to analyze and identify target audience. It shows data related to users of TikTok are youths and millennials. If you are looking for a format to display your unique thoughts, then the professionally designed Global Tiktok Users Statistical Data Portrait PDF is the one for you. You can use it as a Google Slides template or a PowerPoint template. Incorporate impressive visuals, symbols, images, and other charts. Modify or reorganize the text boxes as you desire. Experiment with shade schemes and font pairings. Alter, share or cooperate with other people on your work. Download Global Tiktok Users Statistical Data Portrait PDF and find out how to give a successful presentation. Present a perfect display to your team and make your presentation unforgettable.
Enabling Data Security Risk Management Action Plan Ppt Slides Icon PDF
This slide provide details about data security risk management action plan which will help in keeping the track of potential risks that are existing and what are their level, what are the resources required to handle them. Deliver an awe inspiring pitch with this creative enabling data security risk management action plan ppt slides icon pdf bundle. Topics like risk, security, information, measures, analysis can be discussed with this completely editable template. It is available for immediate download depending on the needs and requirements of the user.

Data Lake Architecture Main Features Of Data Lake For Customer Pictures PDF
This slide represents the main features of data lakes, such as the ability to store structured and unstructured data, infinite scale to store and secure information, link of data to analytics and ML, etc. Deliver an awe inspiring pitch with this creative Data Lake Architecture Main Features Of Data Lake For Customer Pictures PDF bundle. Topics like Organized And Unstructured, Data Analysis, Data Migration, Analytics And Machine Learning Techniques can be discussed with this completely editable template. It is available for immediate download depending on the needs and requirements of the user.

Business Framework Data Flow Diagram PowerPoint Presentation
This image slide displays business framework data flow diagram. Use this image slide to express views on data flow in business presentations. This image slide depicts business strategy plan. You may change color size and orientation of any icon to your liking. This image slide will enhance the quality of presentations.

Issues And Impact Of Failure Mode And Effects Analysis Dashboard Failure Mode Effects Analysis FMEA Clipart PDF
Deliver an awe inspiring pitch with this creative Issues And Impact Of Failure Mode And Effects Analysis Dashboard Failure Mode Effects Analysis FMEA Clipart PDF bundle. Topics like Overdue Recommended, Responsibility Problems, Landing Functionality can be discussed with this completely editable template. It is available for immediate download depending on the needs and requirements of the user.

Analysis Of Grains Fruits And Vegetables Segment In Food Manufacturing Industry Industry Analysis Of Food Demonstration PDF
This slide showcase the market analysis of grains fruits and vegetables in food manufacturing industry providing information regarding top states, total production both weight and value wise, key export destinations and innovations in processing equipment.Formulating a presentation can take up a lot of effort and time, so the content and message should always be the primary focus. The visuals of the PowerPoint can enhance the presenters message, so our Analysis Of Grains Fruits And Vegetables Segment In Food Manufacturing Industry Industry Analysis Of Food Demonstration PDF was created to help save time. Instead of worrying about the design, the presenter can concentrate on the message while our designers work on creating the ideal templates for whatever situation is needed. Slidegeeks has experts for everything from amazing designs to valuable content, we have put everything into Analysis Of Grains Fruits And Vegetables Segment In Food Manufacturing Industry Industry Analysis Of Food Demonstration PDF.

Fishbone Ishikawa Cause And Effect Analysis What Is Cause And Effect Analysis Ppt PowerPoint Presentation Professional Diagrams PDF
Presenting this set of slides with name fishbone ishikawa cause and effect analysis what is cause and effect analysis ppt powerpoint presentation professional diagrams pdf. This is a five stage process. The stages in this process are business, analysts, problem, individuals, relationship. This is a completely editable PowerPoint presentation and is available for immediate download. Download now and impress your audience.

Issues And Impact Of Failure Mode And Effects Analysis Major Steps In Failure Mode And Effects Analysis Process Download PDF
This slide provides the major steps in Failure Mode and Effects Analysis FMEA Process. It covers all the phases from reviewing the process to calculating the resulting RPNs risk priority numbers.This is a Issues And Impact Of Failure Mode And Effects Analysis Major Steps In Failure Mode And Effects Analysis Process Download PDF template with various stages. Focus and dispense information onten stages using this creative set, that comes with editable features. It contains large content boxes to add your information on topics like Process And Assemble, Assign Detection, Occurrence Ranking. You can also showcase facts, figures, and other relevant content using this PPT layout. Grab it now.

Fishbone Ishikawa Cause And Effect Analysis Process Flow Of Cause And Effect Analysis Ppt PowerPoint Presentation Show Design Ideas PDF
Presenting this set of slides with name fishbone ishikawa cause and effect analysis process flow of cause and effect analysis ppt powerpoint presentation show design ideas pdf. This is a seven stage process. The stages in this process are test for reliability, examine root cause, allocate causes, align output with cause categories, draw fishbone diagram, brainstorm, identify problem. This is a completely editable PowerPoint presentation and is available for immediate download. Download now and impress your audience.
Icon Slide For SEO Analysis Report For Better Organic Search Results And Improved Website Slide2 Background PDF
Download our innovative and attention grabbing icon slide for seo analysis report for better organic search results and improved website slide2 background pdf template. The set of slides exhibit completely customizable icons. These icons can be incorporated into any business presentation. So download it immediately to clearly communicate with your clientele.
Icon Slide For SEO Analysis Report For Better Organic Search Results And Improved Website Slide3 Template PDF
Presenting our innovatively structured icon slide for seo analysis report for better organic search results and improved website slide3 template pdf set of slides. The slides contain a hundred percent editable icons. You can replace these icons without any inconvenience. Therefore, pick this set of slides and create a striking presentation

Data Lake Architecture How To Decide If You Need A Data Lake Information PDF
This slide depicts the key pointers to help to understand organizations if they need to maintain a data lake for critical business information and perform analytics on that data. Deliver an awe inspiring pitch with this creative Data Lake Architecture How To Decide If You Need A Data Lake Information PDF bundle. Topics like Make Data Administration Easier, Accelerate Analytics, Enhance Security And Governance, Businesses Depend can be discussed with this completely editable template. It is available for immediate download depending on the needs and requirements of the user.

Business Diagram Data Visualization Workflow From Data Access To Graphs Ppt Slide
Graphic of workflow has been used to design this diagram. This diagram slide depicts the concept of data visualization from data access. This diagrams suitable for technology and internet related presentations.

Data Lake Implementation How To Implement Data Lake In Aws Architecture Mockup PDF
This slide depicts the data lakes on AWS architecture through the data lake console and data lake command-line interface CLI and how S3 helps to provide storage services. This Data Lake Implementation How To Implement Data Lake In Aws Architecture Mockup PDF is perfect for any presentation, be it in front of clients or colleagues. It is a versatile and stylish solution for organizing your meetings. The Data Lake Implementation How To Implement Data Lake In Aws Architecture Mockup PDF features a modern design for your presentation meetings. The adjustable and customizable slides provide unlimited possibilities for acing up your presentation. Slidegeeks has done all the homework before launching the product for you. So, dont wait, grab the presentation templates today.

Data Lake Development With Azure Cloud Software Strategies To Avoid The Data Swamp In Data Lake Themes PDF
This slide depicts the strategies to avoid the data swamp in the data lake through data integrity, a comprehensive plan in place, leadership cohesion, and support structures and procedures across data. Deliver an awe inspiring pitch with this creative Data Lake Development With Azure Cloud Software Strategies To Avoid The Data Swamp In Data Lake Themes PDF bundle. Topics like Technological And Organizational, Information, Analytics Tools can be discussed with this completely editable template. It is available for immediate download depending on the needs and requirements of the user.

Effective Data Arrangement For Data Accessibility And Processing Readiness Need Of Effective Data Preparation In The Company Themes PDF
This slide shows the need of effective data preparation in the company. The need is to make data easily assessable to the users such as customers, partners, suppliers, to streamline empowerment along with collaboration and create a data-driven culture, to support effective decision making, to improve overall efficiency by making data automated, to increase processing speed of data etc. Presenting effective data arrangement for data accessibility and processing readiness need of effective data preparation in the company themes pdf to provide visual cues and insights. Share and navigate important information on six stages that need your due attention. This template can be used to pitch topics like need of effective data preparation in the company. In addtion, this PPT design contains high resolution images, graphics, etc, that are easily editable and available for immediate download.
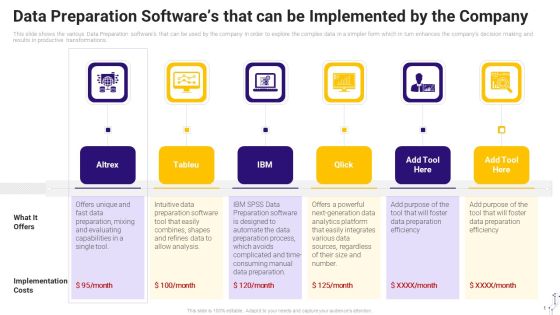
Effective Data Arrangement For Data Accessibility And Processing Readiness Data Preparation Softwares That Can Be Implemented Themes PDF
This slide shows the various Data Preparation softwares that can be used by the company in order to explore the complex data in a simpler form which in turn enhances the companys decision making and results in productive transformations. Presenting effective data arrangement for data accessibility and processing readiness data preparation softwares that can be implemented themes pdf to provide visual cues and insights. Share and navigate important information on six stages that need your due attention. This template can be used to pitch topics like data preparation softwares that can be implemented by the company. In addtion, this PPT design contains high resolution images, graphics, etc, that are easily editable and available for immediate download.
Swot Analysis Icon Graphics For Business Continuity Planning Life Cycle Ppt PowerPoint Presentation File Graphic Images PDF
Persuade your audience using this swot analysis icon graphics for business continuity planning life cycle ppt powerpoint presentation file graphic images pdf. This PPT design covers four stages, thus making it a great tool to use. It also caters to a variety of topics including strengths, weaknesses, opportunities. Download this PPT design now to present a convincing pitch that not only emphasizes the topic but also showcases your presentation skills.
Infographics For Data Safety PowerPoint Templates
Add charm to your presentations with this professional slide of Infographics. Icons displayed in this diagram may be used to depict data safety concept. Illustrate your plans to your listeners with using this slide.

Dependent Business Data Mart And Operational Data Store Ppt Infographics Gridlines PDF
This slide outlines the operational data store approach to the various layers of dependent data mart structure, where the enterprise data warehouse serves as the hub and the source data systems and data mart are the input and output spokes. Comprising four layers such as source data systems, data staging area operational data store, data and metadata storage area and end-user reporting layer. Presenting Dependent Business Data Mart And Operational Data Store Ppt Infographics Gridlines PDF to dispense important information. This template comprises one stages. It also presents valuable insights into the topics including Source Data Systems, Data Storage, Load. This is a completely customizable PowerPoint theme that can be put to use immediately. So, download it and address the topic impactfully.
International Cloud Kitchen Industry Analysis Emerging Global Trends In Cloud Kitchen Market Icons PDF
The slide highlights emerging trends in global cloud kitchen market for sustainable growth and development. It highlights trends such as vertical consolidation, automation, recipe improvement and data driven. Make sure to capture your audiences attention in your business displays with our gratis customizable International Cloud Kitchen Industry Analysis Emerging Global Trends In Cloud Kitchen Market Icons PDF. These are great for business strategies, office conferences, capital raising or task suggestions. If you desire to acquire more customers for your tech business and ensure they stay satisfied, create your own sales presentation with these plain slides.

Android Framework For Apps Development And Deployment Competitive Analysis With Various Factors Icons PDF
Presenting this set of slides with name android framework for apps development and deployment competitive analysis with various factors icons pdf. The topics discussed in these slides are superior quality, low price, unique features, installation, data security, user engagement. This is a completely editable PowerPoint presentation and is available for immediate download. Download now and impress your audience.

Multi Cloud Infrastructure Management Data Protection Multi Cloud Data Encryption Themes PDF
This slide covers data protection and encryption framework in multi-cloud with multi layer protection and data management. Find highly impressive Multi Cloud Infrastructure Management Data Protection Multi Cloud Data Encryption Themes PDF on Slidegeeks to deliver a meaningful presentation. You can save an ample amount of time using these presentation templates. No need to worry to prepare everything from scratch because Slidegeeks experts have already done a huge research and work for you. You need to download Multi Cloud Infrastructure Management Data Protection Multi Cloud Data Encryption Themes PDF for your upcoming presentation. All the presentation templates are 100 percent editable and you can change the color and personalize the content accordingly. Download now.
Stock Market Analysis Magnifying Glass Over Bar Graph And Dollar Sign Ppt PowerPoint Presentation Icon Visual Aids
This is a stock market analysis magnifying glass over bar graph and dollar sign ppt powerpoint presentation icon visual aids. This is a four stage process. The stages in this process are stock market, financial markets, bull market.
Umbrella With Threat Symbol For Financial Risk Analysis Vector Icon Ppt PowerPoint Presentation Styles Background Image PDF
Persuade your audience using this umbrella with threat symbol for financial risk analysis vector icon ppt powerpoint presentation styles background image pdf. This PPT design covers three stages, thus making it a great tool to use. It also caters to a variety of topics including umbrella with threat symbol for financial risk analysis vector icon. Download this PPT design now to present a convincing pitch that not only emphasizes the topic but also showcases your presentation skills.
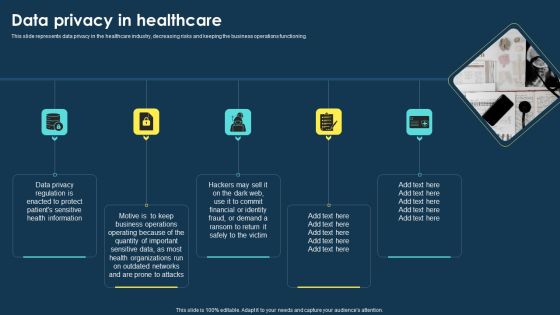
Integrating Data Privacy System Data Privacy In Healthcare Ppt Pictures Information PDF
This slide represents data privacy in the healthcare industry, decreasing risks and keeping the business operations functioning. If you are looking for a format to display your unique thoughts, then the professionally designed Integrating Data Privacy System Data Privacy In Healthcare Ppt Pictures Information PDF is the one for you. You can use it as a Google Slides template or a PowerPoint template. Incorporate impressive visuals, symbols, images, and other charts. Modify or reorganize the text boxes as you desire. Experiment with shade schemes and font pairings. Alter, share or cooperate with other people on your work. Download Integrating Data Privacy System Data Privacy In Healthcare Ppt Pictures Information PDF and find out how to give a successful presentation. Present a perfect display to your team and make your presentation unforgettable.

Data Science Process Flow Diagram Ppt Presentation
This is a data science process flow diagram ppt presentation. This is a nine stage process. The stages in this process are models and algorithms, communicate visualize report, data is processed, make decisions, exploratory data analysis, clean dataset, data product, raw data collected, reality.

Big Data Transformation Sample Diagram Powerpoint Slides
This is a big data transformation sample diagram powerpoint slides. This is a four stage process. The stages in this process are hadoop, telemetry, unstructured data analysis, machine learning.

Convertible Note Pitch Deck Funding Strategy Competitive Analysis By Company Size Ppt PowerPoint Presentation Model Icon PDF
Presenting this set of slides with name convertible note pitch deck funding strategy competitive analysis by company size ppt powerpoint presentation model icon pdf. The topics discussed in these slides are customers, user traffic visitors per month, employee count, revenue, net income. This is a completely editable PowerPoint presentation and is available for immediate download. Download now and impress your audience.
Fishbone Ishikawa Cause And Effect Analysis How Do I Do It Contd Problem Ppt PowerPoint Presentation Icon Graphics Pictures PDF
Presenting this set of slides with name fishbone ishikawa cause and effect analysis how do i do it contd problem ppt powerpoint presentation icon graphics pictures pdf. This is a one stage process. The stages in this process are allocate causes, brainstorming, problem, further developed. This is a completely editable PowerPoint presentation and is available for immediate download. Download now and impress your audience.
Fishbone Ishikawa Cause And Effect Analysis How Do I Do It Ppt PowerPoint Presentation Icon Graphics Tutorials PDF
Presenting this set of slides with name fishbone ishikawa cause and effect analysis how do i do it ppt powerpoint presentation icon graphics tutorials pdf. This is a one stage process. The stages in this process are identify problem, business, analyzed, problem. This is a completely editable PowerPoint presentation and is available for immediate download. Download now and impress your audience.
Fishbone Ishikawa Cause And Effect Analysis Sources Of Variation Method Ppt PowerPoint Presentation Icon Example Topics PDF
Presenting this set of slides with name fishbone ishikawa cause and effect analysis sources of variation method ppt powerpoint presentation icon example topics pdf. The topics discussed in these slides are different methods followed produce products, alterations caused inappropriate methods, processes, effectiveness. This is a completely editable PowerPoint presentation and is available for immediate download. Download now and impress your audience.

Big Data Discovery Process Diagram Powerpoint Slides
This is a big data discovery process diagram powerpoint slides. This is a three stage process. The stages in this process are big data, data science, data discovery.
Staff Analysis And Potential Matrix With Low Medium And High Levels Ppt PowerPoint Presentation Icon Styles PDF
Persuade your audience using this staff analysis and potential matrix with low medium and high levels ppt powerpoint presentation icon styles pdf. This PPT design covers nine stages, thus making it a great tool to use. It also caters to a variety of topics including potential, performance, questionable. Download this PPT design now to present a convincing pitch that not only emphasizes the topic but also showcases your presentation skills.

Big Data Categories Sample Diagram Slides Styles
This is a big data categories sample diagram slides styles. This is a five stage process. The stages in this process are web and social media data, big transition data, human generated data, machine to machine data, bio metric data.

Data Management Process Ppt PowerPoint Presentation Outline
This is a data management process ppt powerpoint presentation outline. This is a five stage process. The stages in this process are process, big data, icon, business, marketing.

Data Performance Ppt Diagram Sample File
This is a data performance ppt diagram sample file. This is a five stage process. The stages in this process are classification, analysis, domain expertise, tool and technology, engine performance.

 Home
Home