Data Analysis Icon

Donut Pie Chart Product Finance Ppt PowerPoint Presentation Diagram Ppt
This is a donut pie chart product finance ppt powerpoint presentation diagram ppt. This is a three stage process. The stages in this process are finance, management, strategy, analysis, marketing.

3d People On Pie Chart PowerPoint Templates
This power point diagram has been crafted with graphic of 3d team members on pie chart. This 3d diagram contains the concept of team management and result analysis. Use this diagram to create an impact on your viewers.
Risk Management For Organization Essential Assets Financial Performance Tracking Dashboard Designs PDF
This slide presents the dashboard which will help firm in tracking the fiscal performance. This dashboard displays revenues and expenses trends and payment received analysis. Deliver an awe inspiring pitch with this creative risk management for organization essential assets financial performance tracking dashboard designs pdf bundle. Topics like receivables analysis, revenue and expense trends can be discussed with this completely editable template. It is available for immediate download depending on the needs and requirements of the user.
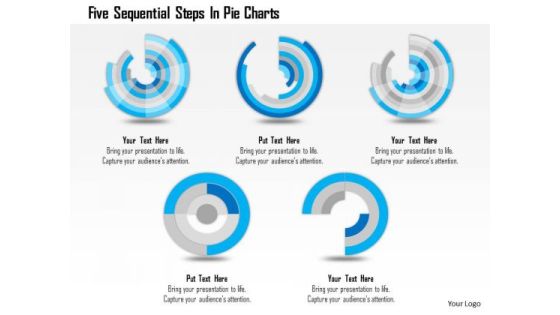
Business Diagram Five Sequential Steps In Pie Charts Presentation Template
Five sequential pie charts are used to craft this power point template. This PPT contains the concept of process flow and result analysis. Use this PPT for your business and sales related presentations and build quality presentation for your viewers.
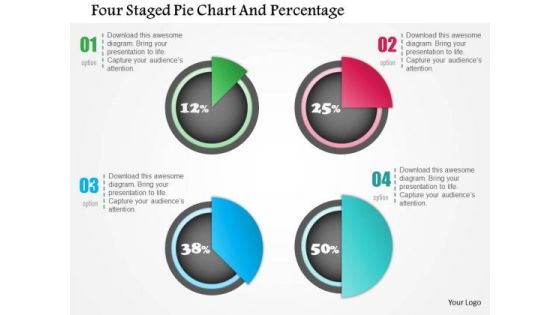
Business Diagram Four Staged Pie Chart And Percentage Presentation Template
Four staged pie chart and percentage values has been used to design this power point template. This PPT contains the concept of financial result analysis. Use this PPT for business and marketing related presentations.
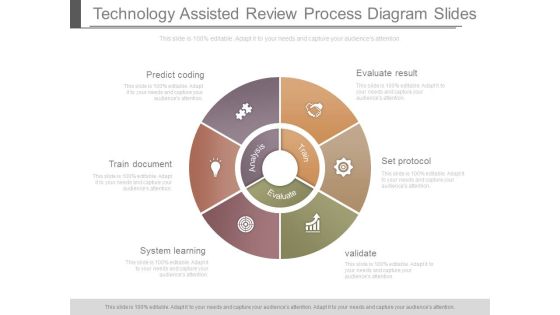
Technology Assisted Review Process Diagram Slides
This is a technology assisted review process diagram slides. This is a six stage process. The stages in this process are predict coding, train document, system learning validate, set protocol, evaluate result, analysis, evaluate, train.
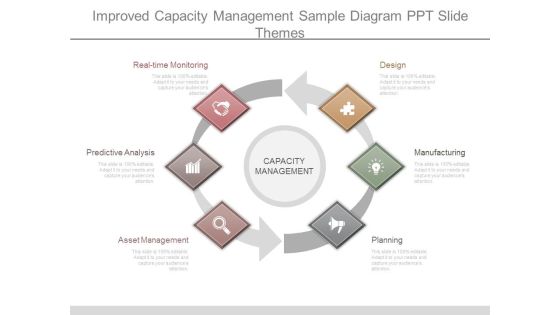
Improved Capacity Management Sample Diagram Ppt Slide Themes
This is a improved capacity management sample diagram ppt slide themes. This is a six stage process. The stages in this process are real time monitoring, predictive analysis, asset management, planning, manufacturing, design, capacity management.

Business Diagram Business Temple With Text Blue Pillar Presentation Template
This business plan power point template has been designed with business temple graphic. This image slide contains the concept of marketing strategies and business plan analysis. Highlight your plans in any business presentations with this unique design.

Process Of Monitor And Control Risk Diagram Powerpoint Themes
This is a process of monitor and control risk diagram powerpoint themes. This is a six stage process. The stages in this process are monitor and control risks, project start, planning, identification, analysis, responses, project end.

Retail KPI Dashboard Showing Revenue Vs Units Sold Ppt PowerPoint Presentation Professional Smartart
This is a retail kpi dashboard showing revenue vs units sold ppt powerpoint presentation professional smartart. This is a four stage process. The stages in this process are finance, analysis, business, investment, marketing.

Retail KPI Dashboard Showing Sales Revenue Customers Ppt PowerPoint Presentation Show Background Designs
This is a retail kpi dashboard showing sales revenue customers ppt powerpoint presentation show background designs. This is a six stage process. The stages in this process are finance, analysis, business, investment, marketing.
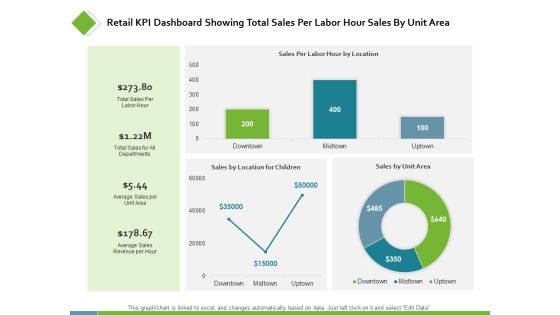
Retail KPI Dashboard Showing Total Sales Per Labor Ppt PowerPoint Presentation Styles Examples
This is a retail kpi dashboard showing total sales per labor ppt powerpoint presentation styles examples. This is a three stage process. The stages in this process are finance, analysis, business, investment, marketing.

Business Diagram Circular Diagram For Company Vision Presentation Template
This power point template diagram has been crafted with three staged Venn diagram. This PPT contains the concept of future vision and analysis. Use this PPT for your business presentations.

Entrepreneurship Market Research Powerpoint Images
This is a entrepreneurship market research powerpoint images. This is a three stage process. The stages in this process are company competitor data, customer user data, industry sector data.

Activity Network Diagram Ppt PowerPoint Presentation Deck
This is a activity network diagram ppt powerpoint presentation deck. This is a five stage process. The stages in this process are business, strategy, analysis, marketing, hexagon, flow process.

Civil Contractors Pre Construction Services Budgeting Ppt Show Images PDF
slide covers all the services offered by our company during preconstruction phase such as budgeting, scheduling, risk and value analysis, logistics planning, etc. Presenting civil contractors pre construction services budgeting ppt show images pdf to provide visual cues and insights. Share and navigate important information on five stages that need your due attention. This template can be used to pitch topics like budgeting, constructability and risk analysis, logistics planning, value analysis, pre construction services. In addtion, this PPT design contains high-resolution images, graphics, etc, that are easily editable and available for immediate download.

Technology Innovation Strategy Diagram Powerpoint Show
This is a technology innovation strategy diagram powerpoint show. This is a three stage process. The stages in this process are strategy, solution, support, research, strategy, analysis, architecture, release, build, envision, design, transition, support.

Crm Life Cycle Phases And Project Management Ppt PowerPoint Presentation Complete Deck With Slides
This is a crm life cycle phases and project management ppt powerpoint presentation complete deck with slides. This is a one stage process. The stages in this process are project management, business, marketing, success, analysis.

Phases In The Evolution Of Strategic Planning Ppt PowerPoint Presentation Professional Graphics Design
This is a phases in the evolution of strategic planning ppt powerpoint presentation professional graphics design. This is a four stage process. The stages in this process are annual budget, environmental analysis, strategic management, externally oriented planning, operational control.
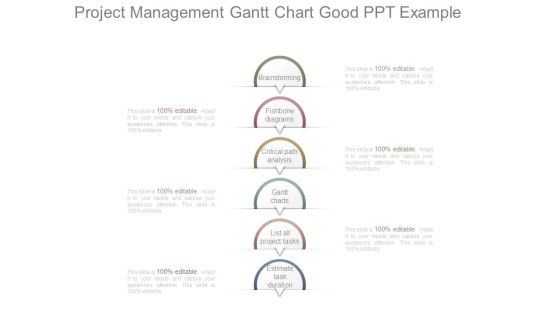
Project Management Gantt Chart Good Ppt Example
This is a project management gantt chart good ppt example. This is a six stage process. The stages in this process are brainstorming, fishbone diagrams, critical path analysis, gantt charts, list all project tasks, estimate task duration.
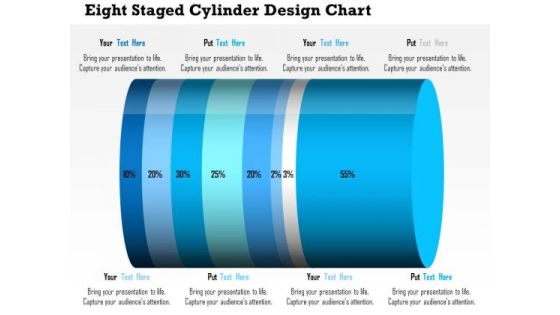
Business Daigram Eight Staged Cylinder Design Chart Presentation Templets
This business diagram contains eight staged cylinder design chart with percentage ratio. Download this diagram to display financial analysis. Use this diagram to make business and marketing related presentations.

Pie Chart With Global Team Powerpoint Template
This PowerPoint template has been designed with graphics of pie chart with global team. This diagram can be used to display team performance and analysis. Capture the attention of your audience with this slide.

Cost Comparison Table Chart Powerpoint Slides
Our above PPT slide displays cost comparison table chart. This diagram may be used to display cost comparison and financial analysis. Download this PowerPoint template to leave permanent impression on your audience.
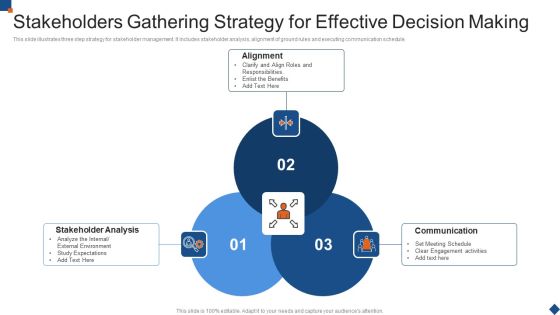
Stakeholders Gathering Strategy For Effective Decision Making Portrait PDF
This slide illustrates three step strategy for stakeholder management. It includes stakeholder analysis, alignment of ground rules and executing communication schedule.Presenting Stakeholders Gathering Strategy For Effective Decision Making Portrait PDF to dispense important information. This template comprises three stages. It also presents valuable insights into the topics including Stakeholder Analysis, Alignment, Communication This is a completely customizable PowerPoint theme that can be put to use immediately. So, download it and address the topic impactfully.

Business Diagram Percentage Pie Chart On Computer Tablet Presentation Slide Template
This business diagram power point template has been designed with graphic of pie chart. This pie chart contains the various percentage values for business result analysis. Use this pie chart for your business result display related presentations.

Business Case New Product Development Ppt Samples
This is a business case new product development ppt samples. This is a four stage process. The stages in this process are employer needs skills and employment market analysis, alignment with strategic priorities, learner outcomes, existing provision.

Bulb Or Idea Technology Ppt PowerPoint Presentation Model Elements
This is a bulb or idea technology ppt powerpoint presentation model elements. The topics discussed in this diagram are finance, marketing, analysis, investment, management. This is a completely editable PowerPoint presentation, and is available for immediate download.

Customer Contact Risk Profiling Sample Diagram Powerpoint Slides
This is a customer contact risk profiling sample diagram powerpoint slides. This is a six stage process. The stages in this process are risk profiling, contact management, usage statistics profiling, industry penetration analysis, non compliance, customer value assessment.

Sample Process Flow Tools Diagram Powerpoint Slides
This is a sample process flow tools diagram powerpoint slides. This is a seven stage process. The stages in this process are check sheet, process flow chart, pareto analysis, control chart, scatter diagram, cause and effect diagram, histogram.

Agile Development Approach IT Extreme Programming 6 Phases Implementation Professional PDF
This slide depicts the phases of extreme programming such as planning, analysis, design, execution, wrapping, and closure and the tasks performed in each. Deliver and pitch your topic in the best possible manner with this Agile Development Approach IT Extreme Programming 6 Phases Implementation Professional PDF. Use them to share invaluable insights on Analysis, Planning, Design, Execution, Wrapping and impress your audience. This template can be altered and modified as per your expectations. So, grab it now.

Business Infographics Theme Design Powerpoint Slides
This PPT slide has been designed with circular arrows infographic diagram. This business diagram is suitable for marketing research and analysis. This professional slide helps in making an instant impact on viewers.

Puzzle Pie Circular Infographic Diagram Powerpoint Templates
Our above PPT slide display puzzle pie circular Infographic. Download this diagram slide to display strategy and analysis. Adjust the above diagram in your business presentations to visually support your content.
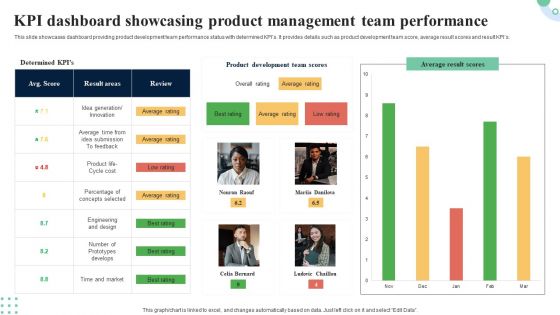
KPI Dashboard Showcasing Product Management Team Performance Demonstration PDF
This slide represents dashboard showcasing revenue assessment for new product development. It projects information regarding revenue breakdown, revenue per product, time to marketing and win or loss analysis. Showcasing this set of slides titled KPI Dashboard Showcasing Product Management Team Performance Demonstration PDF. The topics addressed in these templates are Revenue Per Project, Revenue Breakdown, Loss Analysis. All the content presented in this PPT design is completely editable. Download it and make adjustments in color, background, font etc. as per your unique business setting.

Web Analytics Process Diagram Powerpoint Images
This is a web analytics process diagram powerpoint images. This is a six stage process. The stages in this process are build kpis, define goals, implement, test alternatives, analyze data, collect data.

Combo Chart Finance Ppt PowerPoint Presentation Infographic Template Model
This is a combo chart finance ppt powerpoint presentation infographic template model. The topics discussed in this diagram are finance, marketing, management, investment, analysis. This is a completely editable PowerPoint presentation, and is available for immediate download.

Bar Chart Finance Marketing Ppt PowerPoint Presentation Portfolio Pictures
This is a bar chart finance marketing ppt powerpoint presentation portfolio pictures. The topics discussed in this diagram are finance, marketing, management, investment, analysis. This is a completely editable PowerPoint presentation, and is available for immediate download.

Combo Chart Management Investment Ppt PowerPoint Presentation Inspiration Maker
This is a combo chart management investment ppt powerpoint presentation inspiration maker. The topics discussed in this diagram are finance, marketing, management, investment, analysis. This is a completely editable PowerPoint presentation, and is available for immediate download.

Column Chart Investment Ppt PowerPoint Presentation Pictures Inspiration
This is a column chart investment ppt powerpoint presentation pictures inspiration. The topics discussed in this diagram are finance, marketing, management, investment, analysis. This is a completely editable PowerPoint presentation, and is available for immediate download.
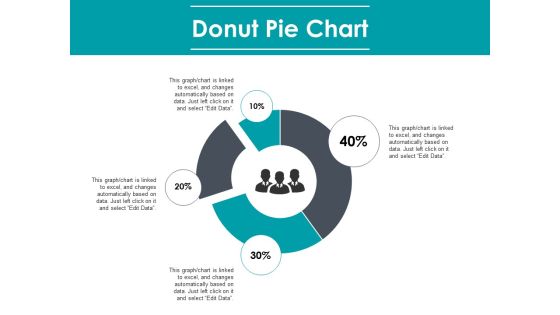
Donut Pie Chart Finance Marketing Ppt PowerPoint Presentation Layouts Ideas
This is a donut pie chart finance marketing ppt powerpoint presentation layouts ideas. The topics discussed in this diagram are finance, marketing, management, investment, analysis. This is a completely editable PowerPoint presentation, and is available for immediate download.
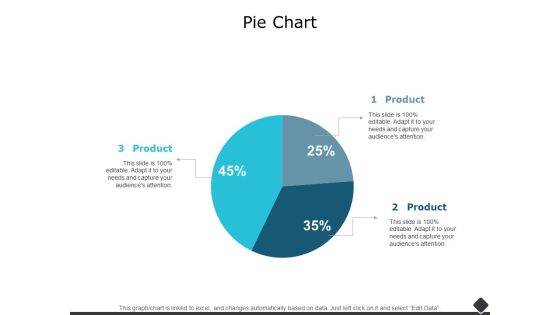
Pie Chart Finance Marketing Ppt PowerPoint Presentation Professional Design Ideas
This is a pie chart finance marketing ppt powerpoint presentation professional design ideas. The topics discussed in this diagram are finance, marketing, management, investment, analysis. This is a completely editable PowerPoint presentation, and is available for immediate download.

Real Estate Developers Funding Alternatives Kpi Dashboard To Monitor Project Status Structure PDF
Following slide illustrates KPI dashboard for monitoring the project performance. KPIs covered in the dashboard are project progress and task status, project health and project timeline. Deliver an awe inspiring pitch with this creative Real Estate Developers Funding Alternatives Kpi Dashboard To Monitor Project Status Structure PDF bundle. Topics like Analysis, DeAnalysis, Design, Development can be discussed with this completely editable template. It is available for immediate download depending on the needs and requirements of the user.

Capital Investment Options KPI Dashboard To Monitor Project Status Summary PDF
Following slide illustrates KPI dashboard for monitoring the project performance. KPIs covered in the dashboard are project progress and task status, project health and project timeline. Deliver an awe inspiring pitch with this creative Capital Investment Options KPI Dashboard To Monitor Project Status Summary PDF bundle. Topics like Analysis, Development, Testing, Implement can be discussed with this completely editable template. It is available for immediate download depending on the needs and requirements of the user.
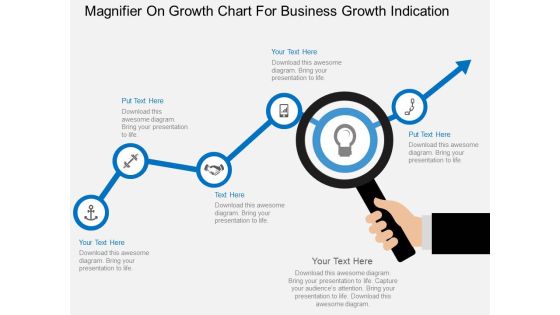
Magnifier On Growth Chart For Business Growth Indication Powerpoint Template
This business slide contains graphics of magnifier on growth chart. This PowerPoint template helps to display business planning and analysis. Use this diagram to impart more clarity to concept and to create more sound impact on viewers.

Online Reputation Management Sample Diagram Ppt Slide Templates
This is a online reputation management sample diagram ppt slide templates. This is a seven stage process. The stages in this process are sentiment analysis, press releases, strong brand presence, reputation, competitor websites, brand monitoring, social media.
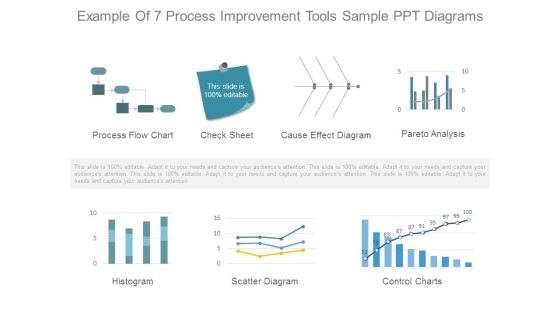
Example Of 7 Process Improvement Tools Sample Ppt Diagrams
This is a example of 7 process improvement tools sample ppt diagrams. This is a seven stage process. The stages in this process are process flow chart, check sheet, cause effect diagram, pareto analysis, histogram, scatter diagram, control charts.

Food And Beverages Company Executive Report Slides PDF
This slide illustrate executive summary of food and beverages manufacturing company. It includes elements such as company overview, statistical information, product category, geographical location and competitor analysis. Presenting Food And Beverages Company Executive Report Slides PDF to dispense important information. This template comprises one stages. It also presents valuable insights into the topics including CEO And Founder, Product Categories, Competitor Analysis. This is a completely customizable PowerPoint theme that can be put to use immediately. So, download it and address the topic impactfully.

Column Chart Ppt PowerPoint Presentation Gallery Layouts
This is a column chart ppt powerpoint presentation gallery layouts. This is a two stage process. The stages in this process are business, strategy, analysis, pretention, chart and graph, growth.

Area Chart Ppt PowerPoint Presentation Pictures Slideshow
This is a area chart ppt powerpoint presentation pictures slideshow. This is a two stage process. The stages in this process are area chart, finance, analysis, marketing, strategy, business.

Area Chart Ppt PowerPoint Presentation Model Layout
This is a area chart ppt powerpoint presentation model layout. This is a two stage process. The stages in this process are area chart, finance, marketing, strategy, analysis, business.

Column Chart Ppt PowerPoint Presentation Pictures Outfit
This is a column chart ppt powerpoint presentation pictures outfit. This is a two stage process. The stages in this process are column chart, finance, marketing, strategy, analysis, business.

Area Chart Ppt PowerPoint Presentation Styles Templates
This is a area chart ppt powerpoint presentation styles templates. This is a two stage process. The stages in this process are area chart, growth, finance, marketing, strategy, analysis.

Bar Chart Ppt PowerPoint Presentation Styles Smartart
This is a bar chart ppt powerpoint presentation styles smartart. This is a two stage process. The stages in this process are bar chart, growth, finance, marketing, strategy, analysis.

Bubble Chart Ppt PowerPoint Presentation Inspiration Picture
This is a bubble chart ppt powerpoint presentation inspiration picture. This is a two stage process. The stages in this process are bubble chart, growth, finance, marketing, strategy, analysis.

Radar Chart Ppt PowerPoint Presentation Professional Brochure
This is a radar chart ppt powerpoint presentation professional brochure. This is a two stage process. The stages in this process are radar chart, finance, marketing, strategy, analysis, business.

Combo Chart Ppt PowerPoint Presentation Inspiration Vector
This is a combo chart ppt powerpoint presentation inspiration vector. This is a three stage process. The stages in this process are combo chart, finance, marketing, strategy, analysis, business.

Column Chart Ppt PowerPoint Presentation Inspiration Good
This is a column chart ppt powerpoint presentation inspiration good. This is a two stage process. The stages in this process are column chart, finance, marketing, strategy, analysis, business.
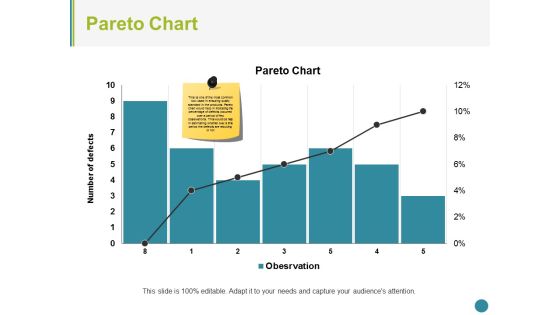
Pareto Chart Ppt PowerPoint Presentation Summary Structure
This is a pareto chart ppt powerpoint presentation summary structure. This is a seven stage process. The stages in this process are pareto chart, finance, marketing, strategy, analysis, business.

Combo Chart Ppt PowerPoint Presentation Infographics Sample
This is a combo chart ppt powerpoint presentation infographics sample. This is a three stage process. The stages in this process are combo chart, finance, analysis, marketing, strategy, business.

Area Chart Ppt PowerPoint Presentation Infographics Images
This is a area chart ppt powerpoint presentation infographics images. This is a two stage process. The stages in this process are area chart, finance, marketing, analysis, strategy, business.

Bar Chart Ppt PowerPoint Presentation Slides Model
This is a bar chart ppt powerpoint presentation slides model. This is a two stage process. The stages in this process are bar chart, analysis, business, marketing, strategy, finance.


 Continue with Email

 Home
Home


