Data Analysis Icon
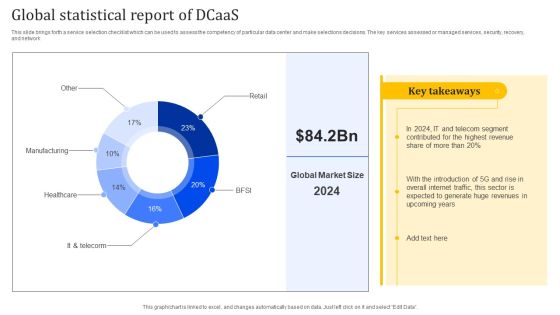
Global Statistical Report Of Dcaas Portrait PDF
This slide brings forth a service selection checklist which can be used to assess the competency of particular data center and make selections decisions. The key services assessed or managed services, security, recovery, and network. Showcasing this set of slides titled Global Statistical Report Of Dcaas Portrait PDF. The topics addressed in these templates are Manufacturing, Healthcare, Global Statistical. All the content presented in this PPT design is completely editable. Download it and make adjustments in color, background, font etc. as per your unique business setting.

Customer Information Software Dashboard With Churn Risk Information PDF
Following slide visually depicts customer data platform dashboard that showcase all the details of an individual customer in an organized way. Details covered in this dashboard is related to customer interests, top brands purchased, churn risk, customer lifetime value, engagement score etc. Pitch your topic with ease and precision using this Customer Information Software Dashboard With Churn Risk Information PDF. This layout presents information on Customer Lifetime, Engagement Score, Average Spending. It is also available for immediate download and adjustment. So, changes can be made in the color, design, graphics or any other component to create a unique layout.

Approaches To Improve Fleet Management With Information Analytics Sample PDF
This slide showcases data driven approaches to fleet management. This template focuses on tracking report on logistics which matter most to business. It includes information related to asset utilization, fuel management, etc. Presenting Approaches To Improve Fleet Management With Information Analytics Sample PDF to dispense important information. This template comprises three stages. It also presents valuable insights into the topics including Asset Utilization, Fuel Management, Fringe Benefit Tax. This is a completely customizable PowerPoint theme that can be put to use immediately. So, download it and address the topic impactfully.
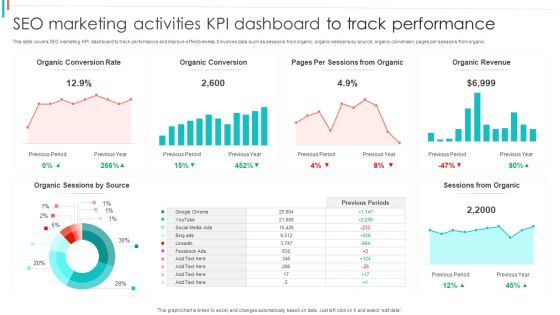
SEO Marketing Activities KPI Dashboard To Track Performance Brochure PDF
This slide covers SEO marketing KPI dashboard to track performance and improve effectiveness. It involves data such as sessions from organic, organic sessions by source, organic conversion, pages per sessions from organic.Pitch your topic with ease and precision using this SEO Marketing Activities KPI Dashboard To Track Performance Brochure PDF. This layout presents information on Organic Conversion, Sessions Organic, Organic Revenue. It is also available for immediate download and adjustment. So, changes can be made in the color, design, graphics or any other component to create a unique layout.
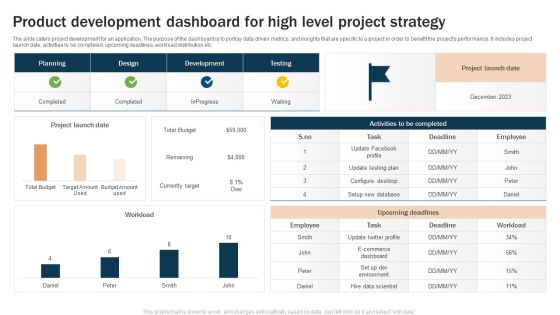
Product Development Dashboard For High Level Project Strategy Microsoft PDF
The slide caters project development for an application. The purpose of the dashboard is to portray data driven metrics, and insights that are specific to a project in order to benefit the projects performance. It includes project launch date, activities to be completed, upcoming deadlines, workload distribution etc. Showcasing this set of slides titled Product Development Dashboard For High Level Project Strategy Microsoft PDF. The topics addressed in these templates are Upcoming Deadlines, Project Launch, Upcoming Deadlines. All the content presented in this PPT design is completely editable. Download it and make adjustments in color, background, font etc. as per your unique business setting.

Interoperability Software Testing Check Phase Of PDCA Cycle Rules PDF
This slide represents the double-check phase of the PDCA cycle in which we go through the test findings and map out them, also making sure that the data being transverse isnt changed. From laying roadmaps to briefing everything in detail, our templates are perfect for you. You can set the stage with your presentation slides. All you have to do is download these easy to edit and customizable templates. Interoperability Software Testing Check Phase Of PDCA Cycle Rules PDF will help you deliver an outstanding performance that everyone would remember and praise you for. Do download this presentation today.
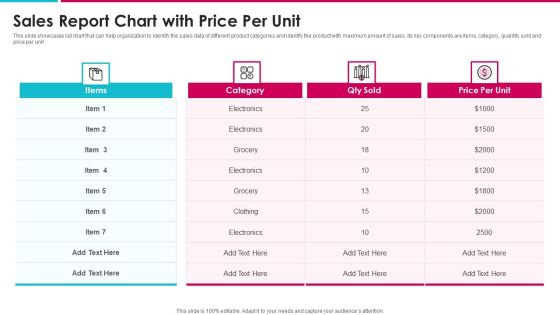
Sales Report Chart With Price Per Unit Information PDF
This slide showcases list chart that can help organization to identify the sales data of different product categories and identify the product with maximum amount of sales. Its key components are items, category, quantity sold and price per unit Showcasing this set of slides titled sales report chart with price per unit information pdf. The topics addressed in these templates are sales report chart with price per unit. All the content presented in this PPT design is completely editable. Download it and make adjustments in color, background, font etc. as per your unique business setting.

Investment Annual Performance Report Pictures PDF
This slide highlights a statistical data showing performance of investment funds for developing financial growth plan. It includes key components such as global equities, aggressive, growth, balanced, moderate, conservative and cash. Pitch your topic with ease and precision using this Investment Annual Performance Report Pictures PDF. This layout presents information on Low Interest Rates, Wage Subsidies, Returns Due Market Drop. It is also available for immediate download and adjustment. So, changes can be made in the color, design, graphics or any other component to create a unique layout.
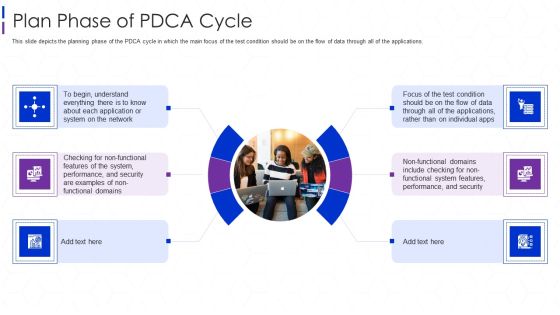
Software Interoperability Examination IT Plan Phase Of PDCA Cycle Clipart PDF
This slide depicts the planning phase of the PDCA cycle in which the main focus of the test condition should be on the flow of data through all of the applications. This is a software interoperability examination it plan phase of pdca cycle clipart pdf template with various stages. Focus and dispense information on six stages using this creative set, that comes with editable features. It contains large content boxes to add your information on topics like network, system, security, performance. You can also showcase facts, figures, and other relevant content using this PPT layout. Grab it now.
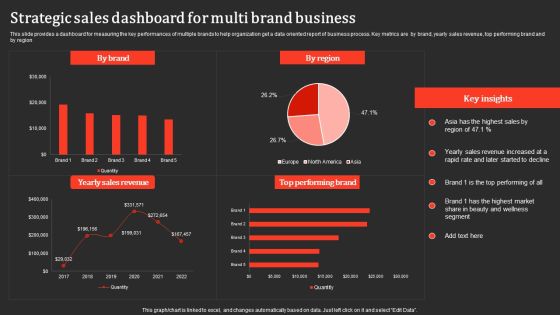
Strategic Sales Dashboard For Multi Brand Business Professional PDF
This slide provides a dashboard for measuring the key performances of multiple brands to help organization get a data oriented report of business process. Key metrics are by brand, yearly sales revenue, top performing brand and by region. Pitch your topic with ease and precision using this Strategic Sales Dashboard For Multi Brand Business Professional PDF. This layout presents information on Yearly Sales Revenue, Performing Brand. It is also available for immediate download and adjustment. So, changes can be made in the color, design, graphics or any other component to create a unique layout.

Dashboard For Monitoring Social Media Platforms Marketing Document Slides PDF
This slide provides marketing report for various social media platforms aimed at displaying data insights in one place using relevant key performance indicators. It covers four platforms with key insights on marketing performance measured by metrics. Showcasing this set of slides titled Dashboard For Monitoring Social Media Platforms Marketing Document Slides PDF. The topics addressed in these templates are Impressions, Engagement, Target. All the content presented in this PPT design is completely editable. Download it and make adjustments in color, background, font etc. as per your unique business setting.

Strategy To Improve Team Proficiency Team Performance Observation Dashboard Diagrams PDF
This slide provides an overview of statistics related to current team performance based on observation method selected in previous slide for data collection. It involves team conflict status, Planned vs actual project status, leadership status and communication gap status. Deliver an awe inspiring pitch with this creative proficiency team performance observation dashboard diagrams pdf bundle. Topics like team performance observation dashboard can be discussed with this completely editable template. It is available for immediate download depending on the needs and requirements of the user.
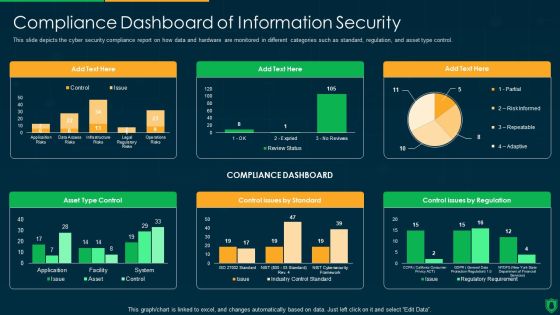
Info Security Compliance Dashboard Of Information Security Ppt PowerPoint Presentation File Graphics Download PDF
This slide depicts the cyber security compliance report on how data and hardware are monitored in different categories such as standard, regulation, and asset type control. Deliver an awe inspiring pitch with this creative info security compliance dashboard of information security ppt powerpoint presentation file graphics download pdf bundle. Topics like compliance dashboard, asset type control, control issues by standard, control issues by regulation can be discussed with this completely editable template. It is available for immediate download depending on the needs and requirements of the user.

Dashboard For Technological Smart Homes Security System Management Designs PDF
This side showcase the dashboard of security system management for tracking and forecasting matrices for better functioning of devices. It include the statistic data such as temperature, power consumed, devices working, and list of devices connected. Showcasing this set of slides titled Dashboard For Technological Smart Homes Security System Management Designs PDF. The topics addressed in these templates are Smart Light, Smart Heating, Smart Cooling. All the content presented in this PPT design is completely editable. Download it and make adjustments in color, background, font etc. as per your unique business setting.
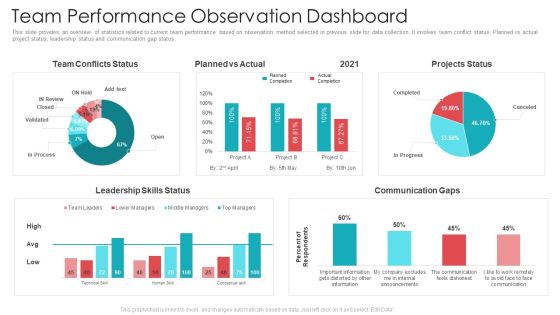
Official Team Collaboration Plan Team Performance Observation Dashboard Background PDF
This slide provides an overview of statistics related to current team performance based on observation method selected in previous slide for data collection. It involves team conflict status, Planned vs actual project status, leadership status and communication gap status. Deliver an awe-inspiring pitch with this creative official team collaboration plan team performance observation dashboard background pdf bundle. Topics like leadership skills status, team conflicts status, communication gaps can be discussed with this completely editable template. It is available for immediate download depending on the needs and requirements of the user.

Resource Planning Management Dashboard With Effective Utilization Mockup PDF
This slide shows the resourcing plan dashboard which focuses on the over and under utilization, trend by team, data by team which includes resource and utilization time of software developer, web designer and project manager. Pitch your topic with ease and precision using this Resource Planning Management Dashboard With Effective Utilization Mockup PDF. This layout presents information on Web Designer, Software Developer, Team. It is also available for immediate download and adjustment. So, changes can be made in the color, design, graphics or any other component to create a unique layout.

Executive Report Ppt PowerPoint Presentation Complete Deck With Slides
This Executive Report Ppt PowerPoint Presentation Complete Deck With Slides is designed to help you retain your audiences attention. This content ready PowerPoint Template enables you to take your audience on a journey and share information in a way that is easier to recall. It helps you highlight the crucial parts of your work so that the audience does not get saddled with information download. This fourteen slide PPT Deck comes prepared with the graphs and charts you could need to showcase your information through visuals. You only need to enter your own data in them. Download this editable PowerPoint Theme and walk into that meeting with confidence.

Dashboard To Monitor Logistics Chains Warehouse Operations Diagrams PDF
Following slide depicts a dashboard which can be used by supplier to get a centralized, real-time view of key metrics and data points related to the logistics performance. Key performance metrics are related to due receipts, number of products received,items in transit, items due for pickup etc. Pitch your topic with ease and precision using this Dashboard To Monitor Logistics Chains Warehouse Operations Diagrams PDF. This layout presents information on Product Status, Pickup List Status, Best Selling Products. It is also available for immediate download and adjustment. So, changes can be made in the color, design, graphics or any other component to create a unique layout.

Analytical Skills Hardest To Find And Hire By Companies Slides PDF
This slide lists down various essential critical skills for business and segregate them on the basis of its importance to organization. It includes details about media literacy, problem solving, adaptability, data analytics, etc. Persuade your audience using this Analytical Skills Hardest To Find And Hire By Companies Slides PDF. This PPT design covers four stages, thus making it a great tool to use. It also caters to a variety of topics including Collaboration, Teamwork, Quantitative Ability. Download this PPT design now to present a convincing pitch that not only emphasizes the topic but also showcases your presentation skills.
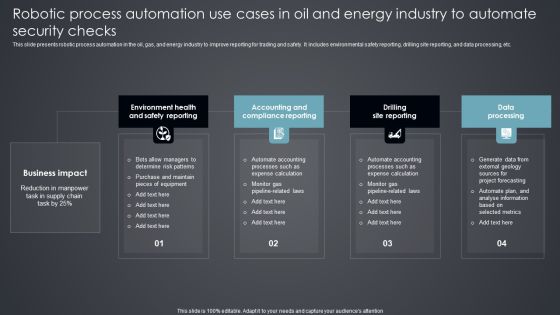
Robotic Process Automation Use Cases In Oil And Energy Industry To Automate Security Checks Introduction PDF
This slide presents robotic process automation in the oil, gas, and energy industry to improve reporting for trading and safety. It includes environmental safety reporting, drilling site reporting, and data processing, etc. Presenting Robotic Process Automation Use Cases In Oil And Energy Industry To Automate Security Checks Introduction PDF to dispense important information. This template comprises four stages. It also presents valuable insights into the topics including Environment Health, Accounting Compliance Reporting, Drilling Site Reporting. This is a completely customizable PowerPoint theme that can be put to use immediately. So, download it and address the topic impactfully.
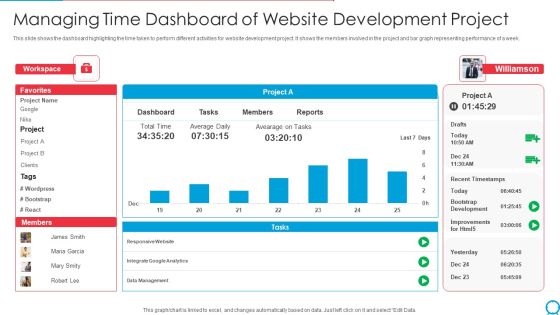
Managing Time Dashboard Of Website Development Project Ppt PowerPoint Presentation Gallery Outline PDF
This slide shows the dashboard highlighting the time taken to perform different activities for website development project. It shows the members involved in the project and bar graph representing performance of a week. Showcasing this set of slides titled managing time dashboard of website development project ppt powerpoint presentation gallery outline pdf. The topics addressed in these templates are workspace, project, data management, recent timestamps. All the content presented in this PPT design is completely editable. Download it and make adjustments in color, background, font etc. as per your unique business setting.

Recruitment Requisition Departmental Performance Report Sheet Demonstration PDF
Following slide illustrates hiring performance chart utilized by organizations to identify planned and spent budget along with time to fill requisitions. This slide provides data regarding various departments, planned and filled requisitions, salary budget, average days, etc. Pitch your topic with ease and precision using this Recruitment Requisition Departmental Performance Report Sheet Demonstration PDF. This layout presents information on Recruitment Requisition, Departmental Performance, Report Sheet. It is also available for immediate download and adjustment. So, changes can be made in the color, design, graphics or any other component to create a unique layout.
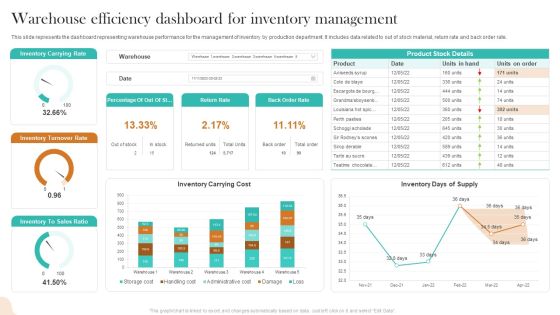
Warehouse Efficiency Dashboard For Inventory Management Infographics PDF
This slide represents the dashboard representing warehouse performance for the management of inventory by production department. It includes data related to out of stock material, return rate and back order rate. Showcasing this set of slides titled Warehouse Efficiency Dashboard For Inventory Management Infographics PDF. The topics addressed in these templates are Inventory Carrying Rate, Inventory Turnover Rate, Inventory Carrying Cost. All the content presented in this PPT design is completely editable. Download it and make adjustments in color, background, font etc. as per your unique business setting.
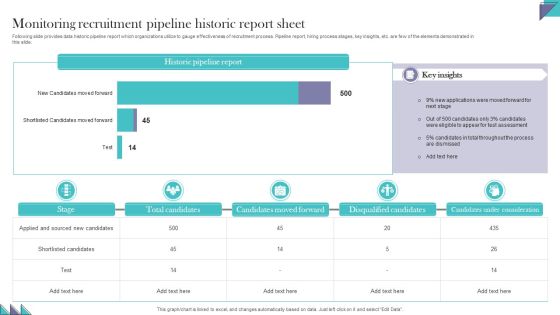
Monitoring Recruitment Pipeline Historic Report Sheet Pictures PDF
Following slide provides data historic pipeline report which organizations utilize to gauge effectiveness of recruitment process. Pipeline report, hiring process stages, key insights, etc. are few of the elements demonstrated in this slide. Pitch your topic with ease and precision using this Monitoring Recruitment Pipeline Historic Report Sheet Pictures PDF. This layout presents information on Candidates Moved Forward, Disqualified Candidates, Candidates Under Consideration. It is also available for immediate download and adjustment. So, changes can be made in the color, design, graphics or any other component to create a unique layout

Customer Retention Business Monthly Report Summary With Graphs Guidelines PDF
The Following Slide highlights the Customer Retention Monthly Report with graphs . It showcases data and graphs with headings, metrics, current month, last month , change , customer churn , revenue churn , net retention and MRR growth. Showcasing this set of slides titled Customer Retention Business Monthly Report Summary With Graphs Guidelines PDF The topics addressed in these templates are Recurring Revenue, Customer Churn, Promoter Score All the content presented in this PPT design is completely editable. Download it and make adjustments in color, background, font etc. as per your unique business setting.

Automotive Industry Report Motor Vehicle Production By Type Portrait PDF
This slide covers the details of the data related to vehicle production all over the world in last 10 years to know where we are right now and what is needed to be at a good spot in future. Pitch your topic with ease and precision using this Automotive Industry Report Motor Vehicle Production By Type Portrait PDF. This layout presents information on Automotive Industry Report, Motor Vehicle Production. It is also available for immediate download and adjustment. So, changes can be made in the color, design, graphics or any other component to create a unique layout.

Call Center Performance KPI Dashboard Formats PDF
This slide covers contact center performance metrics KPI dashboard. It involves details such as number of total calls, average answer speed, abandon rate, data of agents performance and call abandon rate by departments. Showcasing this set of slides titled Call Center Performance KPI Dashboard Formats PDF. The topics addressed in these templates are Department, Dashboard, Agreement Limits. All the content presented in this PPT design is completely editable. Download it and make adjustments in color, background, font etc. as per your unique business setting.

Vehicle Management System KPI Dashboard Introduction PDF
This slide represents the dashboard showing real time data of fleet management to cut down operational costs and improve efficiency. It includes key metrics such as vehicles with errors, warnings, deviation from route, total vehicles, vehicles condition etc. Pitch your topic with ease and precision using this Vehicle Management System KPI Dashboard Introduction PDF. This layout presents information on Vehicle Management System, KPI Dashboard. It is also available for immediate download and adjustment. So, changes can be made in the color, design, graphics or any other component to create a unique layout.

Analyzing And Deploying HR Analytics Diversity Dashboard Of Enterprise Inspiration PDF
This slide shows the key performance metrics dashboard showing data related to HR operations of an organization. It shows key metrics such as gender diversity by business unit, headcount by seniority and age banding etc. Want to ace your presentation in front of a live audience Our Analyzing And Deploying HR Analytics Diversity Dashboard Of Enterprise Inspiration PDF can help you do that by engaging all the users towards you. Slidegeeks experts have put their efforts and expertise into creating these impeccable powerpoint presentations so that you can communicate your ideas clearly. Moreover, all the templates are customizable, and easy-to-edit and downloadable. Use these for both personal and commercial use.

KPI Dashboard For Modernizing Hospitality Business Inspiration PDF
The following slide showcases dashboard to track data and perform analytics for managing staff, ordering supplies and to maintain customer satisfaction. It presents information related to expenses, sales, etc. Pitch your topic with ease and precision using this KPI Dashboard For Modernizing Hospitality Business Inspiration PDF. This layout presents information on Fiscal Year, Labor, Modernizing Hospitality. It is also available for immediate download and adjustment. So, changes can be made in the color, design, graphics or any other component to create a unique layout.

Departments Of Visualization Research Tableau As Visualization Research Tool Demonstration PDF
This slide shows the tableau visualization research tool in which users can construct and share interactive and editable dashboards that represent data in charts.Presenting Departments Of Visualization Research Tableau As Visualization Research Tool Demonstration PDF to provide visual cues and insights. Share and navigate important information on ten stages that need your due attention. This template can be used to pitch topics like Business Intelligence, Dashboards That Represent, Business Intelligence In addtion, this PPT design contains high resolution images, graphics, etc, that are easily editable and available for immediate download.
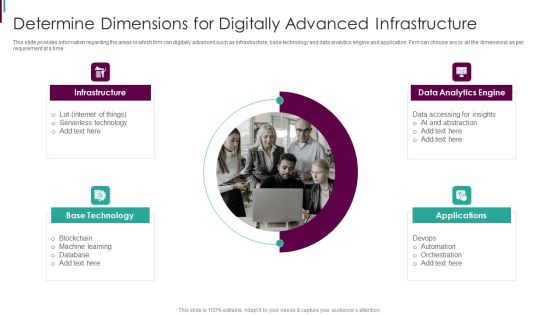
Developing Business Analytics Framework Determine Dimensions Diagrams PDF
This slide provides information regarding the areas in which firm can digitally advanced such as infrastructure, base technology and data analytics engine and application. Firm can choose any or all the dimensions as per requirement at a time. This is a Developing Business Analytics Framework Determine Dimensions Diagrams PDF template with various stages. Focus and dispense information on four stages using this creative set, that comes with editable features. It contains large content boxes to add your information on topics like Infrastructure, Analytics Engine, Base Technology You can also showcase facts, figures, and other relevant content using this PPT layout. Grab it now.

Dashboard For Content Delivery Network Ppt PowerPoint Presentation File Styles PDF
This slide depicts the dashboard for content delivery network which projects the usage of resources, increase in data transfer and usage of CDN. From laying roadmaps to briefing everything in detail, our templates are perfect for you. You can set the stage with your presentation slides. All you have to do is download these easy to edit and customizable templates. Dashboard For Content Delivery Network Ppt PowerPoint Presentation File Styles PDF will help you deliver an outstanding performance that everyone would remember and praise you for. Do download this presentation today.
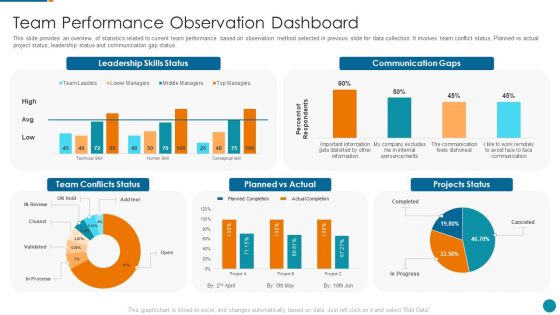
Strategic Procedure To Improve Employee Efficiency Team Performance Observation Dashboard Formats PDF
This slide provides an overview of statistics related to current team performance based on observation method selected in previous slide for data collection. It involves team conflict status, Planned vs actual project status, leadership status and communication gap status.Deliver an awe inspiring pitch with this creative strategic procedure to improve employee efficiency team performance observation dashboard formats pdf bundle. Topics like leadership skills status, communication gaps, planned vs actual can be discussed with this completely editable template. It is available for immediate download depending on the needs and requirements of the user.
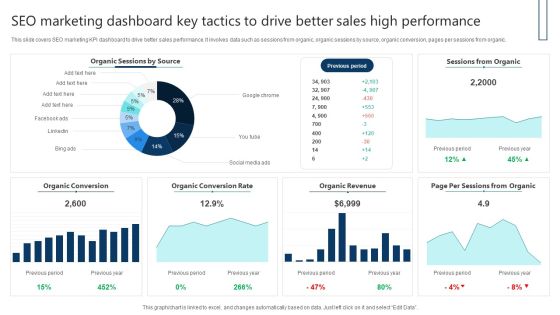
SEO Marketing Dashboard Key Tactics To Drive Better Sales High Performance Themes PDF
This slide covers SEO marketing KPI dashboard to drive better sales performance. It involves data such as sessions from organic, organic sessions by source, organic conversion, pages per sessions from organic. Showcasing this set of slides titled SEO Marketing Dashboard Key Tactics To Drive Better Sales High Performance Themes PDF. The topics addressed in these templates are Sessions From Organic, Organic Revenue, Organic Conversion Rate. All the content presented in this PPT design is completely editable. Download it and make adjustments in color, background, font etc. as per your unique business setting.

Quantitative Risk Assessment Work Break Down Structure For Project Demonstration PDF
This slide provides the glimpse about the work breakdown structure WBS for the project which focuses on different software phases to schedule the project. Presenting Quantitative Risk Assessment Work Break Down Structure For Project Demonstration PDF to provide visual cues and insights. Share and navigate important information on three stages that need your due attention. This template can be used to pitch topics like Data Requirements, Process Requirements, Conceptual Design, Equipment. In addtion, this PPT design contains high resolution images, graphics, etc, that are easily editable and available for immediate download.

Financial Evaluation Report For Construction Project Ppt PowerPoint Presentation Complete Deck With Slides
This Financial Evaluation Report For Construction Project Ppt PowerPoint Presentation Complete Deck With Slides is designed to help you retain your audiences attention. This content-ready PowerPoint Template enables you to take your audience on a journey and share information in a way that is easier to recall. It helps you highlight the crucial parts of your work so that the audience does not get saddled with information download. This fourty three slide PPT Deck comes prepared with the graphs and charts you could need to showcase your information through visuals. You only need to enter your own data in them. Download this editable PowerPoint Theme and walk into that meeting with confidence.

Logistics Transport Company Financial Report Ppt PowerPoint Presentation Complete Deck With Slides
This Logistics Transport Company Financial Report Ppt PowerPoint Presentation Complete Deck With Slides is designed to help you retain your audiences attention. This content-ready PowerPoint Template enables you to take your audience on a journey and share information in a way that is easier to recall. It helps you highlight the crucial parts of your work so that the audience does not get saddled with information download. This eighteen slide PPT Deck comes prepared with the graphs and charts you could need to showcase your information through visuals. You only need to enter your own data in them. Download this editable PowerPoint Theme and walk into that meeting with confidence.
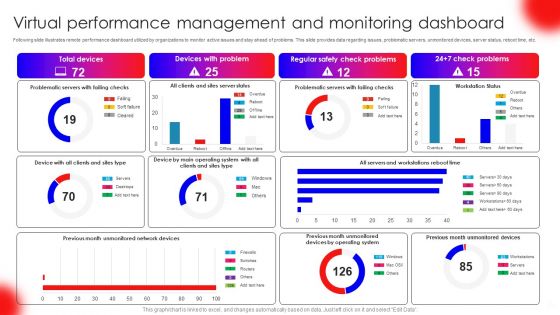
Virtual Performance Management And Monitoring Dashboard Pictures PDF
Following slide illustrates remote performance dashboard utilized by organizations to monitor active issues and stay ahead of problems. This slide provides data regarding issues, problematic servers, unmonitored devices, server status, reboot time, etc. Pitch your topic with ease and precision using this Virtual Performance Management And Monitoring Dashboard Pictures PDF. This layout presents information on Total Devices, Devices With Problem, Regular Safety Check Problems. It is also available for immediate download and adjustment. So, changes can be made in the color, design, graphics or any other component to create a unique layout.

Magnifying Glass Ppt PowerPoint Presentation Inspiration Themes
This is a magnifying glass ppt powerpoint presentation inspiration themes. This is a one stage process. The stages in this process are magnifying glass, search, marketing, strategy, analysis.

Dynamic Systems Development Approach Modelling Technique Of Dynamic System Development Guidelines PDF
This slide depicts modelling as a technique of DSDM which helps in the visualization of various elements of the project. Presenting Dynamic Systems Development Approach Modelling Technique Of Dynamic System Development Guidelines PDF to provide visual cues and insights. Share and navigate important information on four stages that need your due attention. This template can be used to pitch topics like Data Connections, Business Rules, Solution Area. In addtion, this PPT design contains high resolution images, graphics, etc, that are easily editable and available for immediate download.

Business IT Cyber Security Assessment Framework With Safety Programs Diagrams PDF
This slide outlines the strategic security framework created by an organization to overcome potential external or internal threats along with security programs. Risks include hacking and accidental data disclosure with certain protective programs like anti-spyware software and cloud security. Presenting Business IT Cyber Security Assessment Framework With Safety Programs Diagrams PDF to dispense important information. This template comprises four stages. It also presents valuable insights into the topics including Security Program, Threats And Risks, Protected Assets. This is a completely customizable PowerPoint theme that can be put to use immediately. So, download it and address the topic impactfully.
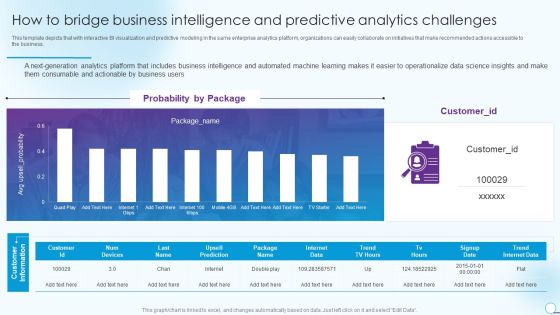
How To Bridge Business Intelligence And Predictive Analytics Challenges Microsoft PDF
This template depicts that with interactive BI visualization and predictive modeling in the same enterprise analytics platform, organizations can easily collaborate on initiatives that make recommended actions accessible to the business. Deliver an awe inspiring pitch with this creative How To Bridge Business Intelligence And Predictive Analytics Challenges Microsoft PDF bundle. Topics like Business Intelligence, Operationalize Data Science, Probability By Package can be discussed with this completely editable template. It is available for immediate download depending on the needs and requirements of the user.

Manufactured Products Sales Performance Monitoring Dashboard Information PDF
This slide shows the dashboard the data related to the sales performance of the products manufactured by the organization in order to effectively measure and monitor the performance of the sales team. It shows details related to revenue generated and units sold etc.Pitch your topic with ease and precision using this Manufactured Products Sales Performance Monitoring Dashboard Information PDF. This layout presents information on Monthly Revenue, Manufactured Products, Sales Performance Monitoring. It is also available for immediate download and adjustment. So, changes can be made in the color, design, graphics or any other component to create a unique layout.
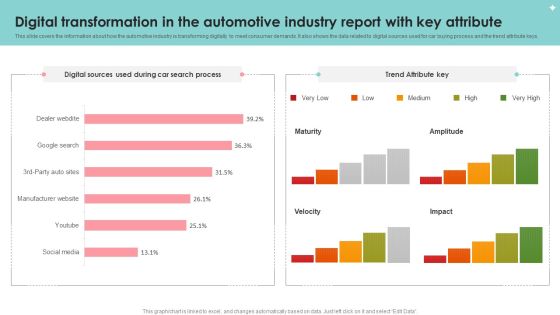
Digital Transformation In The Automotive Industry Report With Key Attribute Slides PDF
This slide covers the information about how the automotive industry is transforming digitally to meet consumer demands. It also shows the data related to digital sources used for car buying process and the trend attribute keys. Pitch your topic with ease and precision using this Digital Transformation In The Automotive Industry Report With Key Attribute Slides PDF. This layout presents information on Digital Transformation, Automotive Industry Report, Key Attribute. It is also available for immediate download and adjustment. So, changes can be made in the color, design, graphics or any other component to create a unique layout.
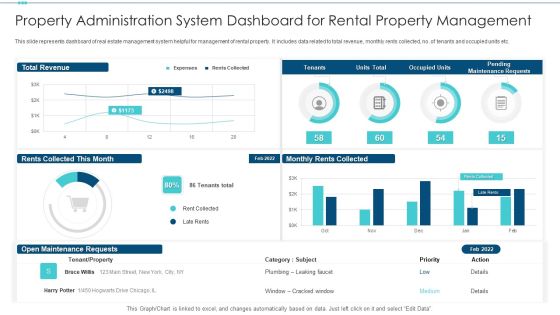
Property Administration System Dashboard For Rental Property Management Inspiration PDF
This slide represents dashboard of real estate management system helpful for management of rental property. It includes data related to total revenue, monthly rents collected, no .of tenants and occupied units etc. Showcasing this set of slides titled property administration system dashboard for rental property management inspiration pdf. The topics addressed in these templates are property administration system dashboard for rental property management. All the content presented in this PPT design is completely editable. Download it and make adjustments in color, background, font etc. as per your unique business setting.

Portfolio Portfolio Management Procedure KPI Dashboard Demonstration PDF
This slide covers investment portfolio management process KPI dashboard. It involves data such as total invested amount, total number of investments, rate of return, total investment on yearly and group rating basis.Showcasing this set of slides titled Portfolio Portfolio Management Procedure KPI Dashboard Demonstration PDF The topics addressed in these templates are Total Investment, Credit Basis, Total Investments All the content presented in this PPT design is completely editable. Download it and make adjustments in color, background, font etc. as per your unique business setting.

Advertising And Marketing Campaign Strategy Success Communication Dashboard Inspiration PDF
This slide depicts a multi channel dashboard for tracking advertising and marketing campaign plan success which provides real time data to track the performance of marketing efforts. The various key performing indicators are cost, conversions and channel performance Showcasing this set of slides titled Advertising And Marketing Campaign Strategy Success Communication Dashboard Inspiration PDF. The topics addressed in these templates are Conversions, Spend, Channel. All the content presented in this PPT design is completely editable. Download it and make adjustments in color, background, font etc. as per your unique business setting.

Technology Tools For Staff Support And Management Microsoft PDF
The following slide highlights employee support and management using technology tools. It includes tools such as paperless HR, pulse surveys, tech stacks, marketing tools and data and analytics etc. Presenting Technology Tools For Staff Support And Management Microsoft PDF to dispense important information. This template comprises five stages. It also presents valuable insights into the topics including Tech Stacks, Marketing Tools, Pulse Surveys. This is a completely customizable PowerPoint theme that can be put to use immediately. So, download it and address the topic impactfully.
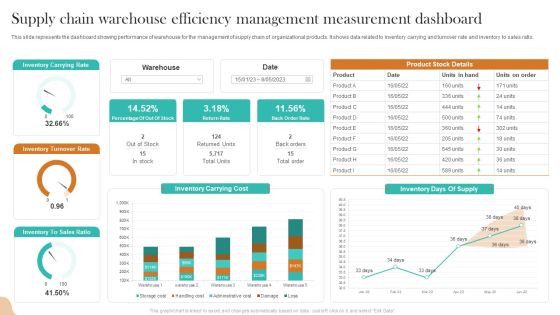
Supply Chain Warehouse Efficiency Management Measurement Dashboard Inspiration PDF
This slide represents the dashboard showing performance of warehouse for the management of supply chain of organizational products. It shows data related to inventory carrying and turnover rate and inventory to sales ratio. Pitch your topic with ease and precision using this Supply Chain Warehouse Efficiency Management Measurement Dashboard Inspiration PDF. This layout presents information on Inventory Carrying Rate, Inventory Turnover Rate, Inventory Carrying Cost. It is also available for immediate download and adjustment. So, changes can be made in the color, design, graphics or any other component to create a unique layout.
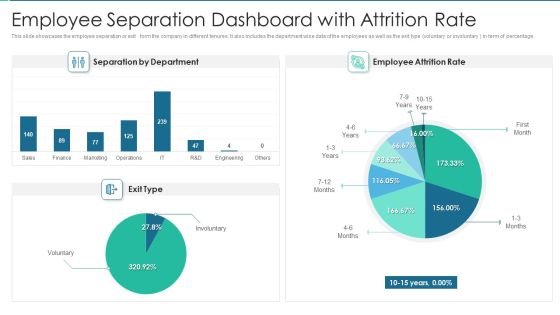
Employee Separation Dashboard With Attrition Rate Elements PDF
This slide showcases the employee separation or exit form the company in different tenures. It also includes the department wise data of the employees as well as the exit type voluntary or involuntary in term of percentage.Showcasing this set of slides titled Employee Separation Dashboard With Attrition Rate Elements PDF The topics addressed in these templates are Separation By Department, Employee Attrition Rate All the content presented in this PPT design is completely editable. Download it and make adjustments in color, background, font etc. as per your unique business setting.

KPI Dashboard To Monitor Performance Of Dcaas Pictures PDF
Following slide highlights major benefits of applying data center as a service to business operations which can be used by businesses looking to modernize their IT infrastructure. Major benefits are in terms of scalability, flexibility, cost effectiveness, and security. Pitch your topic with ease and precision using this KPI Dashboard To Monitor Performance Of Dcaas Pictures PDF. This layout presents information on Customer Type, Counts By Model Attributes, Items By Status. It is also available for immediate download and adjustment. So, changes can be made in the color, design, graphics or any other component to create a unique layout.

Business Procedures Improvement Methodology Flow Chart For Project Management Ideas PDF
Following slide shows the flow diagram for the business process reengineering technique which assist in radical restructuring of business processes to achieve radically improved quality and output. It covers under various phases such as management decision, implementation, etc. Persuade your audience using this Business Procedures Improvement Methodology Flow Chart For Project Management Ideas PDF. This PPT design covers one stages, thus making it a great tool to use. It also caters to a variety of topics including Project Management, Collect Data Organizations, Redical Adjustments. Download this PPT design now to present a convincing pitch that not only emphasizes the topic but also showcases your presentation skills.
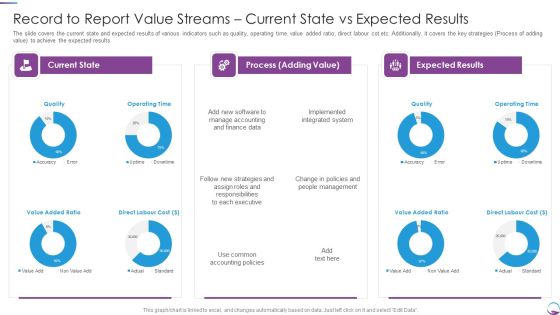
Record To Report Value Streams Current State Vs Expected Results Professional PDF
The slide covers the current state and expected results of various indicators such as quality, operating time, value added ratio, direct labour cot etc. Additionally, it covers the key strategies Process of adding value to achieve the expected results. Deliver and pitch your topic in the best possible manner with this Record To Report Value Streams Current State Vs Expected Results Professional PDF. Use them to share invaluable insights on Management, Strategies, Executive, Finance Data and impress your audience. This template can be altered and modified as per your expectations. So, grab it now.
Strategies For Mitigating Online Risk In Organization Guidelines PDF
The purpose of this slide is to represent the strategies for mitigating digital risk in organizations to prevent data leakage and other threats. It includes various strategies such as asset discovery and attack surface monitoring, threat intelligence, in-depth investigation and actionable reports. Presenting Strategies For Mitigating Online Risk In Organization Guidelines PDF to dispense important information. This template comprises four stages. It also presents valuable insights into the topics including Threat Intelligence, In Depth Investigation, Actionable Reports. This is a completely customizable PowerPoint theme that can be put to use immediately. So, download it and address the topic impactfully.

Usa Ppt Template Linear Arrow 11 Phase Diagram Time Management PowerPoint 6 Design
USA PPT template linear arrow 11 phase diagram time management powerpoint 6 design-This linear arrow chart makes information accessible throughout the organization with a collective, visible view of critical data from different perspectives and providing the tools to upcoming business scenarios and plan for change.-USA PPT template linear arrow 11 phase diagram time management powerpoint 6 design-Arrow, Background, Collection, Completed, Concept, Confirmation, Design, Flow, Graph, Graphic, Illustration, Indication, Indicator, Information, Instruction, Interface, Internet, Layout, Measurement, Order, Phase, Pointer, Process, Progress, Reflection, Scale, Shape, Sign
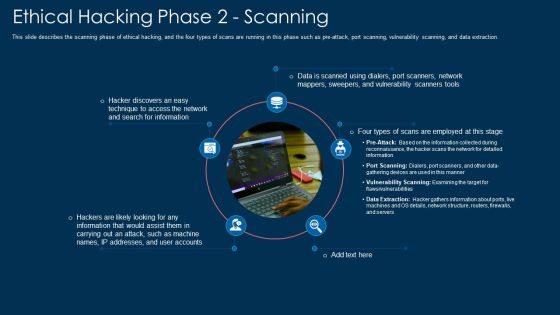
Ethical Hacking Phase 2 Scanning Ppt Infographic Template Design Templates PDF
This slide describes the scanning phase of ethical hacking, and the four types of scans are running in this phase such as pre-attack, port scanning, vulnerability scanning, and data extraction. This is a ethical hacking phase 2 scanning ppt infographic template design templates pdf template with various stages. Focus and dispense information on five stages using this creative set, that comes with editable features. It contains large content boxes to add your information on topics like information, network, technique. You can also showcase facts, figures, and other relevant content using this PPT layout. Grab it now.
Cognitive Robotic Process Automation Systems Implementation Phases Topics PDF
This slide highlights implementation of cognitive RPA tools aimed at utilizing data to train algorithms for performing complex tasks. It covers task elaboration, identify required technologies, consultancy, cost estimation, test prototype and integrate AI with bot. Presenting Cognitive Robotic Process Automation Systems Implementation Phases Topics PDF to dispense important information. This template comprises six stages. It also presents valuable insights into the topics including Identify Required Technologies, Consultancy, Task Elaboration. This is a completely customizable PowerPoint theme that can be put to use immediately. So, download it and address the topic impactfully.

RPA Discovery Procedure Security Steps Brochure PDF
Following slide exhibits steps for robotic process automation security. Purpose of this slide is to use business automation efficiently that prevents data leakage and fraud. It includes pointers such as bot actions accountability, avoid fraud, secure log integrity etc. Presenting RPA Discovery Procedure Security Steps Brochure PDF to dispense important information. This template comprises four stages. It also presents valuable insights into the topics including Bot Actions Accountability, Avoid Errors And Fraud, Secure Log Integrity. This is a completely customizable PowerPoint theme that can be put to use immediately. So, download it and address the topic impactfully.
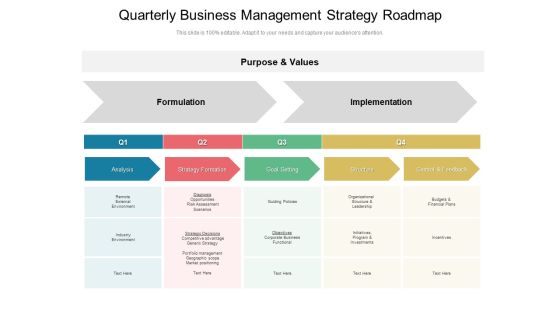
Quarterly Business Management Strategy Roadmap Graphics
Presenting the five years business and data management roadmap background. The template includes a roadmap that can be used to initiate a strategic plan. Not only this, the PowerPoint slideshow is completely editable and you can effortlessly modify the font size, font type, and shapes according to your needs. This PPT slide can be easily reached in standard screen and widescreen aspect ratios. The set is also available in various formats like PDF, PNG, and JPG. So download and use it multiple times as per your knowledge.


 Continue with Email

 Home
Home


