Data Analysis Icon

Predictive Data Model Predictive Analytics In Align Sales And Marketing Better Information PDF
This slide describes how predictive analytics can help align sales and marketing better. Predictive analytics can help get insights from sales and marketing teams that can help to improve several factors, including handing off leads, communication of promotions, and so on. Are you searching for a Predictive Data Model Predictive Analytics In Align Sales And Marketing Better Information PDF that is uncluttered, straightforward, and original Its easy to edit, and you can change the colors to suit your personal or business branding. For a presentation that expresses how much effort you have put in, this template is ideal With all of its features, including tables, diagrams, statistics, and lists, its perfect for a business plan presentation. Make your ideas more appealing with these professional slides. Download Predictive Data Model Predictive Analytics In Align Sales And Marketing Better Information PDF from Slidegeeks today.

Risk Management Model For Data Security Information Security Decision Framework Prism Diagrams PDF
Deliver an awe inspiring pitch with this creative Risk Management Model For Data Security Information Security Decision Framework Prism Diagrams PDF bundle. Topics like Key Risk Areas, Vectors, Risk Factors, Prioritization Weighting, Resource Allocation can be discussed with this completely editable template. It is available for immediate download depending on the needs and requirements of the user.

Agile Techniques For Data Migration Available Agile Methodologies For Project Extreme Themes PDF
Mentioned slide illustrates extreme programming process that can be used by the organization for its data conversion project. It also covers the basic information about XP programming process design principle and its testing approach. Deliver an awe inspiring pitch with this creative Agile Techniques For Data Migration Available Agile Methodologies For Project Extreme Themes PDF bundle. Topics like Priorities, Effort Estimates, Continuous Integration, Feedback, Iterations Release Phase can be discussed with this completely editable template. It is available for immediate download depending on the needs and requirements of the user.
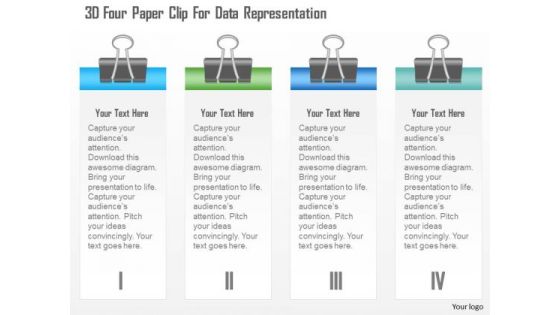
Busines Diagram 3d Four Paper Clip For Data Representation Presentation Template
This business diagram displays 3d paper clips with four text boxes. This editable text boxes diagram can be used for data representation. Use this slide to make professional presentations.

Business Planning Strategy 4 Stages To Organize Data Change Management Ppt Slide
Deliver The Right Dose With Our business planning strategy 4 stages to organize data change management ppt slide Powerpoint Templates. Your Ideas Will Get The Correct Illumination. Your Abilities Have Been Lying Dormant. Awaken Them With Our Arrows Powerpoint Templates.
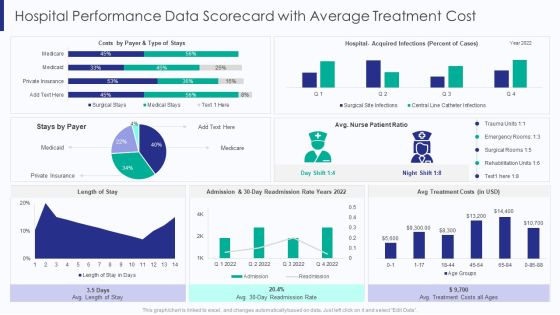
Healthcare Hospital Performance Data Scorecard With Average Treatment Cost Ppt Ideas Guide PDF
This graph or chart is linked to excel, and changes automatically based on data. Just left click on it and select Edit Data. Deliver and pitch your topic in the best possible manner with this Healthcare Hospital Performance Data Scorecard With Average Treatment Cost Ppt Ideas Guide PDF. Use them to share invaluable insights on Type Of Stays, Stays By Payer, Avg Treatment Costs, 30 Day Readmission and impress your audience. This template can be altered and modified as per your expectations. So, grab it now.
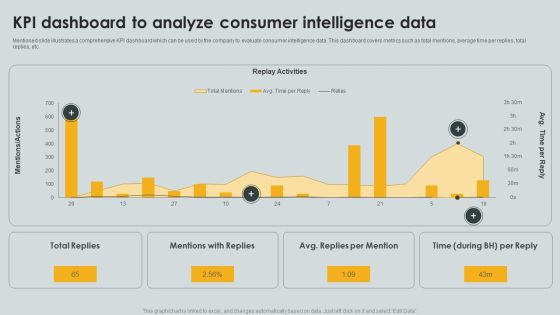
KPI Dashboard To Analyze Consumer Intelligence Data Ppt PowerPoint Presentation File Portfolio PDF
Mentioned slide illustrates a comprehensive KPI dashboard which can be used by the company to evaluate consumer intelligence data. This dashboard covers metrics such as total mentions, average time per replies, total replies, etc. Pitch your topic with ease and precision using this KPI Dashboard To Analyze Consumer Intelligence Data Ppt PowerPoint Presentation File Portfolio PDF. This layout presents information on Replay Activities, Total Replies, Mentions Replies. It is also available for immediate download and adjustment. So, changes can be made in the color, design, graphics or any other component to create a unique layout.
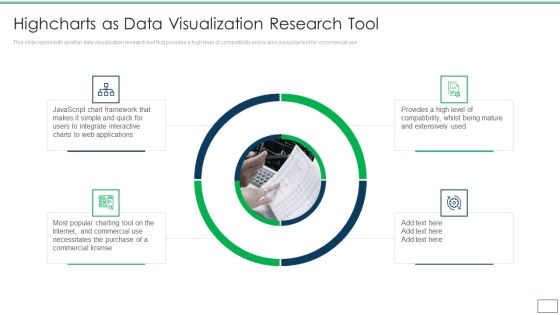
Departments Of Visualization Research Highcharts As Data Visualization Research Tool Ideas PDF
This slide represents another data visualization research tool that provides a high level of compatibility and is also a popular tool for commercial use.Presenting Departments Of Visualization Research Highcharts As Data Visualization Research Tool Ideas PDF to provide visual cues and insights. Share and navigate important information on four stages that need your due attention. This template can be used to pitch topics like Integrate Interactive, Necessitates The Purchase, Javascript Chart Framework In addtion, this PPT design contains high resolution images, graphics, etc, that are easily editable and available for immediate download.

Cyber Security Breache Response Strategy Consequences Of Data Breaches Faced By Organization Elements PDF
This slide represents the impact of data breaches experienced by an enterprise. It includes data breaches of hacking, unintended disclosure, physical loss, payment card fraud etc. Boost your pitch with our creative Cyber Security Breache Response Strategy Consequences Of Data Breaches Faced By Organization Elements PDF. Deliver an awe-inspiring pitch that will mesmerize everyone. Using these presentation templates you will surely catch everyones attention. You can browse the ppts collection on our website. We have researchers who are experts at creating the right content for the templates. So you do not have to invest time in any additional work. Just grab the template now and use them.

Latest Facts About Data Science In Iot Industry Across Countries Professional PDF
This slide covers data science trends in IOT industry across different countries. It involves details such as expected growth in upcoming years. Pitch your topic with ease and precision using this Latest Facts About Data Science In Iot Industry Across Countries Professional PDF. This layout presents information on Latest Facts, About Data Science, Iot Industry Across Countries. It is also available for immediate download and adjustment. So, changes can be made in the color, design, graphics or any other component to create a unique layout.

KPI Dashboard To Monitor Workforce Diversity Data And Inclusion Of IT Firm Slides PDF
Following slide demonstrates KPI dashboard to track diversity and inclusion which can be used by managers to develop workforce for business . It includes elements such as hiring data diversity, performance rating, promotion rate, promotion percentage, employee turnover, top management gender diversity, etc. Showcasing this set of slides titled KPI Dashboard To Monitor Workforce Diversity Data And Inclusion Of IT Firm Slides PDF. The topics addressed in these templates are Employee Turnover, Management, Promotion Rate. All the content presented in this PPT design is completely editable. Download it and make adjustments in color, background, font etc. as per your unique business setting.

Retail Store Data Map Dashboard Ppt PowerPoint Presentation Gallery Display PDF
This slide shows retail store data inventory dashboard. It provides information such as units sold, on hand, stock availability, top selling items, average inventory value by product category, etc. Pitch your topic with ease and precision using this Retail Store Data Map Dashboard Ppt PowerPoint Presentation Gallery Display PDF. This layout presents information on Inventory Turn, Over Ratio, Gross Margin ROI. It is also available for immediate download and adjustment. So, changes can be made in the color, design, graphics or any other component to create a unique layout.

Comprehensive Guide To Ecommerce Forecast Demand Planning Using Historical Data Designs PDF
This slides highlights the demand forecasting using line graph of past years for order received data which includes monthly order received data with key highlights tab. Make sure to capture your audiences attention in your business displays with our gratis customizable Comprehensive Guide To Ecommerce Forecast Demand Planning Using Historical Data Designs PDF. These are great for business strategies, office conferences, capital raising or task suggestions. If you desire to acquire more customers for your tech business and ensure they stay satisfied, create your own sales presentation with these plain slides.

Procurement Strategies For Reducing Stock Wastage Forecast Demand Using Historical Sales Data Designs PDF
This slide showcases graph that can help organization to forecast the inventory requirement on the basis of sales data of previous financial years. It showcases data of last 3 years. Take your projects to the next level with our ultimate collection of Procurement Strategies For Reducing Stock Wastage Forecast Demand Using Historical Sales Data Designs PDF. Slidegeeks has designed a range of layouts that are perfect for representing task or activity duration, keeping track of all your deadlines at a glance. Tailor these designs to your exact needs and give them a truly corporate look with your own brand colors they will make your projects stand out from the rest.

Personnel Salary Summary Dashboard With EPF And ESI Data Brochure PDF
The following highlights the slide employee payroll summary dashboard with EPF and ESI data illustrating key headings which includes payroll period, tasks to do, payroll deductions, employee summary and payroll cost. Pitch your topic with ease and precision using this Personnel Salary Summary Dashboard With EPF And ESI Data Brochure PDF. This layout presents information on Employee Provident Fund, Employee State Insurance, Tax Deducted At Source. It is also available for immediate download and adjustment. So, changes can be made in the color, design, graphics or any other component to create a unique layout.

Apache Hadoop IT Apache Pig Tool For Big Data Management In Hadoop Diagrams PDF
This slide depicts the Apache pig tool for big data management in Hadoop, including its architecture, features, and various functions such as a filter, join, etc.Deliver and pitch your topic in the best possible manner with this apache hadoop it apache pig tool for big data management in hadoop diagrams pdf Use them to share invaluable insights on execution engine, programmers can build, data transformations and impress your audience. This template can be altered and modified as per your expectations. So, grab it now.

Critical Challenges Related To Data Lake Ppt PowerPoint Presentation Diagram Lists PDF
This slide depicts the challenges of data lakes such as high cost, managed difficulty, long time to value, immature data security and governance, and lack of skills. Make sure to capture your audiences attention in your business displays with our gratis customizable Critical Challenges Related To Data Lake Ppt PowerPoint Presentation Diagram Lists PDF. These are great for business strategies, office conferences, capital raising or task suggestions. If you desire to acquire more customers for your tech business and ensure they stay satisfied, create your own sales presentation with these plain slides.
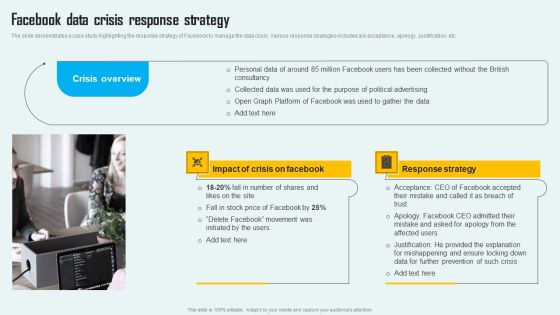
Key Phase Of Crisis Communication Management Plan Facebook Data Crisis Response Strategy Elements PDF
The slide demonstrates a case study highlighting the response strategy of Facebook to manage the data crisis. Various response strategies included are acceptance, apology. Justification, etc Do you have an important presentation coming up Are you looking for something that will make your presentation stand out from the rest Look no further than Key Phase Of Crisis Communication Management Plan Facebook Data Crisis Response Strategy Elements PDF. With our professional designs, you can trust that your presentation will pop and make delivering it a smooth process. And with Slidegeeks, you can trust that your presentation will be unique and memorable. So why wait Grab Key Phase Of Crisis Communication Management Plan Facebook Data Crisis Response Strategy Elements PDF today and make your presentation stand out from the rest.

Physical Data Flow Diagram Examples Ppt PowerPoint Presentation Portfolio Backgrounds Cpb Pdf
Presenting this set of slides with name physical data flow diagram examples ppt powerpoint presentation portfolio backgrounds cpb pdf. This is an editable Powerpoint three stages graphic that deals with topics like physical data flow diagram examples to help convey your message better graphically. This product is a premium product available for immediate download and is 100 percent editable in Powerpoint. Download this now and use it in your presentations to impress your audience.
Three Pillar Diagram Of Data Integration Ppt PowerPoint Presentation Summary Brochure PDF
Persuade your audience using this three pillar diagram of data integration ppt powerpoint presentation summary brochure pdf. This PPT design covers three stages, thus making it a great tool to use. It also caters to a variety of topics including three pillar diagram of data integration. Download this PPT design now to present a convincing pitch that not only emphasizes the topic but also showcases your presentation skills.

Circle Procedure Diagram For Enterprise Data Hub Ppt Pictures Format Ideas PDF
Persuade your audience using this circle procedure diagram for enterprise data hub ppt pictures format ideas pdf. This PPT design covers five stages, thus making it a great tool to use. It also caters to a variety of topics including circle procedure diagram for enterprise data hub. Download this PPT design now to present a convincing pitch that not only emphasizes the topic but also showcases your presentation skills.

Incorporation Of Experience Focusing On Data Driven Retail For Valuable Shopper Insights Themes PDF
This slide provides information regarding data driven retail for valuable insights in terms of in store analytics, avatar design, sustainable and efficient supply chain. This is a incorporation of experience focusing on data driven retail for valuable shopper insights themes pdf template with various stages. Focus and dispense information on three stages using this creative set, that comes with editable features. It contains large content boxes to add your information on topics like focus instore analytics, designing avatar, shopper interaction, focus sustainable and efficient supply chain. You can also showcase facts, figures, and other relevant content using this PPT layout. Grab it now.
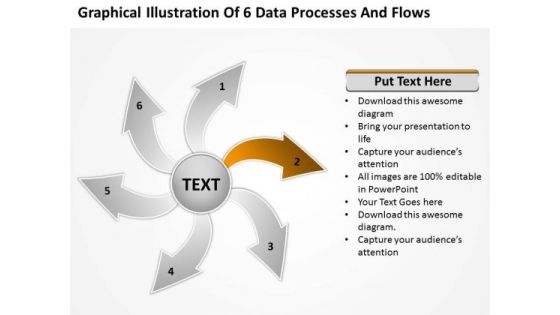
Illustration Of 6 Data Processes And Flows Cycle Arrow PowerPoint Templates
We present our illustration of 6 data processes and flows Cycle Arrow PowerPoint templates.Present our Arrows PowerPoint Templates because knowledge is power goes the popular saying. Download our Process and Flows PowerPoint Templates because there is a crucial aspect that requires extra attention. Present our Business PowerPoint Templates because the NASA Space programme took mankind to the moon and so much more. Like them you too can look far beyond normal boundaries. Show them that in your mind the sky is certainly not the limit. Download and present our Shapes PowerPoint Templates because this template helps you to bring your audiences to the table. Present our Circle Charts PowerPoint Templates because let your words be the drops of wisdom spreading knowledge and peace like ripples through the expectant minds of your devoted followers.Use these PowerPoint slides for presentations relating to Arrows, Background, Blue, Chart, Circle, Circular, Circulation, Color, Connection, Continuity, Cycle, Cyclic, Diagram, Direction, Empty, Flow, Four, Dimensional, Graph, Icon, Presentation, Process, Progress, Reason, Recycle, Recycling, Repetition, Report, Result, Ring, Rotation, Round, Scheme, Section, Step, Symbol, Teamwork. The prominent colors used in the PowerPoint template are Yellow, Gray, White. Professionals tell us our illustration of 6 data processes and flows Cycle Arrow PowerPoint templates will impress their bosses and teams. You can be sure our Circulation PowerPoint templates and PPT Slides are Functional. Customers tell us our illustration of 6 data processes and flows Cycle Arrow PowerPoint templates are specially created by a professional team with vast experience. They diligently strive to come up with the right vehicle for your brilliant Ideas. Professionals tell us our Connection PowerPoint templates and PPT Slides are Graceful. People tell us our illustration of 6 data processes and flows Cycle Arrow PowerPoint templates are Awesome. People tell us our Connection PowerPoint templates and PPT Slides are Spiffy.

Reference Data Management Banking Industry Ppt PowerPoint Presentation Infographics Diagrams Cpb Pdf
Presenting this set of slides with name reference data management banking industry ppt powerpoint presentation infographics diagrams cpb pdf. This is an editable Powerpoint three stages graphic that deals with topics like reference data management banking industry to help convey your message better graphically. This product is a premium product available for immediate download and is 100 percent editable in Powerpoint. Download this now and use it in your presentations to impress your audience.
Test Data Management Challenges Ppt PowerPoint Presentation File Diagrams Cpb Pdf
Presenting this set of slides with name test data management challenges ppt powerpoint presentation file diagrams cpb pdf. This is an editable Powerpoint seven stages graphic that deals with topics like test data management challenges to help convey your message better graphically. This product is a premium product available for immediate download and is 100 percent editable in Powerpoint. Download this now and use it in your presentations to impress your audience.
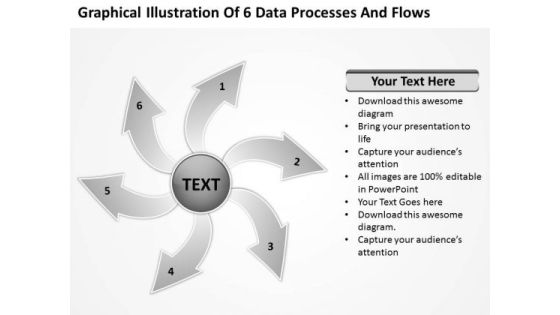
Illustration Of 6 Data Processes And Flows Circular Diagram PowerPoint Slides
We present our illustration of 6 data processes and flows Circular Diagram PowerPoint Slides.Download our Arrows PowerPoint Templates because They will bring a lot to the table. Their alluring flavours will make your audience salivate. Present our Process and Flows PowerPoint Templates because Our PowerPoint Templates and Slides will bullet point your ideas. See them fall into place one by one. Present our Business PowerPoint Templates because your product has established a foothold in the market. Customers are happy with the value it brings to their lives. Present our Shapes PowerPoint Templates because Our PowerPoint Templates and Slides team portray an attitude of elegance. Personify this quality by using them regularly. Present our Circle Charts PowerPoint Templates because you can gain the success to desired levels in one go.Use these PowerPoint slides for presentations relating to Arrows, Background, Blue, Chart, Circle, Circular, Circulation, Color, Connection, Continuity, Cycle, Cyclic, Diagram, Direction, Empty, Flow, Four, Dimensional, Graph, Icon, Presentation, Process, Progress, Reason, Recycle, Recycling, Repetition, Report, Result, Ring, Rotation, Round, Scheme, Section, Step, Symbol, Teamwork. The prominent colors used in the PowerPoint template are Gray, Black, White. Professionals tell us our illustration of 6 data processes and flows Circular Diagram PowerPoint Slides are Stunning. You can be sure our Circle PowerPoint templates and PPT Slides will make the presenter successul in his career/life. Customers tell us our illustration of 6 data processes and flows Circular Diagram PowerPoint Slides are Precious. Professionals tell us our Chart PowerPoint templates and PPT Slides are Gorgeous. People tell us our illustration of 6 data processes and flows Circular Diagram PowerPoint Slides are Playful. People tell us our Circle PowerPoint templates and PPT Slides are One-of-a-kind.

Optimizing Digital Marketing Strategy Generate First Party Data Using Other Sources Background PDF
This template covers techniques and benefits of generating first-party data using app users and offline touchpoints. It also includes steps for data generation, such as adding a software development kit, using Google Analytics, invest in CRM and measurement tools. Whether you have daily or monthly meetings, a brilliant presentation is necessary. Optimizing Digital Marketing Strategy Generate First Party Data Using Other Sources Background PDF can be your best option for delivering a presentation. Represent everything in detail using Optimizing Digital Marketing Strategy Generate First Party Data Using Other Sources Background PDF and make yourself stand out in meetings. The template is versatile and follows a structure that will cater to your requirements. All the templates prepared by Slidegeeks are easy to download and edit. Our research experts have taken care of the corporate themes as well. So, give it a try and see the results.

Healthcare Data Mining System Approaches Ppt PowerPoint Presentation Ideas Gridlines PDF
This slide mentions data mining system approaches applicable in medical and healthcare industry. It includes Analytics system, Content system, Deployment system. Persuade your audience using this Healthcare Data Mining System Approaches Ppt PowerPoint Presentation Ideas Gridlines PDF. This PPT design covers three stages, thus making it a great tool to use. It also caters to a variety of topics including Content System, Deployment System, Analytics System. Download this PPT design now to present a convincing pitch that not only emphasizes the topic but also showcases your presentation skills.

30 60 90 Days Plan For Data Lake Implementation Ppt PowerPoint Presentation File Shapes PDF
This slide describes the 30-60-90 days plan for the data lake by covering the tasks that will be performed at each interval of 30 days post-implementation of the data lake. If you are looking for a format to display your unique thoughts, then the professionally designed 30 60 90 Days Plan For Data Lake Implementation Ppt PowerPoint Presentation File Shapes PDF is the one for you. You can use it as a Google Slides template or a PowerPoint template. Incorporate impressive visuals, symbols, images, and other charts. Modify or reorganize the text boxes as you desire. Experiment with shade schemes and font pairings. Alter, share or cooperate with other people on your work. Download 30 60 90 Days Plan For Data Lake Implementation Ppt PowerPoint Presentation File Shapes PDF and find out how to give a successful presentation. Present a perfect display to your team and make your presentation unforgettable.

Assessment And Workflow Data Center Relocation Process Step 9 Post Relocation Slides PDF
This slide shows the eighth step that is involved in data center relocation process which is to be implemented for minimizing data center costs and improving scalability i.e. post-relocation verification. If you are looking for a format to display your unique thoughts, then the professionally designed Assessment And Workflow Data Center Relocation Process Step 9 Post Relocation Slides PDF is the one for you. You can use it as a Google Slides template or a PowerPoint template. Incorporate impressive visuals, symbols, images, and other charts. Modify or reorganize the text boxes as you desire. Experiment with shade schemes and font pairings. Alter, share or cooperate with other people on your work. Download Assessment And Workflow Data Center Relocation Process Step 9 Post Relocation Slides PDF and find out how to give a successful presentation. Present a perfect display to your team and make your presentation unforgettable.

Reverse Proxy Web Server Data Center Proxy Server And Its Architecture Professional PDF
This slide depicts the data center proxy server that uses fixed IP addresses and a direct connection to send and respond to requests through data centers. If you are looking for a format to display your unique thoughts, then the professionally designed Reverse Proxy Web Server Data Center Proxy Server And Its Architecture Professional PDF is the one for you. You can use it as a Google Slides template or a PowerPoint template. Incorporate impressive visuals, symbols, images, and other charts. Modify or reorganize the text boxes as you desire. Experiment with shade schemes and font pairings. Alter, share or cooperate with other people on your work. Download Reverse Proxy Web Server Data Center Proxy Server And Its Architecture Professional PDF and find out how to give a successful presentation. Present a perfect display to your team and make your presentation unforgettable.

Business Intelligence And Big Data Analytics Transformation Toolkit Table Of Contents Diagrams PDF
This is a business intelligence and big data analytics transformation toolkit table of contents diagrams pdf template with various stages. Focus and dispense information on fiften stages using this creative set, that comes with editable features. It contains large content boxes to add your information on topics like business case and roadmap, value streams, software features, vendor scan, project plan. You can also showcase facts, figures, and other relevant content using this PPT layout. Grab it now.
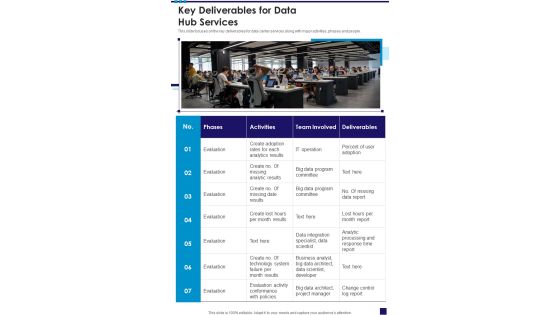
Key Deliverables For Data Hub Services One Pager Sample Example Document
This slide focuses on the key deliverables for data center services along with major activities, phases and people. Presenting you an exemplary Key Deliverables For Data Hub Services One Pager Sample Example Document. Our one pager comprises all the must have essentials of an inclusive document. You can edit it with ease, as its layout is completely editable. With such freedom, you can tweak its design and other elements to your requirements. Download this Key Deliverables For Data Hub Services One Pager Sample Example Document brilliant piece now.

Key Deliverables For Data Center Services Contractor Bid Proposal One Pager Sample Example Document
This slide focuses on the key deliverables for data center services along with major activities, phases and people. Presenting you an exemplary Key Deliverables For Data Center Services Contractor Bid Proposal One Pager Sample Example Document. Our one-pager comprises all the must-have essentials of an inclusive document. You can edit it with ease, as its layout is completely editable. With such freedom, you can tweak its design and other elements to your requirements. Download this Key Deliverables For Data Center Services Contractor Bid Proposal One Pager Sample Example Document brilliant piece now.

PIM Software Deployment To Enhance Conversion Rates Product Information Dashboard Representing Data Quality Statistics Download PDF
This slide represents the KPI dashboard representing PIM data quality statistics. It includes details related to top users, channels, number of entities created etc. Coming up with a presentation necessitates that the majority of the effort goes into the content and the message you intend to convey. The visuals of a PowerPoint presentation can only be effective if it supplements and supports the story that is being told. Keeping this in mind our experts created PIM Software Deployment To Enhance Conversion Rates Product Information Dashboard Representing Data Quality Statistics Download PDF to reduce the time that goes into designing the presentation. This way, you can concentrate on the message while our designers take care of providing you with the right template for the situation.
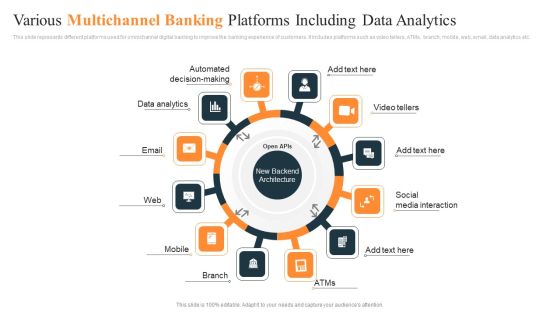
Various Multichannel Banking Platforms Including Data Analytics Ppt Portfolio Smartart PDF
This slide represents different platforms used for omnichannel digital banking to improve the banking experience of customers. It includes platforms such as video tellers, ATMs, branch, mobile, web, email, data analytics etc. Presenting Various Multichannel Banking Platforms Including Data Analytics Ppt Portfolio Smartart PDF to dispense important information. This template comprises twelve stages. It also presents valuable insights into the topics including Social Media Interaction, Branch, Web, Email, Mobile. This is a completely customizable PowerPoint theme that can be put to use immediately. So, download it and address the topic impactfully.

Table Of Contents For Data And Information Visualization Tool Structure PDF
Whether you have daily or monthly meetings, a brilliant presentation is necessary. Table Of Contents For Data And Information Visualization Tool Structure PDF can be your best option for delivering a presentation. Represent everything in detail using Table Of Contents For Data And Information Visualization Tool Structure PDF and make yourself stand out in meetings. The template is versatile and follows a structure that will cater to your requirements. All the templates prepared by Slidegeeks are easy to download and edit. Our research experts have taken care of the corporate themes as well. So, give it a try and see the results.
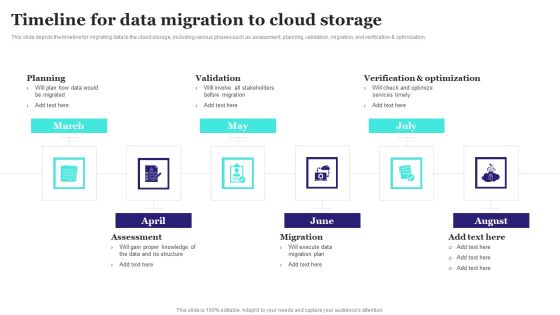
Timeline For Data Migration To Cloud Storage Ppt PowerPoint Presentation Diagram Graph Charts PDF
This slide depicts the timeline for migrating data to the cloud storage, including various phases such as assessment, planning, validation, migration, and verification and optimization. Do you have an important presentation coming up Are you looking for something that will make your presentation stand out from the rest Look no further than Timeline For Data Migration To Cloud Storage Ppt PowerPoint Presentation Diagram Graph Charts PDF. With our professional designs, you can trust that your presentation will pop and make delivering it a smooth process. And with Slidegeeks, you can trust that your presentation will be unique and memorable. So why wait Grab Timeline For Data Migration To Cloud Storage Ppt PowerPoint Presentation Diagram Graph Charts PDF today and make your presentation stand out from the rest.

3 Division Circle Graphics For Quality Of Governance Data Ppt PowerPoint Presentation Gallery Demonstration PDF
Presenting 3 division circle graphics for quality of governance data ppt powerpoint presentation gallery demonstration pdf to dispense important information. This template comprises three stages. It also presents valuable insights into the topics including 3 division circle graphics for quality of governance data. This is a completely customizable PowerPoint theme that can be put to use immediately. So, download it and address the topic impactfully.

24 Hour Timeframe Slide For Data Quality Management Best Practices Ppt PowerPoint Presentation File Show PDF
Presenting 24 hour timeframe slide for data quality management best practices ppt powerpoint presentation file show pdf to dispense important information. This template comprises six stages. It also presents valuable insights into the topics including 24 hour timeframe slide for data quality management best practices. This is a completely customizable PowerPoint theme that can be put to use immediately. So, download it and address the topic impactfully.

Cloud Data Repository Sync Process With Firewall And Security Brochure PDF
Presenting cloud data repository sync process with firewall and security brochure pdf to dispense important information. This template comprises four stages. It also presents valuable insights into the topics including synergy database server, scheduled cloud sync, firewall and security, synergy cloud data repository . This is a completely customizable PowerPoint theme that can be put to use immediately. So, download it and address the topic impactfully.

Gantt Chart For Data Hub Services Proposal One Pager Sample Example Document
Presenting you an exemplary Gantt Chart For Data Hub Services Proposal One Pager Sample Example Document. Our one pager comprises all the must have essentials of an inclusive document. You can edit it with ease, as its layout is completely editable. With such freedom, you can tweak its design and other elements to your requirements. Download this Gantt Chart For Data Hub Services Proposal One Pager Sample Example Document brilliant piece now.
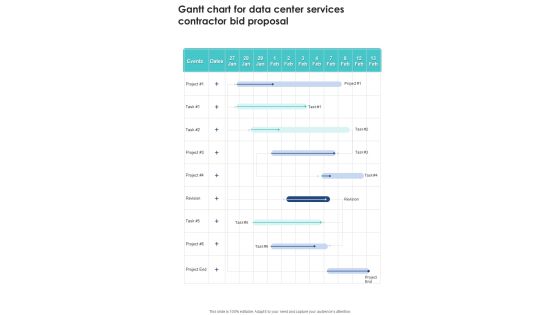
Gantt Chart For Data Center Services Contractor Bid Proposal One Pager Sample Example Document
Presenting you an exemplary Gantt Chart For Data Center Services Contractor Bid Proposal One Pager Sample Example Document. Our one-pager comprises all the must-have essentials of an inclusive document. You can edit it with ease, as its layout is completely editable. With such freedom, you can tweak its design and other elements to your requirements. Download this Gantt Chart For Data Center Services Contractor Bid Proposal One Pager Sample Example Document brilliant piece now.

Deploying AI To Enhance Global Big Data Analytics In Manufacturing Industry Market Professional PDF
This slide describes the global big data analytics in the manufacturing industry market, including CAGR rate, North Americas share in the market, year-over-year growth, market value in 2020, and growth of the solution category by 2028. Coming up with a presentation necessitates that the majority of the effort goes into the content and the message you intend to convey. The visuals of a PowerPoint presentation can only be effective if it supplements and supports the story that is being told. Keeping this in mind our experts created Deploying AI To Enhance Global Big Data Analytics In Manufacturing Industry Market Professional PDF to reduce the time that goes into designing the presentation. This way, you can concentrate on the message while our designers take care of providing you with the right template for the situation.
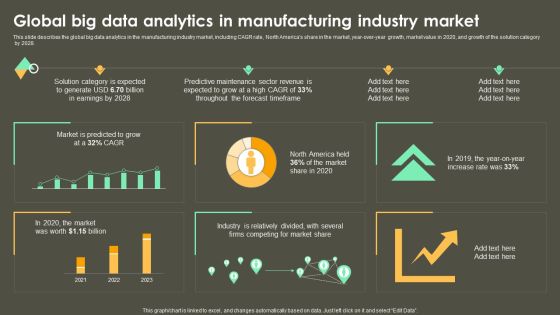
Iot Integration In Manufacturing Global Big Data Analytics In Manufacturing Industry Market Infographics PDF
This slide describes the global big data analytics in the manufacturing industry market, including CAGR rate, North Americas share in the market, year-over-year growth, market value in 2020, and growth of the solution category by 2028. Coming up with a presentation necessitates that the majority of the effort goes into the content and the message you intend to convey. The visuals of a PowerPoint presentation can only be effective if it supplements and supports the story that is being told. Keeping this in mind our experts created Iot Integration In Manufacturing Global Big Data Analytics In Manufacturing Industry Market Infographics PDF to reduce the time that goes into designing the presentation. This way, you can concentrate on the message while our designers take care of providing you with the right template for the situation.

Top Latest Facts About Data And Analytics For 2022 Themes PDF
This slide covers top data and analytics trends for 2022. It involves evolving trends such as activate dynamism and diversity, augment people and decisions and institutionalize trust. Persuade your audience using this Top Latest Facts About Data And Analytics For 2022 Themes PDF. This PPT design covers Three stages, thus making it a great tool to use. It also caters to a variety of topics including Activate Dynamism, Augment People And Decisions, Institutionalize Trust. Download this PPT design now to present a convincing pitch that not only emphasizes the topic but also showcases your presentation skills.

Predictive Data Model Predictive Analytics In Banking And Finance Industry Introduction PDF
This slide represents the application of predictive analytics in the finance and banking sector as they deal with vast amounts of data. It helps these industries identify fraudulent transactions, generate credit score, monitor credit risks, and optimize cross-sell or up-sell possibilities. Retrieve professionally designed Predictive Data Model Predictive Analytics In Banking And Finance Industry Introduction PDF to effectively convey your message and captivate your listeners. Save time by selecting pre-made slideshows that are appropriate for various topics, from business to educational purposes. These themes come in many different styles, from creative to corporate, and all of them are easily adjustable and can be edited quickly. Access them as PowerPoint templates or as Google Slides themes. You do not have to go on a hunt for the perfect presentation because Slidegeeks got you covered from everywhere.
Executing Advance Data Analytics At Workspace Tracking Intelligence Infrastructure Elements PDF
This slide portrays information regarding tracking essential activities in intelligence infrastructure dashboard in terms of IT operations, security, business analytics, internet of things, etc. Deliver an awe inspiring pitch with this creative executing advance data analytics at workspace tracking intelligence infrastructure elements pdf bundle. Topics like leveraging potential technologies beneficial to firm can be discussed with this completely editable template. It is available for immediate download depending on the needs and requirements of the user.
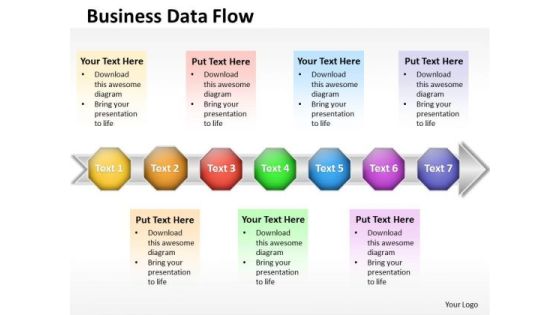
Ppt 7 Stages Self Concept PowerPoint Presentation Download Data Flow Diagram Templates
PPT 7 stages self concept powerpoint presentation download data flow diagram Templates-Use this 3D PowerPoint Diagram to describe seven stages of Linear Process through text boxes on Arrow. PowerPoint text boxes diagram templates are designed to help you place your text in a professional layout.-PPT 7 stages self concept powerpoint presentation download data flow diagram Templates-Achievement, Actualization, Basic, Belonging, Blue, Chart, Confidence, Diagram, Elements, Essential, Fundamental, Glossy, Goals, Gradient, Health, Hierarchical, Hierarchy, Human, Illustration, Isolated, Layer, Level, Love, Morality, Motivation, Needs, Person, Psychological, Psychology, Pyramid

Data Assimilation Business Intelligence KPI Dashboard Sky Ppt Background Images PDF
Deliver an awe inspiring pitch with this creative data assimilation business intelligence kpi dashboard sky ppt background images pdf bundle. Topics like expenses, working capital, checking savings, revenues, assets can be discussed with this completely editable template. It is available for immediate download depending on the needs and requirements of the user.
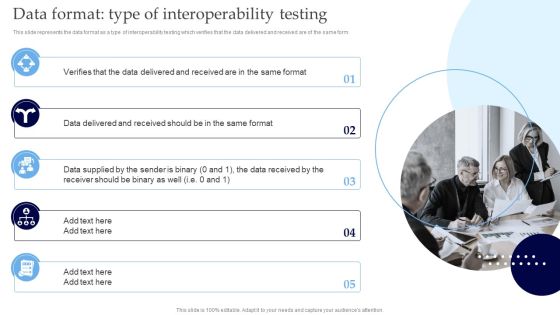
Interoperability Software Testing Data Format Type Of Interoperability Testing Slides PDF
This slide represents the data format as a type of interoperability testing which verifies that the data delivered and received are of the same form. Whether you have daily or monthly meetings, a brilliant presentation is necessary. Interoperability Software Testing Data Format Type Of Interoperability Testing Slides PDF can be your best option for delivering a presentation. Represent everything in detail using Interoperability Software Testing Data Format Type Of Interoperability Testing Slides PDF and make yourself stand out in meetings. The template is versatile and follows a structure that will cater to your requirements. All the templates prepared by Slidegeeks are easy to download and edit. Our research experts have taken care of the corporate themes as well. So, give it a try and see the results.

Data Center Relocation Process Step 4 Selecting The Destination For Relocation Topics PDF
This slide shows the fourth step that is involved in data center relocation process which is to be implemented for minimizing data center costs and improving scalability i.e. selecting the destination for relocation. Whether you have daily or monthly meetings, a brilliant presentation is necessary. Data Center Relocation Process Step 4 Selecting The Destination For Relocation Topics PDF can be your best option for delivering a presentation. Represent everything in detail using Data Center Relocation Process Step 4 Selecting The Destination For Relocation Topics PDF and make yourself stand out in meetings. The template is versatile and follows a structure that will cater to your requirements. All the templates prepared by Slidegeeks are easy to download and edit. Our research experts have taken care of the corporate themes as well. So, give it a try and see the results.

Key Factors Driving Data Center Relocation Ppt PowerPoint Presentation File Ideas PDF
This slide shows the major factorsdrivers due to which the company is looking for data center relocation. The drivers for data center relocation are increasing performance capabilities, taking advantage of geographical proximity, reduction in capital expenses and improved energy efficiency. Whether you have daily or monthly meetings, a brilliant presentation is necessary. Key Factors Driving Data Center Relocation Ppt PowerPoint Presentation File Ideas PDF can be your best option for delivering a presentation. Represent everything in detail using Key Factors Driving Data Center Relocation Ppt PowerPoint Presentation File Ideas PDF and make yourself stand out in meetings. The template is versatile and follows a structure that will cater to your requirements. All the templates prepared by Slidegeeks are easy to download and edit. Our research experts have taken care of the corporate themes as well. So, give it a try and see the results.

Agile Techniques For Data Migration Available Agile Methodologies For Project Kanban Process Themes PDF
Following slide portrays kanban process that can be used by the organization for its data conversion project. It also includes information about kanban process design principle and its testing approach. Deliver an awe inspiring pitch with this creative Agile Techniques For Data Migration Available Agile Methodologies For Project Kanban Process Themes PDF bundle. Topics like Design Principle, Nature Customer Interaction, Project Coordinator, Team Collaboration can be discussed with this completely editable template. It is available for immediate download depending on the needs and requirements of the user.

Information Security Introduction To Data Privacy Ppt PowerPoint Presentation Diagram Images PDF
This slide provides a quick overview of data privacy, which refers to a persons capacity to control how much of their personal information is shared. Do you have an important presentation coming up Are you looking for something that will make your presentation stand out from the rest Look no further than Information Security Introduction To Data Privacy Ppt PowerPoint Presentation Diagram Images PDF. With our professional designs, you can trust that your presentation will pop and make delivering it a smooth process. And with Slidegeeks, you can trust that your presentation will be unique and memorable. So why wait Grab Information Security Introduction To Data Privacy Ppt PowerPoint Presentation Diagram Images PDF today and make your presentation stand out from the rest.

Modern Security Observation Plan To Eradicate Cybersecurity Risk And Data Breach Security Monitoring Dashboard Sample PDF
Deliver an awe inspiring pitch with this creative modern security observation plan to eradicate cybersecurity risk and data breach security monitoring dashboard sample pdf bundle. Topics like security monitoring dashboard with application control and operating system statistics can be discussed with this completely editable template. It is available for immediate download depending on the needs and requirements of the user.

Data Safety Initiatives Checklist For Effectively Managing Asset Security Themes PDF
Following slide displays system management checklist that company will use for effectively managing asset security. It also includes system management activities and frequency of performing them. Deliver and pitch your topic in the best possible manner with this data safety initiatives checklist for effectively managing asset security themes pdf. Use them to share invaluable insights on system monitoring, data backup, security patches and impress your audience. This template can be altered and modified as per your expectations. So, grab it now.

BPM System Methodology Data Flow Representation Of Business Modelling Pictures PDF
This slide covers technique based on flow of data to execute various business processes. The purpose of this slide is to present graphical or visual representation using a standardized set of symbols and notations to explain several businesss operations through data movement. It includes elements such as flow of information between external entities including customer order and payment record database, etc. This modern and well-arranged BPM System Methodology Data Flow Representation Of Business Modelling Pictures PDF provides lots of creative possibilities. It is very simple to customize and edit with the Powerpoint Software. Just drag and drop your pictures into the shapes. All facets of this template can be edited with Powerpoint, no extra software is necessary. Add your own material, put your images in the places assigned for them, adjust the colors, and then you can show your slides to the world, with an animated slide included.

Defining Generic Target Marketing Techniques Analyze Online And Offline Marketing Campaigns Data Topics PDF
This template covers dashboard to measure and analyze target marketing campaign performance. It also helps in tracking and reporting online and offline marketing campaigns through KPIs such as traffic sources, lead generation metrics, offline product sales, store visitations, customer acquisition, and offline retention and advocacy. Create an editable Defining Generic Target Marketing Techniques Analyze Online And Offline Marketing Campaigns Data Topics PDF that communicates your idea and engages your audience. Whether you are presenting a business or an educational presentation, pre designed presentation templates help save time. Defining Generic Target Marketing Techniques Analyze Online And Offline Marketing Campaigns Data Topics PDF is highly customizable and very easy to edit, covering many different styles from creative to business presentations. Slidegeeks has creative team members who have crafted amazing templates. So, go and get them without any delay.

Business Diagram Five Staged Circular Ribbon Design For Data Representation Presentation Template
This business diagram displays five staged circular ribbon. This Power Point slide can be used for data representation. Use this PPT slide to show flow of activities in circular manner. Get professional with this exclusive business slide.
 Home
Home