Dashboards Construction

Kpis To Measure The Performance Of Video Marketing Strategy Microsoft PDF
The following slide outlines various key performance indicators KPIs which can be used to measure the effectiveness of video marketing strategy on social media platforms. It covers information about Facebook, Instagram and YouTube. Slidegeeks is here to make your presentations a breeze with Kpis To Measure The Performance Of Video Marketing Strategy Microsoft PDF With our easy to use and customizable templates, you can focus on delivering your ideas rather than worrying about formatting. With a variety of designs to choose from, you are sure to find one that suits your needs. And with animations and unique photos, illustrations, and fonts, you can make your presentation pop. So whether you are giving a sales pitch or presenting to the board, make sure to check out Slidegeeks first.
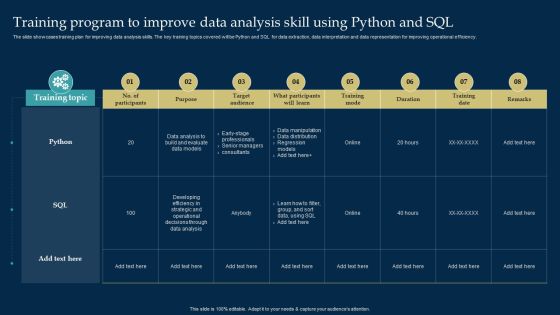
Employee Training And Development Strategy Training Program To Improve Data Analysis Skill Slides PDF
The slide showcases training plan for improving data analysis skills. The key training topics covered will be Python and SQL for data extraction, data interpretation and data representation for improving operational efficiency. Welcome to our selection of the Employee Training And Development Strategy Training Program To Improve Data Analysis Skill Slides PDF. These are designed to help you showcase your creativity and bring your sphere to life. Planning and Innovation are essential for any business that is just starting out. This collection contains the designs that you need for your everyday presentations. All of our PowerPoints are 100 percent editable, so you can customize them to suit your needs. This multi purpose template can be used in various situations. Grab these presentation templates today.

Software Data Migration Plan Process Structure PDF
Mentioned slide showcases the planning process of moving data from one application to another. It consist of various stages such as design planning, source data collection, data analysis, migration development, testing and implementation. Presenting Software Data Migration Plan Process Structure PDF to dispense important information. This template comprises six stages. It also presents valuable insights into the topics including Design Planning, Collect Source Data, Data Analysis . This is a completely customizable PowerPoint theme that can be put to use immediately. So, download it and address the topic impactfully.

Performance Assessment And Sales Initiative Report Comparison Ppt Infographics Designs PDF
Presenting this set of slides with name performance assessment and sales initiative report comparison ppt infographics designs pdf. This is a three stage process. The stages in this process are whatsapp users, twitter users, facebook users. This is a completely editable PowerPoint presentation and is available for immediate download. Download now and impress your audience.
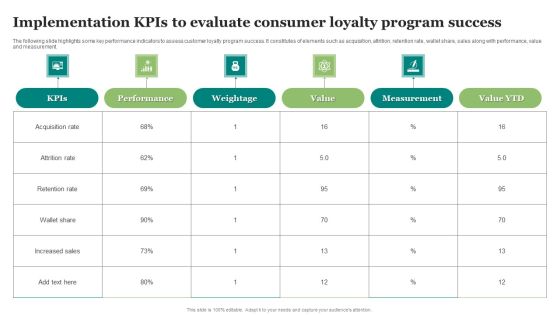
Implementation Kpis To Evaluate Consumer Loyalty Program Success Clipart PDF
The following slide highlights some key performance indicators to assess customer loyalty program success. It constitutes of elements such as acquisition, attrition, retention rate, wallet share, sales along with performance, value and measurement. Showcasing this set of slides titled Implementation Kpis To Evaluate Consumer Loyalty Program Success Clipart PDF. The topics addressed in these templates are Evaluate Consumer, Loyalty Program Success. All the content presented in this PPT design is completely editable. Download it and make adjustments in color, background, font etc. as per your unique business setting.

Business Framework Golden Circle PowerPoint Presentation
This business diagram has been designed with graphic of blue colored circle. This business slide is suitable to display data analysis in any business presentation. Use this slide to build a unique presentations for your viewers
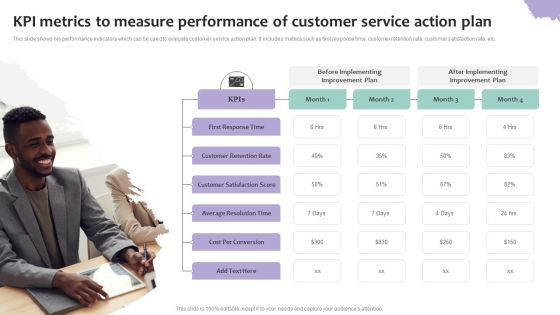
KPI Metrics To Measure Performance Of Customer Service Action Plan Diagrams PDF
This slide shows key performance indicators which can be used to evaluate customer service action plan. It includes metrics such as first response time, customer retention rate, customer satisfaction rate, etc. Persuade your audience using this KPI Metrics To Measure Performance Of Customer Service Action Plan Diagrams PDF. This PPT design covers four stages, thus making it a great tool to use. It also caters to a variety of topics including Before Implementing, Improvement Plan, After Implementing, First Response Time . Download this PPT design now to present a convincing pitch that not only emphasizes the topic but also showcases your presentation skills.

Identifying Market Trends Market Growth Trends Brand Ppt Model Graphics Design PDF
Presenting this set of slides with name identifying market trends market growth trends brand ppt model graphics design pdf. The topics discussed in these slide is market growth trends. This is a completely editable PowerPoint presentation and is available for immediate download. Download now and impress your audience.

Implementing Adaptive Work Arrangements Issues Faced By Employees And Organization Infographics PDF
The following slide outlines different problems faced by staff members and the company while working work from the office five days a week. Issues faced by employees are related to poor work-life balance, distractions at the workplace, and high budget. Issues faced by corporate are related to lower sales and profit, and a negative workplace environment. From laying roadmaps to briefing everything in detail, our templates are perfect for you. You can set the stage with your presentation slides. All you have to do is download these easy to edit and customizable templates. Implementing Adaptive Work Arrangements Issues Faced By Employees And Organization Infographics PDF will help you deliver an outstanding performance that everyone would remember and praise you for. Do download this presentation today.

Customer Satisfaction Survey Outcome Report For Ecommerce Website Themes PDF
This slide showcases customer outcome report for ecommerce website survey that can help organization to improve the navigation and usability of website on the basis of data collected. Its key components are ratings and satisfaction report. Pitch your topic with ease and precision using this Customer Satisfaction Survey Outcome Report For Ecommerce Website Themes PDF. This layout presents information on Customer Satisfaction, Survey Outcome Report, Ecommerce Website. It is also available for immediate download and adjustment. So, changes can be made in the color, design, graphics or any other component to create a unique layout.

Annual Report Design Process Ppt PowerPoint Presentation Complete Deck With Slides
This is a annual report design process ppt powerpoint presentation complete deck with slides. This is a one stage process. The stages in this process are annual report, process, business, marketing, success.

Business Advertising Strategy With Key Metrics Ppt Outline Portfolio PDF
Pitch your topic with ease and precision using this business advertising strategy with key metrics ppt outline portfolio pdf. This layout presents information on objectives, channels, competition, target audience, timeline. It is also available for immediate download and adjustment. So, changes can be made in the color, design, graphics or any other component to create a unique layout.
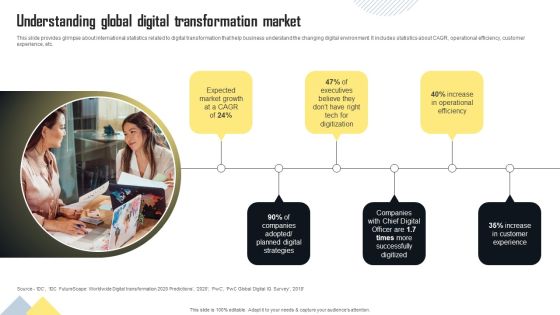
Understanding Global Digital Transformation Market Ideas PDF
This slide provides glimpse about international statistics related to digital transformation that help business understand the changing digital environment. It includes statistics about CAGR, operational efficiency, customer experience, etc. The Understanding Global Digital Transformation Market Ideas PDF is a compilation of the most recent design trends as a series of slides. It is suitable for any subject or industry presentation, containing attractive visuals and photo spots for businesses to clearly express their messages. This template contains a variety of slides for the user to input data, such as structures to contrast two elements, bullet points, and slides for written information. Slidegeeks is prepared to create an impression.

Comparative Analysis Of Data Quality Management Tools And Techniques For Process Improvement Summary PDF
This slide covers the comparative analysis of data quality management tools which focuses on tools name, value proposition to potential customers, key values and price that includes spotting of human errors, merging duplicate data, handling number of tasks, etc. Showcasing this set of slides titled comparative analysis of data quality management tools and techniques for process improvement summary pdf. The topics addressed in these templates are key values, value proposition to customers, price. All the content presented in this PPT design is completely editable. Download it and make adjustments in color, background, font etc. as per your unique business setting.

Social Platforms Data Analysis Showcasing Social Media Content Types For Businesses Inspiration PDF
This slide demonstrates the statistical data showing the results of social media content for business. It includes details related to customer engagement through image posts, stories, videos, user-generated content etc. Showcasing this set of slides titled Social Platforms Data Analysis Showcasing Social Media Content Types For Businesses Inspiration PDF. The topics addressed in these templates are Content Types For Businesses, Showcasing Social Media, Social Platforms Data Analysis. All the content presented in this PPT design is completely editable. Download it and make adjustments in color, background, font etc. as per your unique business setting.

Social Media Marketing Strategies For Building Brand Awareness Themes PDF
This slide covers various social media platforms to build brand image, increase sales, and drive website traffic. The highlighted channels include Facebook, Instagram, LinkedIn, and YouTube. The Social Media Marketing Strategies For Building Brand Awareness Themes PDF is a compilation of the most recent design trends as a series of slides. It is suitable for any subject or industry presentation, containing attractive visuals and photo spots for businesses to clearly express their messages. This template contains a variety of slides for the user to input data, such as structures to contrast two elements, bullet points, and slides for written information. Slidegeeks is prepared to create an impression.

3 Months Strategy Roadmap For Data Analysis Integration To Business Icons
Introducing our 3 months strategy roadmap for data analysis integration to business icons. This PPT presentation is Google Slides compatible, therefore, you can share it easily with the collaborators for measuring the progress. Also, the presentation is available in both standard screen and widescreen aspect ratios. So edit the template design by modifying the font size, font type, color, and shapes as per your requirements. As this PPT design is fully editable it can be presented in PDF, JPG and PNG formats.

5 Year Strategy Roadmap For Data Analysis Integration To Business Pictures
Introducing our 5 year strategy roadmap for data analysis integration to business pictures. This PPT presentation is Google Slides compatible, therefore, you can share it easily with the collaborators for measuring the progress. Also, the presentation is available in both standard screen and widescreen aspect ratios. So edit the template design by modifying the font size, font type, color, and shapes as per your requirements. As this PPT design is fully editable it can be presented in PDF, JPG and PNG formats.

6 Months Strategy Roadmap For Data Analysis Integration To Business Diagrams
Introducing our 6 months strategy roadmap for data analysis integration to business diagrams. This PPT presentation is Google Slides compatible, therefore, you can share it easily with the collaborators for measuring the progress. Also, the presentation is available in both standard screen and widescreen aspect ratios. So edit the template design by modifying the font size, font type, color, and shapes as per your requirements. As this PPT design is fully editable it can be presented in PDF, JPG and PNG formats.

Comparision Matrix To Select Best Quantitative Data Analysis Software Download PDF
Persuade your audience using this Comparision Matrix To Select Best Quantitative Data Analysis Software Download PDF. This PPT design covers six stages, thus making it a great tool to use. It also caters to a variety of topics including Manufacturer, Platform, Licensing, Features, Costing. Download this PPT design now to present a convincing pitch that not only emphasizes the topic but also showcases your presentation skills.

Food Retail US Data Analysis Chart Ppt Powerpoint Presentation Ideas Microsoft Pdf
Pitch your topic with ease and precision using this food retail us data analysis chart ppt powerpoint presentation ideas microsoft pdf. This layout presents information on seven and i holdings, amazon, southeastern grocers, albertsons, target. It is also available for immediate download and adjustment. So, changes can be made in the color, design, graphics or any other component to create a unique layout.
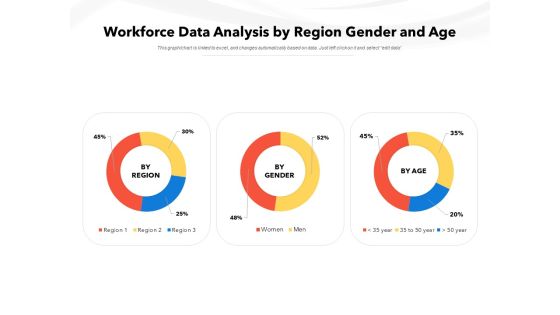
Workforce Data Analysis By Region Gender And Age Ppt PowerPoint Presentation Professional Objects PDF
Pitch your topic with ease and precision using this workforce data analysis by region gender and age ppt powerpoint presentation professional objects pdf. This layout presents information on by region, by gender, by age. It is also available for immediate download and adjustment. So, changes can be made in the color, design, graphics or any other component to create a unique layout.
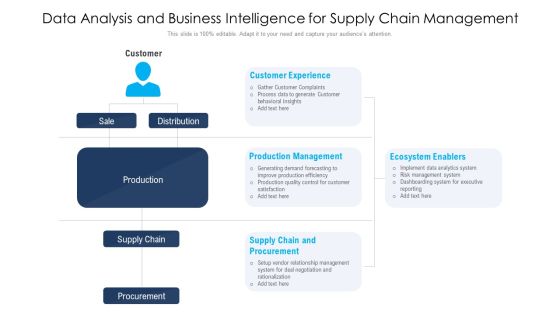
Data Analysis And Business Intelligence For Supply Chain Management Ppt PowerPoint Presentation Slides Visuals PDF
Showcasing this set of slides titled data analysis and business intelligence for supply chain management ppt powerpoint presentation slides visuals pdf. The topics addressed in these templates are production management, supply chain and procurement, customer experience. All the content presented in this PPT design is completely editable. Download it and make adjustments in color, background, font etc. as per your unique business setting.

Data Interpretation And Analysis Playbook Purpose Of This Playbook Formats PDF
Presenting data interpretation and analysis playbook purpose of this playbook formats pdf to provide visual cues and insights. Share and navigate important information on four stages that need your due attention. This template can be used to pitch topics like purpose of this playbook. In addtion, this PPT design contains high resolution images, graphics, etc, that are easily editable and available for immediate download.
Icons Slide For Comprehensive Analysis Of Different Data Lineage Classification Rules PDF
Introducing our well designed Icons Slide For Comprehensive Analysis Of Different Data Lineage Classification Rules PDF set of slides. The slide displays editable icons to enhance your visual presentation. The icons can be edited easily. So customize according to your business to achieve a creative edge. Download and share it with your audience.

Business Intelligence And Big Data Change Management Plan With Value Chain Analysis Background PDF
This slide shows the value change management lifecycle. It includes the process of collecting and publicize the data and afterwards adopting change management approach for obtaining the data driven outcomes. Presenting business intelligence and big data change management plan with value chain analysis background pdf to provide visual cues and insights. Share and navigate important information on four stages that need your due attention. This template can be used to pitch topics like collection, feedback, publication, data, analyze. In addtion, this PPT design contains high resolution images, graphics, etc, that are easily editable and available for immediate download.

Comparative Analysis Of Electronic Data Interchange And Internet Technologies Portrait PDF
This slide provides glimpse about comparison of transference of data through Electronic Data Interchange EDI and internet. It includes characteristics such as electronic commerce, data structure, etc.Pitch your topic with ease and precision using this Comparative Analysis Of Electronic Data Interchange And Internet Technologies Portrait PDF. This layout presents information on Electronic Commerce, Processing Speed, Investment Requirement. It is also available for immediate download and adjustment. So, changes can be made in the color, design, graphics or any other component to create a unique layout.
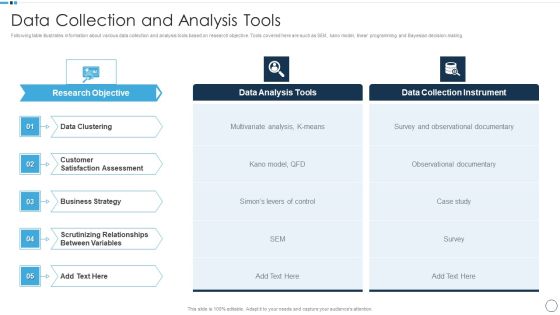
QA Plan Set 1 Data Collection And Analysis Tools Infographics PDF
Presenting QA Plan Set 1 Data Collection And Analysis Tools Infographics PDF to provide visual cues and insights. Share and navigate important information on five stages that need your due attention. This template can be used to pitch topics like Data Clustering, Business Strategy, Customer Satisfaction Assessment. In addtion, this PPT design contains high resolution images, graphics, etc, that are easily editable and available for immediate download.
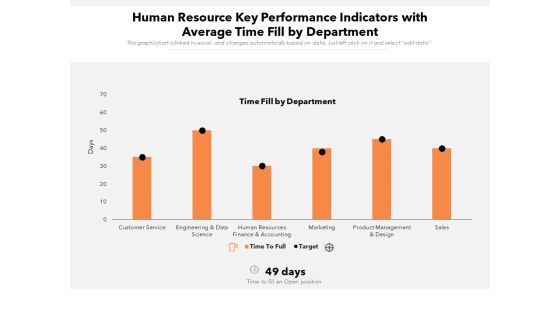
Human Resource Key Performance Indicators With Average Time Fill By Department Ppt PowerPoint Presentation Gallery Example Introduction PDF
Showcasing this set of slides titled human resource key performance indicators with average time fill by department ppt powerpoint presentation gallery example introduction pdf. The topics addressed in these templates are sales, service, finance. All the content presented in this PPT design is completely editable. Download it and make adjustments in color, background, font etc. as per your unique business setting.
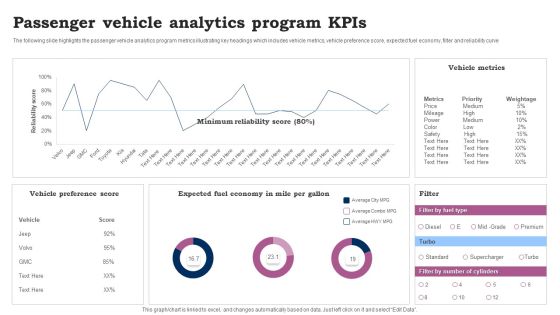
Passenger Vehicle Analytics Program Kpis Ppt Pictures Demonstration PDF
The following slide highlights the passenger vehicle analytics program metrics illustrating key headings which includes vehicle metrics, vehicle preference score, expected fuel economy, filter and reliability curve. Showcasing this set of slides titled Passenger Vehicle Analytics Program Kpis Ppt Pictures Demonstration PDF. The topics addressed in these templates are Vehicle Preference Score, Vehicle Metrics, Expected Fuel Economy. All the content presented in this PPT design is completely editable. Download it and make adjustments in color, background, font etc. as per your unique business setting.

Toolkit For Data Science And Analytics Transition Data Analytics Change Management Gantt Chart Portrait PDF
The slide shows the timeline for assessing and implementing the change in data analytics project. Get a simple yet stunning designed Toolkit For Data Science And Analytics Transition Data Analytics Change Management Gantt Chart Portrait PDF It is the best one to establish the tone in your meetings. It is an excellent way to make your presentations highly effective. So, download this PPT today from Slidegeeks and see the positive impacts. Our easy to edit Toolkit For Data Science And Analytics Transition Data Analytics Change Management Gantt Chart Portrait PDF can be your go to option for all upcoming conferences and meetings. So, what are you waiting for Grab this template today.

Comparative Analysis Of Electronic Data Interchange System And B2B Ecommerce Graphics PDF
This slide provides glimpse about comparison of Electronic Data Interchange EDI technology and B2B Ecommerce. It includes capabilities such as generating new client leads, supporting sales team, etc.Persuade your audience using this Comparative Analysis Of Electronic Data Interchange System And B2B Ecommerce Graphics PDF. This PPT design covers one stage, thus making it a great tool to use. It also caters to a variety of topics including Capability Needed, Ideal EDI, Ideal Ecommerce. Download this PPT design now to present a convincing pitch that not only emphasizes the topic but also showcases your presentation skills.

Toolkit For Data Science And Analytics Transition Vendor Profile For Data Analytics Software Introduction PDF
This slide shows the vendor scorecard for Data Analytics. It includes the multiple category of vendor profiling which can be scored and compared with different business needs. Formulating a presentation can take up a lot of effort and time, so the content and message should always be the primary focus. The visuals of the PowerPoint can enhance the presenters message, so our Toolkit For Data Science And Analytics Transition Vendor Profile For Data Analytics Software Introduction PDF was created to help save time. Instead of worrying about the design, the presenter can concentrate on the message while our designers work on creating the ideal templates for whatever situation is needed. Slidegeeks has experts for everything from amazing designs to valuable content, we have put everything into Toolkit For Data Science And Analytics Transition Vendor Profile For Data Analytics Software Introduction PDF.

Integrating Aiops To Enhance Process Effectiveness Data Collection And Analysis In Aiops Pictures PDF
The following slide shows the artificial intelligence process of data collection and analysis, the provided diagram shows the historical and real time data interpretation through machine learning. Do you have an important presentation coming up Are you looking for something that will make your presentation stand out from the rest Look no further than Integrating Aiops To Enhance Process Effectiveness Data Collection And Analysis In Aiops Pictures PDF. With our professional designs, you can trust that your presentation will pop and make delivering it a smooth process. And with Slidegeeks, you can trust that your presentation will be unique and memorable. So why wait Grab Integrating Aiops To Enhance Process Effectiveness Data Collection And Analysis In Aiops Pictures PDF today and make your presentation stand out from the rest.

Key Components Of Business Structure Framework Ppt PowerPoint Presentation File Graphics PDF
Persuade your audience using this key components of business structure framework ppt powerpoint presentation file graphics pdf. This PPT design covers one stages, thus making it a great tool to use. It also caters to a variety of topics including stakeholders, policies, rules, regulations, capabilities, vision , strategies and tactics, organization, information, value streams, products and services, metrics and measures, decision and events, initiatives and projects, business architecture. Download this PPT design now to present a convincing pitch that not only emphasizes the topic but also showcases your presentation skills.

Data And Customer Analysis Company Outline Financial Performance Estimation FY22 Pictures PDF
This slide highlights the Nielsen financial performance guidance which includes the EBITDA, free cash flow, organic CC growth, interest expense, tax rate, depreciation and amortization, and average diluted shares. Formulating a presentation can take up a lot of effort and time, so the content and message should always be the primary focus. The visuals of the PowerPoint can enhance the presenters message, so our Data And Customer Analysis Company Outline Financial Performance Estimation FY22 Pictures PDF was created to help save time. Instead of worrying about the design, the presenter can concentrate on the message while our designers work on creating the ideal templates for whatever situation is needed. Slidegeeks has experts for everything from amazing designs to valuable content, we have put everything into Data And Customer Analysis Company Outline Financial Performance Estimation FY22 Pictures PDF
Information Visualizations Playbook Business Intelligence And Predictive Analytics Challenges Icons PDF
This template covers the problems while implementing BI and predictive analytics in the organization. The challenges are undefined KPIs and metrics, and unable to hire right data science talent. Presenting Information Visualizations Playbook Business Intelligence And Predictive Analytics Challenges Icons PDF to provide visual cues and insights. Share and navigate important information on two stages that need your due attention. This template can be used to pitch topics like Raw Data Organized, Security Vulnerabilities, Perform Analysis. In addtion, this PPT design contains high resolution images, graphics, etc, that are easily editable and available for immediate download.
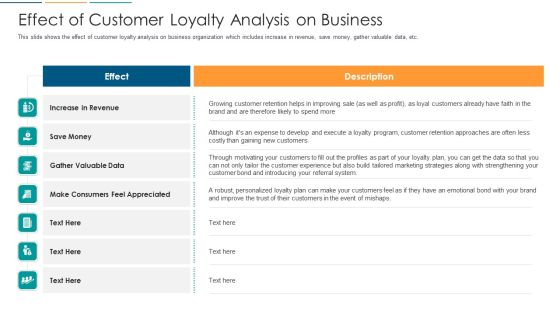
Effect Of Customer Loyalty Analysis On Business Ppt Infographics Slides PDF
This slide shows the effect of customer loyalty analysis on business organization which includes increase in revenue, save money, gather valuable data, etc. Presenting effect of customer loyalty analysis on business ppt infographics slides pdf. to provide visual cues and insights. Share and navigate important information on two stages that need your due attention. This template can be used to pitch topics like increase in revenue, gather valuable data, customers, sale. In addtion, this PPT design contains high resolution images, graphics, etc, that are easily editable and available for immediate download.
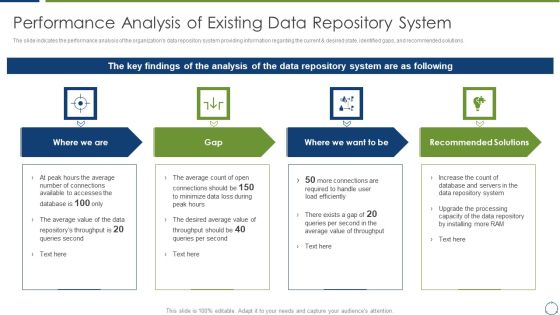
Horizontal Scaling Technique For Information Performance Analysis Of Existing Data Repository System Demonstration PDF
The slide indicates the performance analysis of the organizations data repository system providing information regarding the current and desired state, identified gaps, and recommended solutions.Presenting Horizontal Scaling Technique For Information Performance Analysis Of Existing Data Repository System Demonstration PDF to provide visual cues and insights. Share and navigate important information on five stages that need your due attention. This template can be used to pitch topics like Available To Accesses, Average Value Of Throughput, Recommended Solutions In addtion, this PPT design contains high resolution images, graphics, etc, that are easily editable and available for immediate download.

Creating Customer Personas For Customizing Customer Data Analysis On Individual Level Themes PDF
The following slide showcases quantitative analysis of customer data based on individual level. It showcases elements such as age group, gender, education, designation, income and country. From laying roadmaps to briefing everything in detail, our templates are perfect for you. You can set the stage with your presentation slides. All you have to do is download these easy-to-edit and customizable templates. Creating Customer Personas For Customizing Customer Data Analysis On Individual Level Themes PDF will help you deliver an outstanding performance that everyone would remember and praise you for. Do download this presentation today.
Idea Generation Digital Marketing Plan For Restaurant Business Slides PDF
The Idea Generation Digital Marketing Plan For Restaurant Business Slides PDF is a compilation of the most recent design trends as a series of slides. It is suitable for any subject or industry presentation, containing attractive visuals and photo spots for businesses to clearly express their messages. This template contains a variety of slides for the user to input data, such as structures to contrast two elements, bullet points, and slides for written information. Slidegeeks is prepared to create an impression.

5 Week Dissertation Roadmap To Create Project Report Pictures PDF
This slide shows 6 months roadmap for preparation of dissertation report. It includes various tasks such as prepare research plan, review available literature, create lesson plans, etc. Persuade your audience using this 5 Week Dissertation Roadmap To Create Project Report Pictures PDF. This PPT design covers six stages, thus making it a great tool to use. It also caters to a variety of topics including Implement Research Plan, Analyze Collected Data, Revise Plans. Download this PPT design now to present a convincing pitch that not only emphasizes the topic but also showcases your presentation skills.

Seven Types Of Digital Marketing Components Designs PDF
This slide illustrates seven digital pillars of marketing for product or business promotion. It includes digital objectives, audiences, devices, platforms, media, data and technology etc. Showcasing this set of slides titled Seven Types Of Digital Marketing Components Designs PDF. The topics addressed in these templates are Digital Audiences, Digital Devices, Digital Platforms. All the content presented in this PPT design is completely editable. Download it and make adjustments in color, background, font etc. as per your unique business setting.
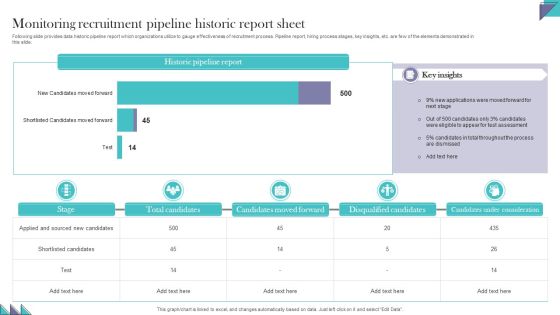
Monitoring Recruitment Pipeline Historic Report Sheet Pictures PDF
Following slide provides data historic pipeline report which organizations utilize to gauge effectiveness of recruitment process. Pipeline report, hiring process stages, key insights, etc. are few of the elements demonstrated in this slide. Pitch your topic with ease and precision using this Monitoring Recruitment Pipeline Historic Report Sheet Pictures PDF. This layout presents information on Candidates Moved Forward, Disqualified Candidates, Candidates Under Consideration. It is also available for immediate download and adjustment. So, changes can be made in the color, design, graphics or any other component to create a unique layout

Centralized Data Model With User Interface And Integration Services Template PDF
Showcasing this set of slides titled centralized data model with user interface and integration services template pdf. The topics addressed in these templates are data analysis, data repository, data governance tools, user interface, integration services. All the content presented in this PPT design is completely editable. Download it and make adjustments in color, background, font etc. as per your unique business setting.

Timeline For Data Product Quality Analysis Management Ppt Infographics Backgrounds PDF
The slide displays a timeline for managing data quality strategies to ensure effective management. Elements included in the timeline are abilities, field of study, data storage, organisation, training and development. Showcasing this set of slides titled Timeline For Data Product Quality Analysis Management Ppt Infographics Backgrounds PDF. The topics addressed in these templates are Consumer Personas, Product Description, Services Profile. All the content presented in this PPT design is completely editable. Download it and make adjustments in color, background, font etc. as per your unique business setting.
Transformation Toolkit Competitive Intelligence Information Analysis Data Change Management Plan With Value Icons PDF
This slide shows the value change management lifecycle. It includes the process of collecting and publicize the data and afterwards adopting change management approach for obtaining the data driven outcomes. If your project calls for a presentation, then Slidegeeks is your go to partner because we have professionally designed, easy to edit templates that are perfect for any presentation. After downloading, you can easily edit Transformation Toolkit Competitive Intelligence Information Analysis Data Change Management Plan With Value Icons PDF and make the changes accordingly. You can rearrange slides or fill them with different images. Check out all the handy templates.

Comparative Analysis Of Semi Structured And Unstructured Data Implementation Professional PDF
This slide provides a key comparison between big data types i.e. structured, semi-structured and unstructured guiding businesses to navigate the future of data in the cloud. It compares on the basis of properties like technology, transaction management, version management and flexibility. Showcasing this set of slides titled Comparative Analysis Of Semi Structured And Unstructured Data Implementation Professional PDF. The topics addressed in these templates are Technology, Transaction Management, Version Management, Flexibility. All the content presented in this PPT design is completely editable. Download it and make adjustments in color, background, font etc. as per your unique business setting.

Predictive Data Model Predictive Analytics To Understand Current Customers Needs Infographics PDF
This slide outlines how predictive analytics can help understand existing customers needs as many businesses depend on client retention and upsells. It also includes the factors impacting the marketing industry, including lead generation, new products or services, and improved referrals. Create an editable Predictive Data Model Predictive Analytics To Understand Current Customers Needs Infographics PDF that communicates your idea and engages your audience. Whether you are presenting a business or an educational presentation, pre-designed presentation templates help save time. Predictive Data Model Predictive Analytics To Understand Current Customers Needs Infographics PDF is highly customizable and very easy to edit, covering many different styles from creative to business presentations. Slidegeeks has creative team members who have crafted amazing templates. So, go and get them without any delay.

Business Diagram Five Staged Infographics With Stand Design PowerPoint Template
Five staged info graphics with stand has been used to craft this power point template. This PPT contains the concept of data flow. Use this PPT slide for your sales and business data related presentations.

How The Marketing Mix Evolves Over Time Ppt PowerPoint Presentation Infographics
This is a how the marketing mix evolves over time ppt powerpoint presentation infographics. This is a six stage process. The stages in this process are post war, uncertain, soaring, one to one, turbulent, financially driven.

Analyzing B2B And B2C Conversational Marketing Trends Clipart PDF
Presenting Analyzing B2B And B2C Conversational Marketing Trends Clipart PDF to provide visual cues and insights. Share and navigate important information on five stages that need your due attention. This template can be used to pitch topics like Customer Focused Data, Audio Driven Interface, Artificial Intelligence. In addtion, this PPT design contains high resolution images, graphics, etc, that are easily editable and available for immediate download.
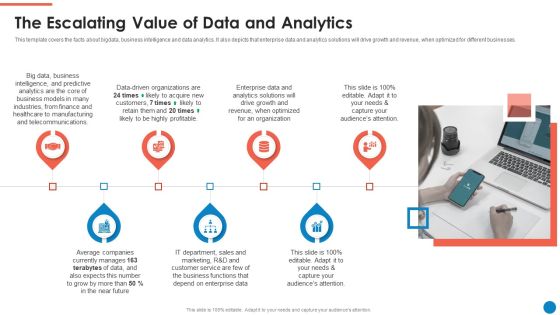
Data And Analytics Playbook The Escalating Value Of Data And Analytics Formats PDF
This template covers the facts about bigdata, business intelligence and data analytics. It also depicts that enterprise data and analytics solutions will drive growth and revenue, when optimized for different businesses. Presenting Data And Analytics Playbook The Escalating Value Of Data And Analytics Formats PDF to provide visual cues and insights. Share and navigate important information on seven stages that need your due attention. This template can be used to pitch topics like Big Data, Business Intelligence, Finance And Healthcare, Organization. In addtion, this PPT design contains high resolution images, graphics, etc, that are easily editable and available for immediate download.

Kubernetes Containers Architecture Overview Microservices Use Cases Ppt Gallery Graphics Template PDF
Presenting this set of slides with name kubernetes containers architecture overview microservices use cases ppt gallery graphics template pdf. This is a seven stage process. The stages in this process are ui microservice, most liked microservice, video uploading microservice, content microservice, recommendations microservice, most trending microservice, user info microservice. This is a completely editable PowerPoint presentation and is available for immediate download. Download now and impress your audience.

Bank And Finance Risk Management Tools And Methodologies Data Analysis On Bank Ideas PDF
This slide shows the data analysis of XYZ banks NPAs with other competitor banks and also the loans and advances for the same. Explore a selection of the finest Bank And Finance Risk Management Tools And Methodologies Data Analysis On Bank Ideas PDF here. With a plethora of professionally designed and pre-made slide templates, you can quickly and easily find the right one for your upcoming presentation. You can use our Bank And Finance Risk Management Tools And Methodologies Data Analysis On Bank Ideas PDF to effectively convey your message to a wider audience. Slidegeeks has done a lot of research before preparing these presentation templates. The content can be personalized and the slides are highly editable. Grab templates today from Slidegeeks.
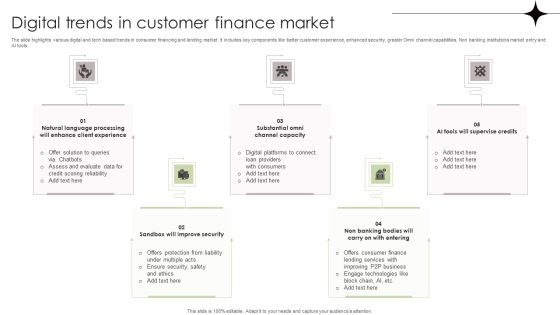
Digital Trends In Customer Finance Market Template PDF
The slide highlights various digital and tech based trends in consumer financing and lending market. It includes key components like better customer experience, enhanced security, greater Omni channel capabilities, Non banking institutions market entry and AI tools. Persuade your audience using this Digital Trends In Customer Finance Market Template PDF. This PPT design covers five stages, thus making it a great tool to use. It also caters to a variety of topics including Evaluate Data, Ensure Security, Lending Services. Download this PPT design now to present a convincing pitch that not only emphasizes the topic but also showcases your presentation skills.

Key Business Metrics To Track Ecommerce User On Boarding Success Pictures PDF
This slide signifies the key organisation metric to measure ecommerce onboading plan. It covers information about kpis, key description, projection, actual and variance. Pitch your topic with ease and precision using this Key Business Metrics To Track Ecommerce User On Boarding Success Pictures PDF. This layout presents information on Key Description, Projection, Variance. It is also available for immediate download and adjustment. So, changes can be made in the color, design, graphics or any other component to create a unique layout.

Battery Icons For Business Growth Levels Powerpoint Template
Levels of business growth can be displayed with this diagram. This PowerPoint template contains graphics of seven battery icons. You can use this design for data analysis in business presentations
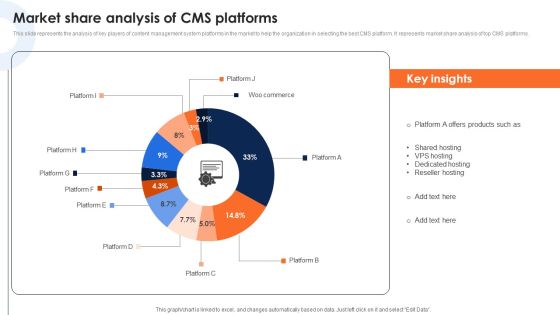
Market Share Analysis Of Cms Platforms Deploying Ecommerce Order Management Software Topics PDF
This slide represents the analysis of key players of content management system platforms in the market to help the organization in selecting the best CMS platform. It represents market share analysis of top CMS platforms.The Market Share Analysis Of Cms Platforms Deploying Ecommerce Order Management Software Topics PDF is a compilation of the most recent design trends as a series of slides. It is suitable for any subject or industry presentation, containing attractive visuals and photo spots for businesses to clearly express their messages. This template contains a variety of slides for the user to input data, such as structures to contrast two elements, bullet points, and slides for written information. Slidegeeks is prepared to create an impression.
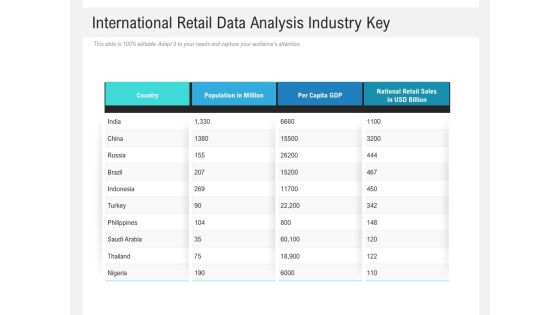
International Retail Data Analysis Industry Key Ppt Powerpoint Presentation Portfolio Infographics Pdf
Pitch your topic with ease and precision using this international retail data analysis industry key ppt powerpoint presentation portfolio infographics pdf. This layout presents information on national retail sales in usd billion, per capita gdp, population in million, country. It is also available for immediate download and adjustment. So, changes can be made in the color, design, graphics or any other component to create a unique layout.

 Home
Home