Dashboards Construction
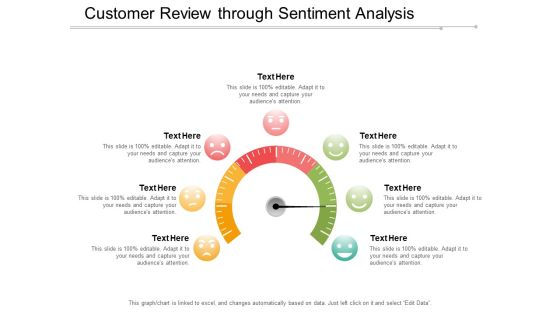
Customer Review Through Sentiment Analysis Ppt Powerpoint Presentation Show Design Templates
This is a customer review through sentiment analysis ppt powerpoint presentation show design templates. This is a six stage process. The stages in this process are feeling, emotion, sentiment.

Civil Engineering Project Management Tools Demonstration PDF
This slide exhibits construction project management tools that helps in project implementation with more efficiency and productivity. It contains four tools task lists, Gantt charts, dashboards and resource management with uses. Persuade your audience using this Civil Engineering Project Management Tools Demonstration PDF. This PPT design covers Four stages, thus making it a great tool to use. It also caters to a variety of topics including Task Lists, Gantt Charts, Dashboards, Resource Management. Download this PPT design now to present a convincing pitch that not only emphasizes the topic but also showcases your presentation skills.

Business Departments Performance Metrics Ppt Slides
This is a business departments performance metrics ppt slides. This is a seven stage process. The stages in this process are engineering, construction, maintenance, operations, safety, finance, environment.

Four Steps Circular Infographic Powerpoint Slides
This innovative, stunningly beautiful dashboard has been designed for data visualization. It contains circular infographic design. This PowerPoint template helps to display your information in a useful, simple and orderly way.
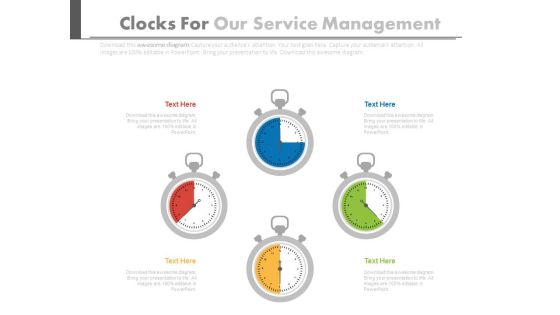
Four Stopwatches In Pie Chart Style Powerpoint Slides
This PPT slide has been designed with graphics of four stop watches in pie chart style. You may sue this PowerPoint template for time management. This dashboard slide may useful for multilevel status report creation and approval process.

Stopwatch For Speed Calculation Powerpoint Slides
This innovative, stunningly beautiful dashboard has been designed for speed calculation. It contains graphics of stopwatch. This PowerPoint template helps to display your information in a useful, simple and orderly way.

Architecture Plan Powerpoint Slide Backgrounds
This is a architecture plan powerpoint slide backgrounds. This is a two stage process. The stages in this process are architecture plan, platforms release.

Business Process Performance Indicators Ppt Slide Design
This is a business process performance indicators ppt slide design. This is a four stage process. The stages in this process are focus, objective, measures, targets, invites, vision and strategy, area of focus, metrics, targets, objectives.

Our Key Performance Indicators Powerpoint Slide Designs
This is a our key performance indicators powerpoint slide designs. This is a five stage process. The stages in this process are cash flow, turnover, productivity, customer satisfaction, net income.

Clock For Strategic Time Management And Business Vision Powerpoint Slides
Our above PPT slide contains flower clock design. This professional slide may be used to display strategic time management. Enlighten your audience with your breathtaking ideas.

Financial Growth Analysis Circular Chart Powerpoint Slides
Visually support your presentation with our above template containing graphics of circular chart. This diagram slide helps to display financial growth analysis. Etch your views in the brains of your audience with this diagram slide.

Pie Charts For Market Segmentation Powerpoint Slides
This PowerPoint contains graphics of pie charts. Download this diagram slide to display market segmentations. This template is editable, You can edit text, color, shade and style of this diagram as per you need.
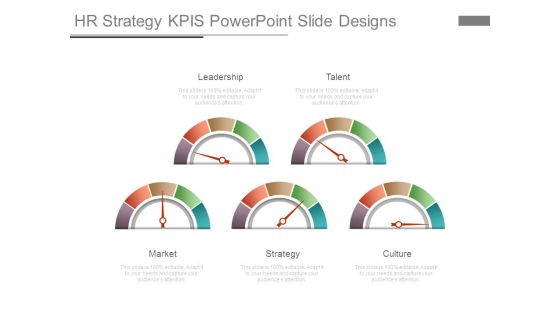
Hr Strategy Kpis Powerpoint Slide Designs
This is a hr strategy kpis powerpoint slide designs. This is a five stage process. The stages in this process are leadership, talent, market, strategy, culture.

Design Thinking Process Example Powerpoint Slides
This is a design thinking process example powerpoint slides. This is a five stage process. The stages in this process are empathize, frame, ideate, prototype, test.

Sales Opportunity Metrics Template Presentation Design
This is a sales opportunity metrics template presentation design. This is a three stage process. The stages in this process are sales status, sales opportunities, sales product performance.

Clock Timer Showing Agile Product Design Ppt PowerPoint Presentation File Slides PDF
Persuade your audience using this clock timer showing agile product design ppt powerpoint presentation file slides pdf. This PPT design covers two stages, thus making it a great tool to use. It also caters to a variety of topics including clock timer showing agile product design. Download this PPT design now to present a convincing pitch that not only emphasizes the topic but also showcases your presentation skills.

Compass With Directional Arrow Vector Icon Ppt PowerPoint Presentation File Background Designs PDF
Presenting this set of slides with name compass with directional arrow vector icon ppt powerpoint presentation file background designs pdf. This is a three stage process. The stages in this process are compass with directional arrow vector icon. This is a completely editable PowerPoint presentation and is available for immediate download. Download now and impress your audience.
Speedometer Compass Round Shape Vector Icon Ppt PowerPoint Presentation Gallery Design Inspiration PDF
Presenting this set of slides with name speedometer compass round shape vector icon ppt powerpoint presentation gallery design inspiration pdf. This is a three stage process. The stages in this process are speedometer compass round shape vector icon. This is a completely editable PowerPoint presentation and is available for immediate download. Download now and impress your audience.

Break Time Vector Icon With Curved Arrow And Clock Ppt PowerPoint Presentation File Design Templates PDF
Presenting break time vector icon with curved arrow and clock ppt powerpoint presentation file design templates pdf to dispense important information. This template comprises two stages. It also presents valuable insights into the topics including break time vector icon with curved arrow and clock. This is a completely customizable PowerPoint theme that can be put to use immediately. So, download it and address the topic impactfully.
Market Trends Chart With Icons Powerpoint Slides
This PowerPoint template has been designed with business info graphic chart. You may use this business slide design to display market trends. This PPT slide is powerful tool to describe your ideas.

Three Stopwatches To Display Profit Trends Powerpoint Slides
This PowerPoint template has been designed with graphics of three stopwatches. Use this PPT slide to depict profit trends. Download this template to make impressive presentations.

Column Chart For Financial Analysis Powerpoint Slides
This PowerPoint template has been designed with graphics of column chart with percentage values. You may use this business slide design for topics like financial analysis and planning. This PPT slide is powerful tool to describe your ideas.
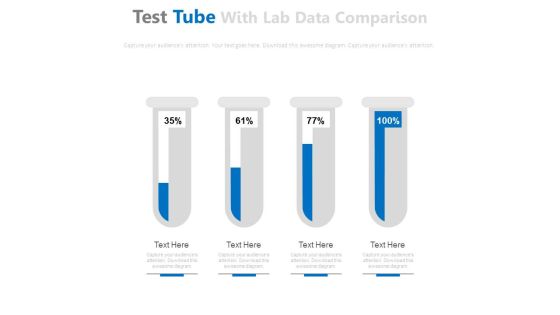
Test Tubes For Financial Ratio Analysis Powerpoint Slides
This PowerPoint template has been designed with graphics of test tubes. Use this PPT slide to depict financial ratio analysis. Download this PPT template to make impressive presentations.
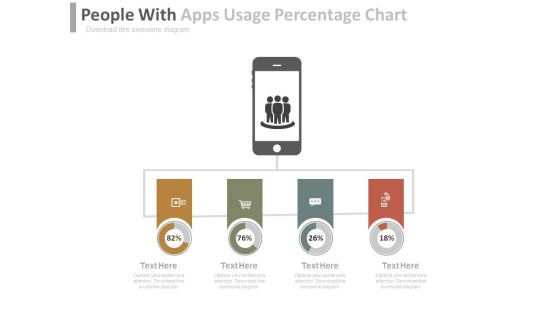
Team Efforts For Company Growth Powerpoint Slides
This PowerPoint template has been designed with mobile and four tags. Use this PPT slide to depict team efforts for companys growth. Download this template to make impressive presentations.
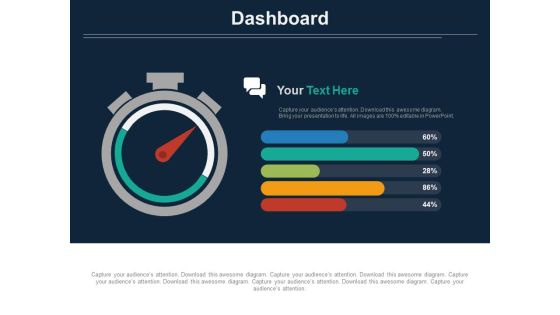
Stopwatch With Percentage Value Analysis Powerpoint Slides
The above template displays a diagram of stopwatch with percentage value. This diagram has been professionally designed to emphasize on time management. Grab center stage with this slide and capture the attention of your audience.

Circle Diagram With Team Icon Powerpoint Slides
This PowerPoint template has been designed with circle diagram and team icons. You may download this PPT slide to display team planning and strategy. This PowerPoint template helps to display your information in a useful, simple and orderly way.
Vector Illustration Of Alarm Clock Icon Ppt PowerPoint Presentation Gallery Templates PDF
Persuade your audience using this vector illustration of alarm clock icon ppt powerpoint presentation gallery templates pdf. This PPT design covers one stages, thus making it a great tool to use. It also caters to a variety of topics including vector illustration of alarm clock icon. Download this PPT design now to present a convincing pitch that not only emphasizes the topic but also showcases your presentation skills.
Set Timeframe Application Settings Vector Icon Ppt PowerPoint Presentation File Summary PDF
Persuade your audience using this set timeframe application settings vector icon ppt powerpoint presentation file summary pdf. This PPT design covers three stages, thus making it a great tool to use. It also caters to a variety of topics including set timeframe application settings vector icon. Download this PPT design now to present a convincing pitch that not only emphasizes the topic but also showcases your presentation skills.

Picture Of Pocket Watch Dial Ppt PowerPoint Presentation Gallery Demonstration PDF
Persuade your audience using this picture of pocket watch dial ppt powerpoint presentation gallery demonstration pdf. This PPT design covers four stages, thus making it a great tool to use. It also caters to a variety of topics including picture of pocket watch dial. Download this PPT design now to present a convincing pitch that not only emphasizes the topic but also showcases your presentation skills.

Picture Showing Three Alarm Clocks Ppt PowerPoint Presentation File Display PDF
Persuade your audience using this picture showing three alarm clocks ppt powerpoint presentation file display pdf. This PPT design covers two stages, thus making it a great tool to use. It also caters to a variety of topics including picture showing three alarm clocks. Download this PPT design now to present a convincing pitch that not only emphasizes the topic but also showcases your presentation skills.
Vector Illustration Of Speedometer Gauge Icon Ppt PowerPoint Presentation File Outline PDF
Persuade your audience using this vector illustration of speedometer gauge icon ppt powerpoint presentation file outline pdf. This PPT design covers three stages, thus making it a great tool to use. It also caters to a variety of topics including vector illustration of speedometer gauge icon. Download this PPT design now to present a convincing pitch that not only emphasizes the topic but also showcases your presentation skills.
Task Planning For Effective Project Management Ppt PowerPoint Presentation File Clipart PDF
Persuade your audience using this task planning for effective project management ppt powerpoint presentation file clipart pdf. This PPT design covers two stages, thus making it a great tool to use. It also caters to a variety of topics including task planning for effective project management. Download this PPT design now to present a convincing pitch that not only emphasizes the topic but also showcases your presentation skills.

Extreme Programming Methodology Ten Minute Build Practice In XP Themes PDF
This slide explains what is ten minute build practice in XP which means taking 10 minutes to build a system, run tests and run code linters. Explore a selection of the finest Extreme Programming Methodology Ten Minute Build Practice In XP Themes PDF here. With a plethora of professionally designed and pre made slide templates, you can quickly and easily find the right one for your upcoming presentation. You can use our Extreme Programming Methodology Ten Minute Build Practice In XP Themes PDF to effectively convey your message to a wider audience. Slidegeeks has done a lot of research before preparing these presentation templates. The content can be personalized and the slides are highly editable. Grab templates today from Slidegeeks.

Applied Enterprise Architecture Sample Diagram Ppt
This is a applied enterprise architecture sample diagram ppt. This is a eight stage process. The stages in this process are optimization, predictive modeling, forecasting and extrapolation, statistical analysis, alerts, dashboards query/drill down, ad-hoc reporting, standard reports.
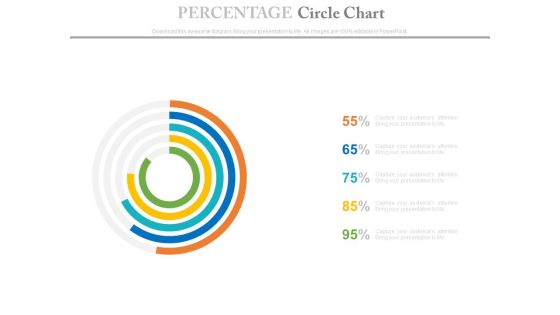
Percentage Data Circle Chart Powerpoint Slides
This PowerPoint template has been designed with circle chart. Download this PPT chart to depict financial ratio analysis. This PowerPoint slide is of great help in the business sector to make realistic presentations and provides effective way of presenting your newer thoughts.

Merchant Performance Strategic Management System Inspiration PDF
The given slide depicts a vendor or supplier performance evaluation system in order to cultivate a long-term relationship with the vendor. The key components include vendor KPIs, rating methods, scorecard, performance dashboards etc. Persuade your audience using this Merchant Performance Strategic Management System Inspiration PDF. This PPT design covers six stages, thus making it a great tool to use. It also caters to a variety of topics including Vendor Scorecard, Performance Dashboards, Analyze Vendor Performance. Download this PPT design now to present a convincing pitch that not only emphasizes the topic but also showcases your presentation skills.

Table Of Contents For Real Estate Marketing Strategy For Vendors Designs PDF
Deliver an awe inspiring pitch with this creative table of contents for real estate marketing strategy for vendors designs pdf bundle. Topics like marketing goals, evaluating competitors, marketing planning, customer service, dashboards can be discussed with this completely editable template. It is available for immediate download depending on the needs and requirements of the user.

Business Analysis Vs Business Analytics Diagram Ppt Slides
This is a business analysis vs business analytics diagram ppt slides. This is a one stage process. The stages in this process are area, main focus, architectural domains, requirements, project management, business analysis, functions and process, enterprise? process technology organisation, functionality software configuration and development, sdlc, business analytics, data and reporting, data information technology, reports, dashboards and kpis data consolidation and presention, sdlc agile.

Marketing Ppt Template Arrow Process 5 Stages Business Strategy PowerPoint 3 Design
marketing PPT template arrow Process 5 stages business strategy powerpoint 3 design-This arrow process diagram allows managers to configure critical deviation alerts for any metric and provides real-time dashboards for a quick overview of the current situation. Organize your thoughts and

Table Of Content Enhancing Hospital Software System Metrics Pictures PDF
Deliver an awe inspiring pitch with this creative table of content enhancing hospital software system metrics pictures pdf bundle. Topics like risk management framework, management system, dashboards and metrics can be discussed with this completely editable template. It is available for immediate download depending on the needs and requirements of the user.

CRM For Realty Properties Role Of CRM In Real Estate Business Ppt Infographics Background Image PDF
Presenting this set of slides with name crm for realty properties role of crm in real estate business ppt infographics background image pdf. This is a five stage process. The stages in this process are plan effective publicity campaigns, analyze sales efforts, management reporting and dashboards made easy, better customer servicing, cross sell and up sell more effectively. This is a completely editable PowerPoint presentation and is available for immediate download. Download now and impress your audience.

Online Promotion Playbook Google Data Studio Reports Designs PDF
This template covers tools to measure marketing analytics such as google analytics for all web tracking, google data studio to build real-time reporting dashboards and google data studio reports. Deliver an awe inspiring pitch with this creative online promotion playbook google data studio reports designs pdf bundle. Topics like google data studio reports can be discussed with this completely editable template. It is available for immediate download depending on the needs and requirements of the user.

Data And Analytics Playbook Purpose Of This Playbook Background PDF
Presenting Data And Analytics Playbook Purpose Of This Playbook Background PDF to provide visual cues and insights. Share and navigate important information on three stages that need your due attention. This template can be used to pitch topics like Upgrade Analytics, Business Intelligence Programs, Next Generation Search, Dashboards And Report. In addtion, this PPT design contains high resolution images, graphics, etc, that are easily editable and available for immediate download.
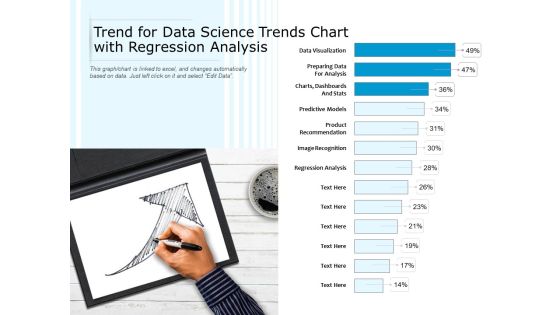
Trend For Data Science Trends Chart With Regression Analysis Ppt PowerPoint Presentation Visual Aids Layouts PDF
Showcasing this set of slides titled trend for data science trends chart with regression analysis ppt powerpoint presentation visual aids layouts pdf. The topics addressed in these templates are data visualization, preparing data for analysis, dashboards and stats, predictive models. All the content presented in this PPT design is completely editable. Download it and make adjustments in color, background, font etc. as per your unique business setting.

Agile Project Team Delegation IT Agile Software Development Project Team Planning Ideas PDF
This template covers agile software development team resource planning and work scheduling sheet. Deliver and pitch your topic in the best possible manner with this agile project team delegation it agile software development project team planning ideas pdf. Use them to share invaluable insights on requirement mapping, design, dashboards and impress your audience. This template can be altered and modified as per your expectations. So, grab it now.

Different CRM Software Comparison For Customer Satisfaction Brochure PDF
This slide displays CRM comparison chart based on its features. It includes features like contact management, lead management, opportunities management, dashboards and reports, etc. Pitch your topic with ease and precision using this Different CRM Software Comparison For Customer Satisfaction Brochure PDF. This layout presents information on Opportunities Management, Lead Management, Customer Communication Management. It is also available for immediate download and adjustment. So, changes can be made in the color, design, graphics or any other component to create a unique layout.
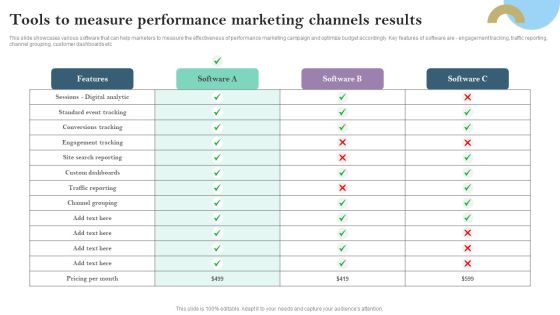
Tools To Measure Performance Marketing Channels Results Ppt PowerPoint Presentation File Diagrams PDF
This slide showcases various software that can help marketers to measure the effectiveness of performance marketing campaign and optimize budget accordingly. Key features of software are - engagement tracking, traffic reporting, channel grouping, customer dashboards etc Crafting an eye catching presentation has never been more straightforward. Let your presentation shine with this tasteful yet straightforward Tools To Measure Performance Marketing Channels Results Ppt PowerPoint Presentation File Diagrams PDF template. It offers a minimalistic and classy look that is great for making a statement. The colors have been employed intelligently to add a bit of playfulness while still remaining professional. Construct the ideal Tools To Measure Performance Marketing Channels Results Ppt PowerPoint Presentation File Diagrams PDF that effortlessly grabs the attention of your audience. Begin now and be certain to wow your customers.
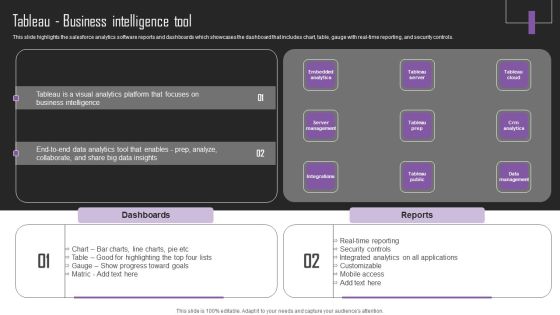
Web Hosting Software Company Outline Tableau Business Intelligence Tool Sample PDF
This slide highlights the salesforce analytics software reports and dashboards which showcases the dashboard that includes chart, table, gauge with real-time reporting, and security controls. This Web Hosting Software Company Outline Tableau Business Intelligence Tool Sample PDF from Slidegeeks makes it easy to present information on your topic with precision. It provides customization options, so you can make changes to the colors, design, graphics, or any other component to create a unique layout. It is also available for immediate download, so you can begin using it right away. Slidegeeks has done good research to ensure that you have everything you need to make your presentation stand out. Make a name out there for a brilliant performance.

ETL Repository Big Data Integration Ppt PowerPoint Presentation Ideas Outline PDF
This architecture states that data will be extracted from several source systems and then the data will be transformed and loaded into hadoop data warehouse. End-user visualizations, reports and queries are run on top of this data warehouse.Deliver and pitch your topic in the best possible manner with this ETL Repository Big Data Integration Ppt PowerPoint Presentation Ideas Outline PDF. Use them to share invaluable insights on Server Farm, Staging Area, Dashboards and impress your audience. This template can be altered and modified as per your expectations. So, grab it now.

Innovative Technologies For Improving Economic Functions Ppt PowerPoint Presentation File Graphics Example PDF
This slide showcase key digital technologies for improving financials functions. It includes major steps such as-Make user friendly dashboards for internal customer demands, Develop predictive models for every warning etc. Persuade your audience using this innovative technologies for improving economic functions ppt powerpoint presentation file graphics example pdf. This PPT design covers four stages, thus making it a great tool to use. It also caters to a variety of topics including automation and robotics, data visualization, advanced analytics for finance. Download this PPT design now to present a convincing pitch that not only emphasizes the topic but also showcases your presentation skills.

Salesforce Platform Facts AND Figures Salesforce Business Profile Graphics PDF
This slide highlights the salesforce platform statistics of one day which includes the data of tableau public views, commerce orders, service and case interactions, reports and dashboards and sales opportunities created. Presenting Salesforce Platform Facts AND Figures Salesforce Business Profile Graphics PDF to provide visual cues and insights. Share and navigate important information on three stages that need your due attention. This template can be used to pitch topics like Platform Scale, Consumer Scale, Employee Scale. In addtion, this PPT design contains high resolution images, graphics, etc, that are easily editable and available for immediate download.
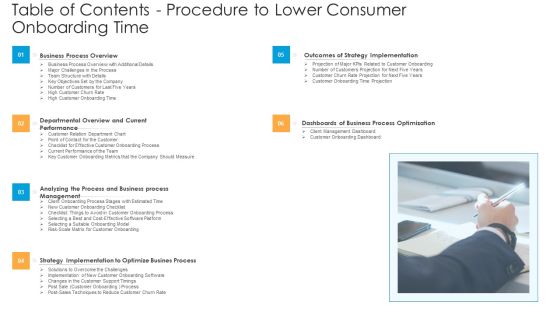
Table Of Contents Procedure To Lower Consumer Onboarding Time Ppt Infographics Example Topics PDF
Presenting table of contents procedure to lower consumer onboarding time ppt infographics example topics pdf. to provide visual cues and insights. Share and navigate important information on six stages that need your due attention. This template can be used to pitch topics like outcomes of strategy implementation, business process overview, departmental overview and current performance, analyzing the process and business process management, dashboards of business process optimization. In addtion, this PPT design contains high resolution images, graphics, etc, that are easily editable and available for immediate download.

Agile Project Development Delivery Strategy With Project Status Slides PDF
This slide contains the information related to the sprints that are made for the agile software delivery plan . It also includes the work status of every sprint with due date, owner and the tasks. Pitch your topic with ease and precision using this Agile Project Development Delivery Strategy With Project Status Slides PDF. This layout presents information on Mapping Requirements, Designing Features, Dashboards Charts. It is also available for immediate download and adjustment. So, changes can be made in the color, design, graphics or any other component to create a unique layout.

Tools For Prioritization Table Of Contents Ppt PowerPoint Presentation Inspiration Example PDF
Presenting tools for prioritization table of contents ppt powerpoint presentation inspiration example pdf to provide visual cues and insights. Share and navigate important information on one stages that need your due attention. This template can be used to pitch topics like business performance overview, major challenges faced firm, prioritization tools, project management, deal management tools, workflow management tools, time management tools, training and budget, dashboards to measure impact. In addition, this PPT design contains high-resolution images, graphics, etc, that are easily editable and available for immediate download.

BPM System Methodology Three Levels Of Business Processes In Organization Diagrams PDF
This slide covers different levels in an organization that involves multiple business operations. It includes levels in business processes such as aiming, directing, organizing, tracking process performance, developing dashboards and identifying improvement opportunities. If your project calls for a presentation, then Slidegeeks is your go-to partner because we have professionally designed, easy-to-edit templates that are perfect for any presentation. After downloading, you can easily edit BPM System Methodology Three Levels Of Business Processes In Organization Diagrams PDF and make the changes accordingly. You can rearrange slides or fill them with different images. Check out all the handy templates
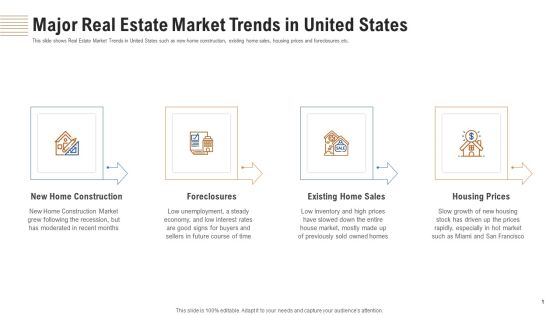
Major Real Estate Market Trends In United States Ppt Slide PDF
This slide shows Real Estate Market Trends in United States such as new home construction, existing home sales, housing prices and foreclosures etc. Presenting major real estate market trends in united states ppt slide pdf to provide visual cues and insights. Share and navigate important information on four stages that need your due attention. This template can be used to pitch topics like construction market, existing home sales, housing prices. In addtion, this PPT design contains high resolution images, graphics, etc, that are easily editable and available for immediate download.

Cost Estimate For Execution Of The Strategies Portrait PDF
The slide shows the key Performance Indicator KPI s which will help the company to track the success rate of implemented strategies. Major KPIs include Number of construction projects, Number of construction defect, Total project cost, customer satisfaction level etc.Deliver and pitch your topic in the best possible manner with this cost estimate for execution of the strategies portrait pdf. Use them to share invaluable insights on quality assurance strategy, evaluations of the site strategy, establish quality and impress your audience. This template can be altered and modified as per your expectations. So, grab it now.
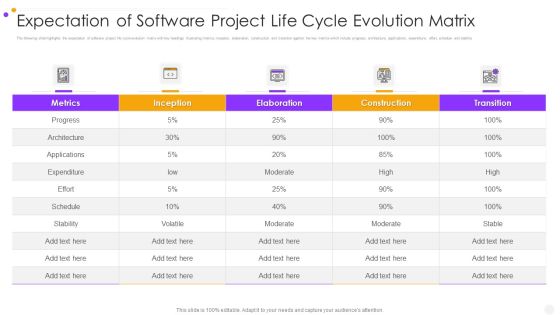
Expectation Of Software Project Life Cycle Evolution Matrix Professional PDF
The following slide highlights the expectation of software project life cycle evolution matrix with key headings illustrating metrics, inception, elaboration, construction and transition against the key metrics which include progress, architecture, applications, expenditure, effort, schedule and stability. Showcasing this set of slides titled expectation of software project life cycle evolution matrix professional pdf. The topics addressed in these templates are construction, transition, metrics. All the content presented in this PPT design is completely editable. Download it and make adjustments in color, background, font etc. as per your unique business setting.
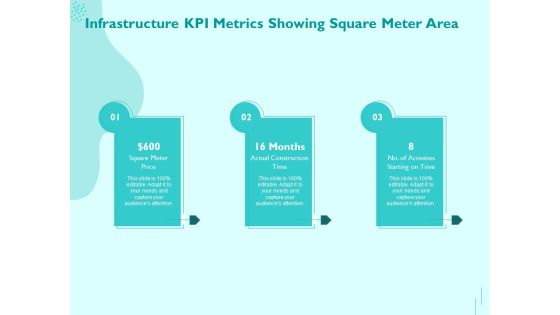
Managing IT Operating System Infrastructure KPI Metrics Showing Square Meter Area Infographics PDF
Presenting this set of slides with name managing it operating system infrastructure kpi metrics showing square meter area infographics pdf. This is a three stage process. The stages in this process are square meter price, actual construction time, no. of activities starting on time. This is a completely editable PowerPoint presentation and is available for immediate download. Download now and impress your audience.
Five Projects Performance Comparison Report Ppt Infographic Template Icons PDF
Pitch your topic with ease and precision using this five projects performance comparison report ppt infographic template icons pdf. This layout presents information on construction project, business project, event project. It is also available for immediate download and adjustment. So, changes can be made in the color, design, graphics or any other component to create a unique layout.
 Home
Home