Dashboards Construction
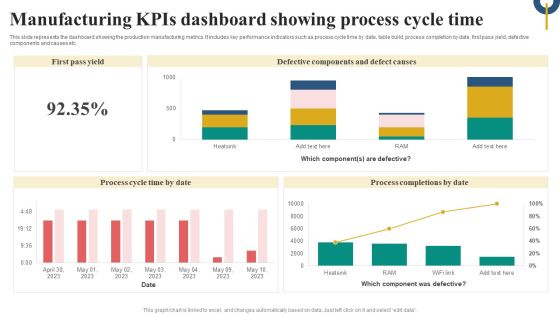
Manufacturing Kpis Dashboard Showing Process Cycle Time Microsoft PDF
This slide represents the dashboard showing the production manufacturing metrics. It includes key performance indicators such as process cycle time by date, table build, process completion by date, first pass yield, defective components and causes etc. Pitch your topic with ease and precision using this Manufacturing Kpis Dashboard Showing Process Cycle Time Microsoft PDF. This layout presents information on Defective Components Defect Causes, Process Cycle, Time By Date, Process Completions By Date. It is also available for immediate download and adjustment. So, changes can be made in the color, design, graphics or any other component to create a unique layout.

Metrics Dashboard Depicting Call Center Performance Pictures PDF
Mentioned slide outlines key performance indicator KPI dashboard which can be used by call center to optimize the agents performance. The major metrics covered in the template are total calls, average speed of answer, abandon rate, service level agreement SLA limit etc. Pitch your topic with ease and precision using this Metrics Dashboard Depicting Call Center Performance Pictures PDF. This layout presents information on Overall Satisfaction Score, Satisfaction Score, Performance. It is also available for immediate download and adjustment. So, changes can be made in the color, design, graphics or any other component to create a unique layout.
Integrated Digital Marketing Strategy Dashboard For Lead Conversion Icons PDF
Following slide illustrates integrated marketing campaign dashboard utilized by organizations to improve business agility and increase operational efficiency. This slide provides data regarding lead conversion by campaign and channel, amount spent per campaign, monthly lead generations, etc. Showcasing this set of slides titled Integrated Digital Marketing Strategy Dashboard For Lead Conversion Icons PDF. The topics addressed in these templates are Total Page Views, Average Session Duration, Conversion. All the content presented in this PPT design is completely editable. Download it and make adjustments in color, background, font etc. as per your unique business setting.
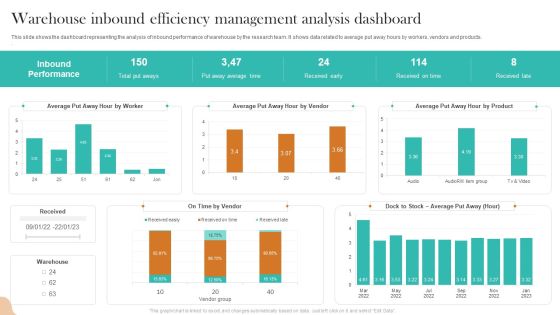
Warehouse Inbound Efficiency Management Analysis Dashboard Topics PDF
This slide shows the dashboard representing the analysis of inbound performance of warehouse by the research team. It shows data related to average put away hours by workers, vendors and products. Showcasing this set of slides titled Warehouse Inbound Efficiency Management Analysis Dashboard Topics PDF. The topics addressed in these templates are Inbound Performance, Total Put Aways, Received Early. All the content presented in this PPT design is completely editable. Download it and make adjustments in color, background, font etc. as per your unique business setting.

Dashboard To Analyse Effectiveness Of Promotions Execution Plan Diagrams PDF
This slide depicts analysis dashboard for tracking marketing activities with implementations and continuously updates data so businesses can track the marketing effectiveness. The various key performing indicators are cost, conversions and channel performance. Showcasing this set of slides titled Dashboard To Analyse Effectiveness Of Promotions Execution Plan Diagrams PDF. The topics addressed in these templates are Channel Performance, Cost, Conversions. All the content presented in this PPT design is completely editable. Download it and make adjustments in color, background, font etc. as per your unique business setting.
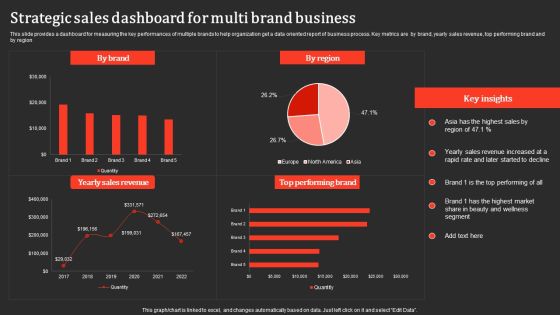
Strategic Sales Dashboard For Multi Brand Business Professional PDF
This slide provides a dashboard for measuring the key performances of multiple brands to help organization get a data oriented report of business process. Key metrics are by brand, yearly sales revenue, top performing brand and by region. Pitch your topic with ease and precision using this Strategic Sales Dashboard For Multi Brand Business Professional PDF. This layout presents information on Yearly Sales Revenue, Performing Brand. It is also available for immediate download and adjustment. So, changes can be made in the color, design, graphics or any other component to create a unique layout.
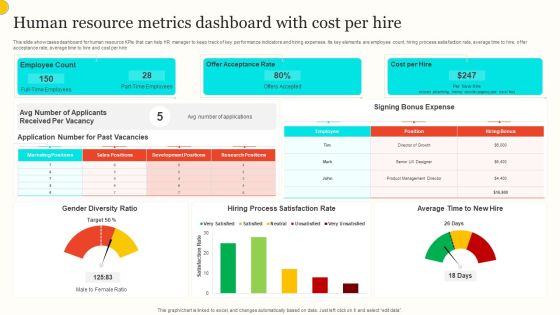
Human Resource Metrics Dashboard With Cost Per Hire Portrait PDF
This slide showcases dashboard for human resource KPIs that can help HR manager to keep track of key performance indicators and hiring expenses. Its key elements are employee count, hiring process satisfaction rate, average time to hire, offer acceptance rate, average time to hire and cost per hire. Showcasing this set of slides titled Human Resource Metrics Dashboard With Cost Per Hire Portrait PDF. The topics addressed in these templates are Employee Count, Offer Acceptance Rate, Cost Per Hire. All the content presented in this PPT design is completely editable. Download it and make adjustments in color, background, font etc. as per your unique business setting.

Dashboard To Track Performance Of Buyer Marketing Campaign Infographics PDF
This slide depicts a Dashboard which can be used to track performance of shopper marketing campaign on digital platforms. The key performance indicators include Website leads, Current service users, Lead conversion rate, Lead satisfaction rate etc. Pitch your topic with ease and precision using this Dashboard To Track Performance Of Buyer Marketing Campaign Infographics PDF. This layout presents information on Social Media Campaign, Social Media Engagement, Current Service Users. It is also available for immediate download and adjustment. So, changes can be made in the color, design, graphics or any other component to create a unique layout.
Year End HR Attrition Dashboard With Major Kpis Demonstration PDF
Following dashboard presents the current status of employee turnover which can be used by managers to plan for new recruitments beforehand. The key performance indicators are current employees, newly hired, transfers, offboarding, turnover rate, retention rate etc. Persuade your audience using this Year End HR Attrition Dashboard With Major Kpis Demonstration PDF. This PPT design covers one stages, thus making it a great tool to use. It also caters to a variety of topics including Retention Rate, Turnover Rate, Offboarding. Download this PPT design now to present a convincing pitch that not only emphasizes the topic but also showcases your presentation skills.

KPI Metrics Dashboard To Analyze Business Project Investment Graphics PDF
This slide signifies the key performance indicator dashboard to evaluate project investment project. It covers information about portfolio activity summary, allocation and dividends vs unrealized gains. Showcasing this set of slides titled KPI Metrics Dashboard To Analyze Business Project Investment Graphics PDF. The topics addressed in these templates are Allocation Sector Sheets, Sector Summary, Investment Styles Shares. All the content presented in this PPT design is completely editable. Download it and make adjustments in color, background, font etc. as per your unique business setting.

Advertising And Marketing Campaign Strategy Success Communication Dashboard Inspiration PDF
This slide depicts a multi channel dashboard for tracking advertising and marketing campaign plan success which provides real time data to track the performance of marketing efforts. The various key performing indicators are cost, conversions and channel performance Showcasing this set of slides titled Advertising And Marketing Campaign Strategy Success Communication Dashboard Inspiration PDF. The topics addressed in these templates are Conversions, Spend, Channel. All the content presented in this PPT design is completely editable. Download it and make adjustments in color, background, font etc. as per your unique business setting.

Internal Organizational Communication Kpis And Dashboard With Channels Infographics PDF
This slide showcases dashboard that can help organization to assess the performance of internal communication and analyzing the user participation. Its key components are message success, channels and user engagement. Pitch your topic with ease and precision using this Internal Organizational Communication Kpis And Dashboard With Channels Infographics PDF. This layout presents information on User Participation, User Engagement, Message Success. It is also available for immediate download and adjustment. So, changes can be made in the color, design, graphics or any other component to create a unique layout.

Business Key Performance Metrics Review Dashboard Portrait PDF
The following slide shows a dashboard of sales strategy review of firm that can be used by marketing, product, finance managers for reviewing the business. It further includes KPI that are revenue, new customer, gross profit purchaser satisfaction, income comparison, sales categories and profitability. Showcasing this set of slides titled Business Key Performance Metrics Review Dashboard Portrait PDF. The topics addressed in these templates are Sales, Revenue Comparison, Profitability. All the content presented in this PPT design is completely editable. Download it and make adjustments in color, background, font etc. as per your unique business setting.
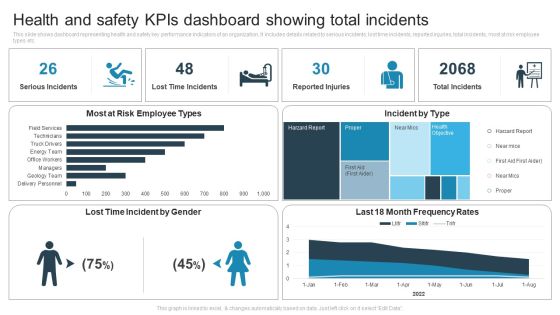
Health And Safety Kpis Dashboard Showing Total Incidents Pictures PDF
This slide shows dashboard representing health and safety key performance indicators of an organization. It includes details related to serious incidents, lost time incidents, reported injuries, total incidents, most at risk employee types etc. Showcasing this set of slides titled Health And Safety Kpis Dashboard Showing Total Incidents Pictures PDF. The topics addressed in these templates are Lost Time Incident, Most At Risk Employee, Incident By Type. All the content presented in this PPT design is completely editable. Download it and make adjustments in color, background, font etc. as per your unique business setting.

Kpi Dashboard To Track Owned Media Metrics Rules PDF
This slide brings forth a dashboard to track the performance of earned media channels which can be used by brand managers to get a brief idea about the effectiveness of the marketing strategy. Key performing indicators include number of conversions, conversion rate, backlinks published etc. Pitch your topic with ease and precision using this Kpi Dashboard To Track Owned Media Metrics Rules PDF. This layout presents information on Conversions, Backlinks Published, Metrics. It is also available for immediate download and adjustment. So, changes can be made in the color, design, graphics or any other component to create a unique layout.

Education Dashboard With Fees Collection And Expense Metrics Demonstration PDF
This slide covers education key performance indicators tracking dashboard. It also include metrics such as total students, teachers, parents, total earrings, social media followers, event calendar, fees collection, and expenses. Showcasing this set of slides titled Education Dashboard With Fees Collection And Expense Metrics Demonstration PDF. The topics addressed in these templates are Event Calender, Annual Holidays, Fees Collection, Expenses. All the content presented in this PPT design is completely editable. Download it and make adjustments in color, background, font etc. as per your unique business setting.
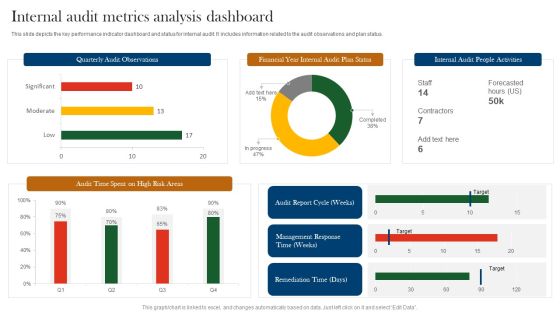
Internal Audit Metrics Analysis Dashboard Ppt Ideas Clipart Images PDF
This slide depicts the key performance indicator dashboard and status for internal audit. It includes information related to the audit observations and plan status. Pitch your topic with ease and precision using this Internal Audit Metrics Analysis Dashboard Ppt Ideas Clipart Images PDF. This layout presents information on Quarterly Audit Observations, Financial Year Internal, Audit Plan Status. It is also available for immediate download and adjustment. So, changes can be made in the color, design, graphics or any other component to create a unique layout.

Supply Chain Strategic Planning Dashboard Showing Shipping Status Structure PDF
This slide showcase supply chain planning dashboard showing shipping status which includes orders, present data, worldwide financial levels, monthly key performance indicators KPIs, etc. This can be beneficial for order management department for efficient delivery of products. Showcasing this set of slides titled Supply Chain Strategic Planning Dashboard Showing Shipping Status Structure PDF. The topics addressed in these templates are Worldwide Financial Levels, Present Data, Customer. All the content presented in this PPT design is completely editable. Download it and make adjustments in color, background, font etc. as per your unique business setting.
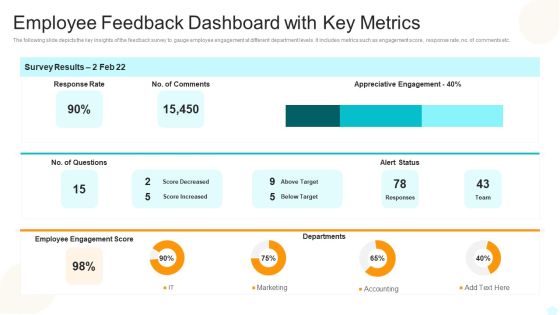
Employee Feedback Dashboard With Key Metrics Elements PDF
The following slide depicts the key insights of the feedback survey to gauge employee engagement at different department levels. It includes metrics such as engagement score, response rate, no. of comments etc.Showcasing this set of slides titled Employee Feedback Dashboard With Key Metrics Elements PDF The topics addressed in these templates are Employee Feedback Dashboard With Key Metrics All the content presented in this PPT design is completely editable. Download it and make adjustments in color, background, font etc. as per your unique business setting.

Automated Internet Marketing Dashboard With Key Metrics Information PDF
The following slide highlights dashboard for digital advertising for graphical representation of marketing performance. It includes components such as cost of advertisements, cost per click, advertisements, no. of page views etc. Showcasing this set of slides titled Automated Internet Marketing Dashboard With Key Metrics Information PDF. The topics addressed in these templates are Cost Advertisements, Clicks Advertisement, Cost Per Click. All the content presented in this PPT design is completely editable. Download it and make adjustments in color, background, font etc. as per your unique business setting.

Data Augmentation Dashboard For Lead Generation Ppt Pictures Deck PDF
This slide illustrates a data enrichment dashboard that helps shorten the customer journey for lead generation. It also includes KPIs such as leads enriched against target, lead stage, user, and lead created by user. Showcasing this set of slides titled Data Augmentation Dashboard For Lead Generation Ppt Pictures Deck PDF. The topics addressed in these templates are Leads Enriched against, Target, Leads Enriched, Lead Stage, Leads Created User, Leads Enriched User. All the content presented in this PPT design is completely editable. Download it and make adjustments in color, background, font etc. as per your unique business setting.

Customer Service Measurement KPI Dashboard Ppt Infographics Themes PDF
Mentioned slide portrays customer service measurement KPI dashboard that includes metrics namely request volume vs. service level, customer satisfaction, customer retention, costs per support and average time to solve issue. If your project calls for a presentation, then Slidegeeks is your go-to partner because we have professionally designed, easy-to-edit templates that are perfect for any presentation. After downloading, you can easily edit Customer Service Measurement KPI Dashboard Ppt Infographics Themes PDF and make the changes accordingly. You can rearrange slides or fill them with different images. Check out all the handy templates

Customer Service Metrics Dashboard With Customer Retention Rate Icons PDF
This slide showcases KPIs dashboard for customer service that can help organization to track the consumer satisfaction score and improve product or service by improving customer loyalty. Its key components are net promoter score, customer retention and support costs. Showcasing this set of slides titled Customer Service Metrics Dashboard With Customer Retention Rate Icons PDF. The topics addressed in these templates are Customer Retention, Net Promoter Score, Service Level. All the content presented in this PPT design is completely editable. Download it and make adjustments in color, background, font etc. as per your unique business setting.

Human Resource Recruitment Funnel Dashboard With Metrics Summary PDF
This slide showcases KPIs dashboard of human resource recruitment that can help to track the employee hiring process using funnel. Its key components are time to hire, time to fill days and recruitment cost. Showcasing this set of slides titled Human Resource Recruitment Funnel Dashboard With Metrics Summary PDF. The topics addressed in these templates are Recruitment Funnel, Male Female Ratio, Age Applicants. All the content presented in this PPT design is completely editable. Download it and make adjustments in color, background, font etc. as per your unique business setting.
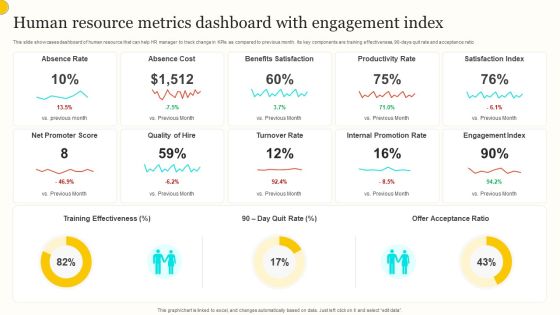
Human Resource Metrics Dashboard With Engagement Index Guidelines PDF
This slide showcases dashboard of human resource that can help HR manager to track change in KPIs as compared to previous month. Its key components are training effectiveness, 90 days quit rate and acceptance ratio. Pitch your topic with ease and precision using this Human Resource Metrics Dashboard With Engagement Index Guidelines PDF. This layout presents information on Absence Rate, Absence Cost, Benefits Satisfaction. It is also available for immediate download and adjustment. So, changes can be made in the color, design, graphics or any other component to create a unique layout.

Share Market Dashboard Highlighting Price Moving Average Trend Themes PDF
Following slide outlines stock market dashboard of an industry. The various metrics highlighted in the slide are stock codes, previous day price of stock, percent of price change, maximum and lowest price of stock, moving average trend etc. Pitch your topic with ease and precision using this Share Market Dashboard Highlighting Price Moving Average Trend Themes PDF. This layout presents information on Moving Average, Stock Price, Performing Stocks. It is also available for immediate download and adjustment. So, changes can be made in the color, design, graphics or any other component to create a unique layout.
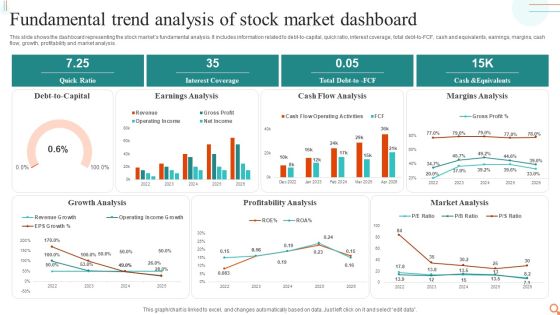
Fundamental Trend Analysis Of Stock Market Dashboard Professional PDF
This slide shows the dashboard representing the stock markets fundamental analysis. It includes information related to debt-to-capital, quick ratio, interest coverage, total debt-to-FCF, cash and equivalents, earnings, margins, cash flow, growth, profitability and market analysis.Showcasing this set of slides titled Fundamental Trend Analysis Of Stock Market Dashboard Professional PDF. The topics addressed in these templates are Earnings Analysis, Cash Flow Analysis, Margins Analysis. All the content presented in this PPT design is completely editable. Download it and make adjustments in color, background, font etc. as per your unique business setting.

Analyzing Customer Demographics Through Performance KPI Dashboard Graphics PDF
The following slide outlines key performance indicator KPI dashboard outlining customer demographics. Information covered in this slide is related to metrics such as gender, education level, technology adoption life cycle, and brand innovation consent. Find a pre designed and impeccable Analyzing Customer Demographics Through Performance KPI Dashboard Graphics PDF. The templates can ace your presentation without additional effort. You can download these easy to edit presentation templates to make your presentation stand out from others. So, what are you waiting for Download the template from Slidegeeks today and give a unique touch to your presentation.

Business Referral Marketing Program Performance Metrics Dashboard Introduction PDF
This slide shows KPI dashboard to effectively track performance of business referral program in order to attract more leads and potential customers to the busines. It includes details related to key metrics such as referral participation rate, referred customers, referral conversion rate and total revenue generated. Showcasing this set of slides titled Business Referral Marketing Program Performance Metrics Dashboard Introduction PDF. The topics addressed in these templates are Referral Participation Rate, Referred Customers, Referral Conversion Rate, Total Revenue Generated. All the content presented in this PPT design is completely editable. Download it and make adjustments in color, background, font etc. as per your unique business setting.
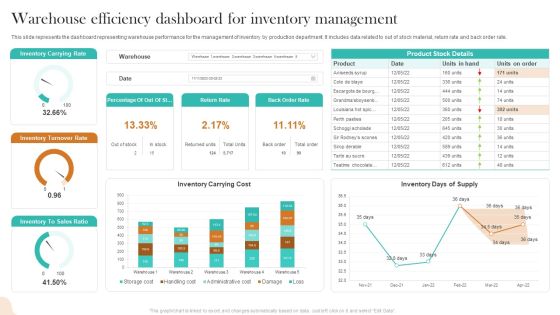
Warehouse Efficiency Dashboard For Inventory Management Infographics PDF
This slide represents the dashboard representing warehouse performance for the management of inventory by production department. It includes data related to out of stock material, return rate and back order rate. Showcasing this set of slides titled Warehouse Efficiency Dashboard For Inventory Management Infographics PDF. The topics addressed in these templates are Inventory Carrying Rate, Inventory Turnover Rate, Inventory Carrying Cost. All the content presented in this PPT design is completely editable. Download it and make adjustments in color, background, font etc. as per your unique business setting.
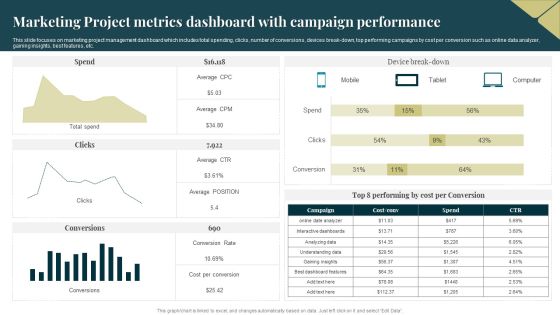
Marketing Project Metrics Dashboard With Campaign Performance Topics PDF
This slide focuses on marketing project management dashboard which includes total spending, clicks, number of conversions, devices break down, top performing campaigns by cost per conversion such as online data analyzer, gaining insights, best features, etc. Showcasing this set of slides titled Marketing Project Metrics Dashboard With Campaign Performance Topics PDF. The topics addressed in these templates are Average, Cost, Analyzing Data. All the content presented in this PPT design is completely editable. Download it and make adjustments in color, background, font etc. as per your unique business setting.

Dashboard To Monitor Logistics Chains Warehouse Operations Diagrams PDF
Following slide depicts a dashboard which can be used by supplier to get a centralized, real-time view of key metrics and data points related to the logistics performance. Key performance metrics are related to due receipts, number of products received,items in transit, items due for pickup etc. Pitch your topic with ease and precision using this Dashboard To Monitor Logistics Chains Warehouse Operations Diagrams PDF. This layout presents information on Product Status, Pickup List Status, Best Selling Products. It is also available for immediate download and adjustment. So, changes can be made in the color, design, graphics or any other component to create a unique layout.

Dashboard To Analyze Healthcare Organization Data Summary PDF
This slide depicts the dashboard used for analyzing healthcare organization data. The purpose of this template is to provide details related to the patients, staffs and cost. It includes information related to the outpatient and inpatient trends, waiting time, etc. Showcasing this set of slides titled Dashboard To Analyze Healthcare Organization Data Summary PDF. The topics addressed in these templates are Patient Satisfaction, Average, Analyze Healthcare Organization Data. All the content presented in this PPT design is completely editable. Download it and make adjustments in color, background, font etc. as per your unique business setting.
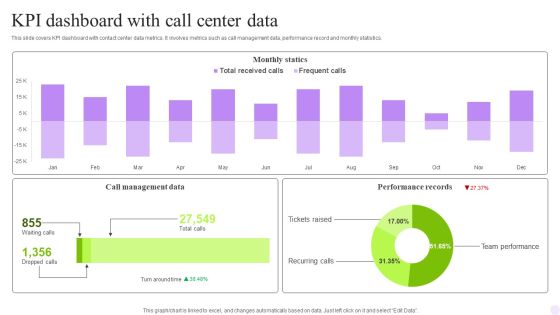
KPI Dashboard With Call Center Data Rules PDF
This slide covers contact center performance metrics KPI dashboard. It involves details such as number of total calls, average answer speed, abandon rate, data of agents performance and call abandon rate by departments. Pitch your topic with ease and precision using this KPI Dashboard With Call Center Data Rules PDF. This layout presents information on Monthly Statics, Management Data, Performance Records. It is also available for immediate download and adjustment. So, changes can be made in the color, design, graphics or any other component to create a unique layout.
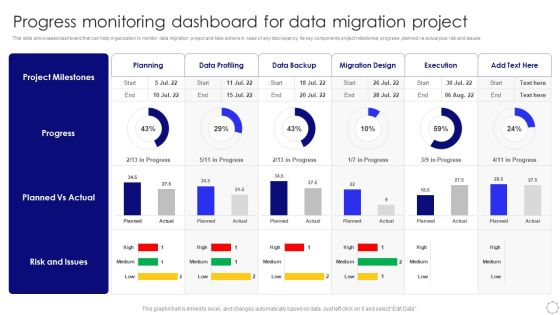
Progress Monitoring Dashboard For Data Migration Project Sample PDF
This slide showcases dashboard that can help organization to monitor data migration project and take actions in case of any discrepancy. Its key components project milestones progress, planned vs actual plus risk and issues. Pitch your topic with ease and precision using this Progress Monitoring Dashboard For Data Migration Project Sample PDF. This layout presents information on Planned Vs Actual, Risk And Issues, Project Milestones. It is also available for immediate download and adjustment. So, changes can be made in the color, design, graphics or any other component to create a unique layout.

Consumer Data Augmentation With Salesforce Dashboard Ppt Pictures Portrait PDF
The following slide displays a dashboard of customer data enrichment with the sales force. It contains information about promoter score, customer loyalty, top performer agents, customer satisfaction, and agent performance. Showcasing this set of slides titled Consumer Data Augmentation With Salesforce Dashboard Ppt Pictures Portrait PDF. The topics addressed in these templates are Promoter Score, Customer Loyalty, Top Performing Agents. All the content presented in this PPT design is completely editable. Download it and make adjustments in color, background, font etc. as per your unique business setting.

Personnel Management Dashboard With Salary And Overtime Data Ideas PDF
The following slide highlights the payroll management dashboard with salary and overtime data illustrating key headings which includes employee cost, average salary, overtime per day, Average base salary and average overtime cost. Pitch your topic with ease and precision using this Personnel Management Dashboard With Salary And Overtime Data Ideas PDF. This layout presents information on Average, Customer Service, Cost. It is also available for immediate download and adjustment. So, changes can be made in the color, design, graphics or any other component to create a unique layout.

Company Payout Dashboard For Transaction Data Collection Themes PDF
The slide covers a dashboard to highlight the status of current and previous transactions. Various elements included are card details, my cash, my savings, money sent, amount transfers, transaction history, etc. Pitch your topic with ease and precision using this Company Payout Dashboard For Transaction Data Collection Themes PDF. This layout presents information on Amount Transfers, Earning Month, Previous Transaction. It is also available for immediate download and adjustment. So, changes can be made in the color, design, graphics or any other component to create a unique layout.

Company Payout Dashboard Representing Accounts Payable Data Introduction PDF
The slide demonstrates a payment dashboard to measure and manage accounts payable. Various elements included are payable account, overdue, cash on hand, accounts payable funnel, invoice status, etc. Pitch your topic with ease and precision using this Company Payout Dashboard Representing Accounts Payable Data Introduction PDF. This layout presents information on Payable Accounts, Overdue, Invoices By Status, Account Payable Age. It is also available for immediate download and adjustment. So, changes can be made in the color, design, graphics or any other component to create a unique layout.

Big Data In Health Industry Dashboard In Industry Summary PDF
The slide depicts patient KPI dashboard for healthcare which can be used to improve service levels as well as treatment across departments. It include metrics such as bed occupancy rate, patient turnover, satisfaction rate, missed and cancelled appointment rate. Showcasing this set of slides titled Big Data In Health Industry Dashboard In Industry Summary PDF. The topics addressed in these templates are Geriatrics, Gynecology, Internal Medicine. All the content presented in this PPT design is completely editable. Download it and make adjustments in color, background, font etc. as per your unique business setting.

Dashboard Highlighting Product Kpis For Enhancement Strategy Structure PDF
This slide illustrates dashboard indicating product kpis for improvement plan which can be referred by organizations to review sales campaign performance. It includes information about top products in revenue, online vs. Offline transactions, increased sales by campaign and cost of products sold. Showcasing this set of slides titled Dashboard Highlighting Product Kpis For Enhancement Strategy Structure PDF. The topics addressed in these templates are Revenue, Products, Cost. All the content presented in this PPT design is completely editable. Download it and make adjustments in color, background, font etc. as per your unique business setting.

Communication Kpis Performance Dashboard Of Social Media Channels Mockup PDF
This slide showcases dashboard that can help organization to analyze the effectiveness of communication KPIs campaign by studying channel views and number of likes. Its key components are youtube channel views, linkedin shares, linked in clicks and facebook daily reach. Pitch your topic with ease and precision using this Communication Kpis Performance Dashboard Of Social Media Channels Mockup PDF. This layout presents information on Linkedin Shares, Facebook Page likes, Facebook Daily Reach. It is also available for immediate download and adjustment. So, changes can be made in the color, design, graphics or any other component to create a unique layout.

Monthly Email Communication Kpis And Dashboard Download PDF
This slide showcases dashboard for email communication KPIs that can help organization to analyze the reach and average response time of customers. Its key elements are send messages, recipients, received messages, senders and monthly email distribution. Pitch your topic with ease and precision using this Monthly Email Communication Kpis And Dashboard Download PDF. This layout presents information on Sent Messages, Recipients, Average Response Time, Received Message. It is also available for immediate download and adjustment. So, changes can be made in the color, design, graphics or any other component to create a unique layout.
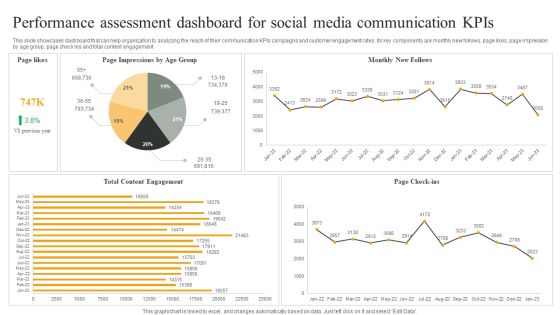
Performance Assessment Dashboard For Social Media Communication Kpis Graphics PDF
This slide showcases dashboard that can help organization to analyzing the reach of their communication KPIs campaigns and customer engagement rates. Its key components are monthly new follows, page likes, page impression by age group, page check ins and total content engagement. Pitch your topic with ease and precision using this Performance Assessment Dashboard For Social Media Communication Kpis Graphics PDF. This layout presents information on Monthly New Follows, Page Check ins, Total Content Engagement. It is also available for immediate download and adjustment. So, changes can be made in the color, design, graphics or any other component to create a unique layout.

Gathering Customer Dashboard For Personalized Digital Marketing Kpis Demonstration PDF
This slide showcases dashboard that can help organization to measure the KPIs after implementing personalized marketing campaigns. Its key elements are lead breakdown, web user to lead, lead to trial, leads by region and google analytics web traffic. Find a pre-designed and impeccable Gathering Customer Dashboard For Personalized Digital Marketing Kpis Demonstration PDF. The templates can ace your presentation without additional effort. You can download these easy-to-edit presentation templates to make your presentation stand out from others. So, what are you waiting for Download the template from Slidegeeks today and give a unique touch to your presentation.
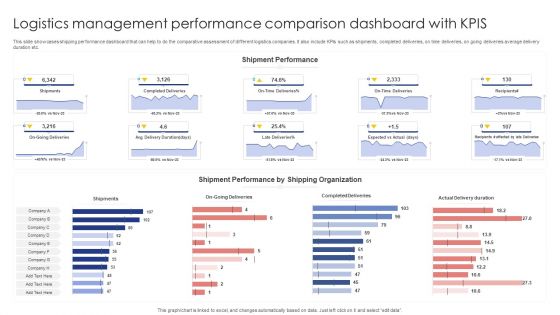
Logistics Management Performance Comparison Dashboard With Kpis Sample PDF
This slide showcases shipping performance dashboard that can help to do the comparative assessment of different logistics companies. It also include KPIs such as shipments, completed deliveries, on time deliveries, on going deliveries average delivery duration etc. Pitch your topic with ease and precision using this Logistics Management Performance Comparison Dashboard With Kpis Sample PDF. This layout presents information on Shipments, Completed Deliveries, Actual Delivery Duration. It is also available for immediate download and adjustment. So, changes can be made in the color, design, graphics or any other component to create a unique layout.
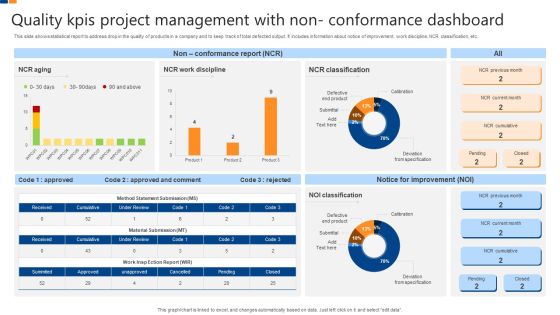
Quality Kpis Project Management With Non Conformance Dashboard Structure PDF
This slide shows statistical report to address drop in the quality of products in a company and to keep track of total defected output. It includes information about notice of improvement, work discipline, NCR classification, etc. Showcasing this set of slides titled Quality Kpis Project Management With Non Conformance Dashboard Structure PDF. The topics addressed in these templates are Quality Kpis Project Management, Non Conformance Dashboard. All the content presented in this PPT design is completely editable. Download it and make adjustments in color, background, font etc. as per your unique business setting.

Business Identity Dashboard Indicating Corporate Marketing Kpis Diagrams PDF
This slide shows business identity dashboard indicating brand marketing performance metrics. It contains details about brand metrics, advertisement metrics and purchase metrics. It also includes details from brand awareness to repeat purchase. Showcasing this set of slides titled Business Identity Dashboard Indicating Corporate Marketing Kpis Diagrams PDF. The topics addressed in these templates are Purchase, Engagement, Market Share. All the content presented in this PPT design is completely editable. Download it and make adjustments in color, background, font etc. as per your unique business setting.

Safety Measurement Dashboard With Key Kpis And Severity Sample PDF
This slide represents the dashboard showing performance measurement analysis of safety team of an organization. It includes details related to incidents, critical incidents and its cost, severity, type of incident and their consequence. Showcasing this set of slides titled Safety Measurement Dashboard With Key Kpis And Severity Sample PDF. The topics addressed in these templates are Incidents, Critical Incidents, Day Since Last Incident. All the content presented in this PPT design is completely editable. Download it and make adjustments in color, background, font etc. as per your unique business setting.
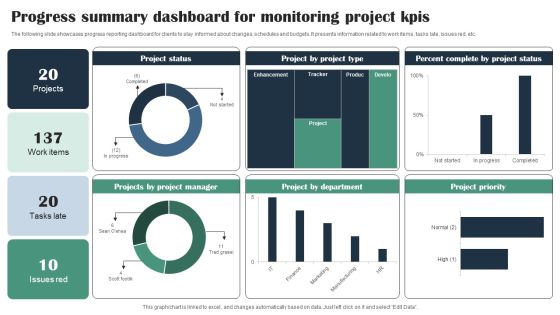
Progress Summary Dashboard For Monitoring Project Kpis Infographics PDF
The following slide showcases progress reporting dashboard for clients to stay informed about changes, schedules and budgets. It presents information related to work items, tasks late, issues red, etc. Pitch your topic with ease and precision using this Progress Summary Dashboard For Monitoring Project Kpis Infographics PDF. This layout presents information on Project Status, Project Manager, Project Type, Percent Complete. It is also available for immediate download and adjustment. So, changes can be made in the color, design, graphics or any other component to create a unique layout.

Customer Related Quality Kpis Dashboard For Project Management Brochure PDF
This slide displays a dashboard for measurement of parameters related to customer satisfaction. It includes details such as net promoter score, customer retention rate, customer efforts, etc. Showcasing this set of slides titled Customer Related Quality Kpis Dashboard For Project Management Brochure PDF. The topics addressed in these templates are Customer Retention Rate, Net Promoter Score, Customer Effort Score. All the content presented in this PPT design is completely editable. Download it and make adjustments in color, background, font etc. as per your unique business setting.

Dashboard For Analysing Aftersales Customer Satisfaction Kpis Information PDF
This slide covers a dashboard for tracking consumer satisfaction with metrics such as customer satisfaction score, customer effort score, net promoter score, average response time, etc. Find a pre designed and impeccable Dashboard For Analysing Aftersales Customer Satisfaction Kpis Information PDF. The templates can ace your presentation without additional effort. You can download these easy to edit presentation templates to make your presentation stand out from others. So, what are you waiting for Download the template from Slidegeeks today and give a unique touch to your presentation.

Safety Kpis Dashboard For Manufacturing Company Slides PDF
This slide shows the metrics dashboard representing the safety metrics for the manufacturing company. It includes details related to incidents per employee, total number of incidents in the company, incidents accumulated total etc.. Pitch your topic with ease and precision using this Safety Kpis Dashboard For Manufacturing Company Slides PDF. This layout presents information on Incidents Per Employee, Safety Incident Reported, Incidence Avoidance Quiz Score. It is also available for immediate download and adjustment. So, changes can be made in the color, design, graphics or any other component to create a unique layout.

Call Center Kpis Agent Performance Dashboard Clipart PDF
This slide covers contact center agent performance metrics KPI dashboard. It involves metrics such as number of calls, average response time, average hold time, daily average transfer rate and agents with most hold time and transfer rate. Showcasing this set of slides titled Call Center Kpis Agent Performance Dashboard Clipart PDF. The topics addressed in these templates are Transfer Rate, Call Center, Hold Time. All the content presented in this PPT design is completely editable. Download it and make adjustments in color, background, font etc. as per your unique business setting.

Call Center Kpis Dashboard For Chat Management Graphics PDF
This slide covers contact center KPI dashboard for chat management. It involves details such as chats over time by site, location and language, total number of chats, average response time by employees. Showcasing this set of slides titled Call Center Kpis Dashboard For Chat Management Graphics PDF. The topics addressed in these templates are Management, Employees, Chats. All the content presented in this PPT design is completely editable. Download it and make adjustments in color, background, font etc. as per your unique business setting.

Project Metrics Dashboard With Monthly Timeline Pictures PDF
This slide covers the project management dashboard which focuses on project objective, main focus,, issues and risks, key discussion points, project status, primary resources with roles, monthly timeline depicting milestones sch as charter, coding, designing, etc. Showcasing this set of slides titled Project Metrics Dashboard With Monthly Timeline Pictures PDF. The topics addressed in these templates are Primary Resources, Risk, Requirements. All the content presented in this PPT design is completely editable. Download it and make adjustments in color, background, font etc. as per your unique business setting.
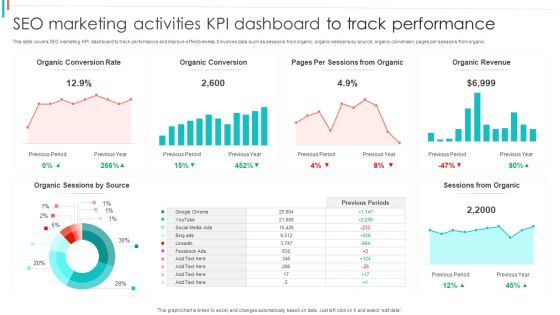
SEO Marketing Activities KPI Dashboard To Track Performance Brochure PDF
This slide covers SEO marketing KPI dashboard to track performance and improve effectiveness. It involves data such as sessions from organic, organic sessions by source, organic conversion, pages per sessions from organic.Pitch your topic with ease and precision using this SEO Marketing Activities KPI Dashboard To Track Performance Brochure PDF. This layout presents information on Organic Conversion, Sessions Organic, Organic Revenue. It is also available for immediate download and adjustment. So, changes can be made in the color, design, graphics or any other component to create a unique layout.

Agile Human Resource Transformation KPI Dashboard Microsoft PDF
This slide highlights the impact of agile HR transformation to analyze the key performing areas. The dashboard includes key metrics showcasing employee headcount, diversity, hiring status, leave days and the termination data. Showcasing this set of slides titled Agile Human Resource Transformation KPI Dashboard Microsoft PDF. The topics addressed in these templates are Employees, Diversity, Hiring, Leave Days, Termination. All the content presented in this PPT design is completely editable. Download it and make adjustments in color, background, font etc. as per your unique business setting.
Lead Tracking Metrics Dashboard With User Responses Diagrams PDF
This slide showcases dashboard for lead conversion metrics that can help organization to filter out total leads interested from the leads who have responded to the phone calls by organization. It also showcases key metrics such as leads busiest hours, leads busiest days, phone number types and lead types. Showcasing this set of slides titled Lead Tracking Metrics Dashboard With User Responses Diagrams PDF. The topics addressed in these templates are Busiest Hours Leads, Conversion Metrics, Lead Types. All the content presented in this PPT design is completely editable. Download it and make adjustments in color, background, font etc. as per your unique business setting.

Freelance Content Marketing Dashboard With Metrics Demonstration PDF
The following slide highlights the freelance content marketing dashboard with metrics illustrating most visited content, monthly total visit, average content score. It depicts key metrics which includes content reach, unique visits, organic ranking, number of shares, rating, session time and repeat visitors. Showcasing this set of slides titled Freelance Content Marketing Dashboard With Metrics Demonstration PDF. The topics addressed in these templates are Organic Ranking, Manufacturing, Average Content Score. All the content presented in this PPT design is completely editable. Download it and make adjustments in color, background, font etc. as per your unique business setting.

 Home
Home