AI PPT Maker
Templates
PPT Bundles
Design Services
Business PPTs
Business Plan
Management
Strategy
Introduction PPT
Roadmap
Self Introduction
Timelines
Process
Marketing
Agenda
Technology
Medical
Startup Business Plan
Cyber Security
Dashboards
SWOT
Proposals
Education
Pitch Deck
Digital Marketing
KPIs
Project Management
Product Management
Artificial Intelligence
Target Market
Communication
Supply Chain
Google Slides
Research Services
 One Pagers
All Categories
-
Home
- Customer Favorites
- Dashboards Construction
Dashboards Construction

Roles And Responsibilities Of Marketing Analytics Team Mockup PDF
The purpose of this slide is to showcase major roles of strategist, influencer, data scientist, analyst, data engineer and solution design. Company can track and optimize the campaign performance by hiring above mentioned members in the marketing analytics team. Presenting Roles And Responsibilities Of Marketing Analytics Team Mockup PDF to dispense important information. This template comprises four stages. It also presents valuable insights into the topics including Business Strategy, Technical Expertise, Technology Strategy. This is a completely customizable PowerPoint theme that can be put to use immediately. So, download it and address the topic impactfully.
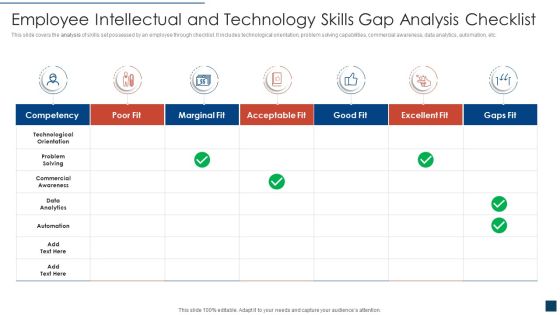
Employee Intellectual And Technology Skills Gap Analysis Checklist Professional PDF
This slide covers the analysis of skills set possessed by an employee through checklist. It includes technological orientation, problem solving capabilities, commercial awareness, data analytics, automation, etc. Pitch your topic with ease and precision using this employee intellectual and technology skills gap analysis checklist professional pdf. This layout presents information on employee intellectual and technology skills gap analysis checklist. It is also available for immediate download and adjustment. So, changes can be made in the color, design, graphics or any other component to create a unique layout.

Human Resource Recruitment Source Metrics Portrait PDF
This slide recruitment sources that can help to compare the human resource KPIs from different platforms and evaluate the reason behind it. Its key elements are qualified candidates per opening, average time to hire, average cost per hire and offer acceptance rate. Pitch your topic with ease and precision using this Human Resource Recruitment Source Metrics Portrait PDF. This layout presents information on Application Completion, Lowest Cost Per, Advertisement Cost. It is also available for immediate download and adjustment. So, changes can be made in the color, design, graphics or any other component to create a unique layout.

Key Metrics For Client Engagement Loyalty Program Microsoft PDF
This slide shows key metrics to measure customer loyalty program . It includes factors such as retention rate, negative churn, promoter score, and effort score. Persuade your audience using this Key Metrics For Client Engagement Loyalty Program Microsoft PDF. This PPT design covers four stages, thus making it a great tool to use. It also caters to a variety of topics including Retention Rate, Negative Churn, Promoter Score, Effort Score. Download this PPT design now to present a convincing pitch that not only emphasizes the topic but also showcases your presentation skills.

Key Metrics To Track PPC Marketing Campaigns Topics PDF
This slide exhibits metrics that helps to increase return on investment of paid campaigns. It includes five key indicators clicks, impressions, conversion rate, quality score and return on ad spend. Persuade your audience using this Key Metrics To Track PPC Marketing Campaigns Topics PDF. This PPT design covers five stages, thus making it a great tool to use. It also caters to a variety of topics including Conversion Rate, Return On Ad Spend, Impressions. Download this PPT design now to present a convincing pitch that not only emphasizes the topic but also showcases your presentation skills.
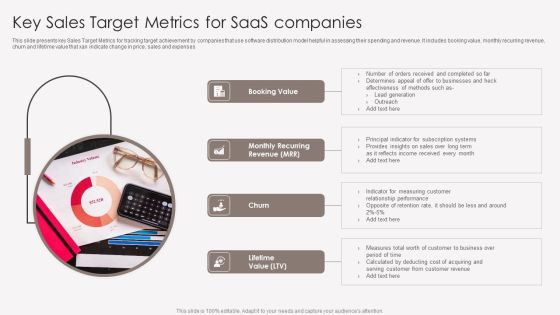
Key Sales Target Metrics For Saas Companies Portrait PDF
This slide presents key Sales Target Metrics for tracking target achievement by companies that use software distribution model helpful in assessing their spending and revenue. It includes booking value, monthly recurring revenue, churn and lifetime value that xan indicate change in price, sales and expenses. Persuade your audience using this Key Sales Target Metrics For Saas Companies Portrait PDF. This PPT design covers four stages, thus making it a great tool to use. It also caters to a variety of topics including Booking Value, Churn, Lifetime Value. Download this PPT design now to present a convincing pitch that not only emphasizes the topic but also showcases your presentation skills.
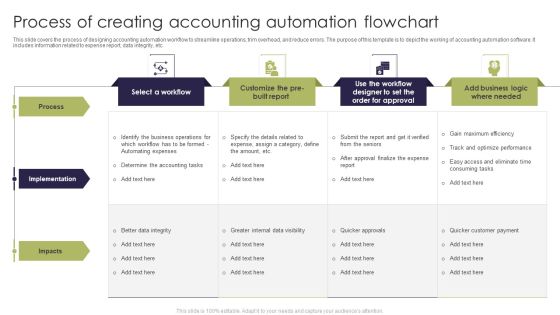
Process Of Creating Accounting Automation Flowchart Template PDF
This slide covers the process of designing accounting automation workflow to streamline operations, trim overhead, and reduce errors. The purpose of this template is to depict the working of accounting automation software. It includes information related to expense report, data integrity, etc. Showcasing this set of slides titled Process Of Creating Accounting Automation Flowchart Template PDF. The topics addressed in these templates are Process, Implementation, Impacts. All the content presented in this PPT design is completely editable. Download it and make adjustments in color, background, font etc. as per your unique business setting.

Data Governance IT 30 60 90 Days Plan For Creating Data Stewardship Program Rules PDF
This slide depicts the 30 60 90 days plan for creating a data stewardship program for the organization. It includes defining goals and achievement measures, analyzing the current situation and gap analysis, obtaining stakeholders approval, making and executing the plan, and maintaining and monitoring. Find a pre designed and impeccable Data Governance IT 30 60 90 Days Plan For Creating Data Stewardship Program Rules PDF. The templates can ace your presentation without additional effort. You can download these easy to edit presentation templates to make your presentation stand out from others. So, what are you waiting for Download the template from Slidegeeks today and give a unique touch to your presentation.

Big Data Consolidation And Diagnostics Analytics Rules PDF
Persuade your audience using this big data consolidation and diagnostics analytics rules pdf. This PPT design covers five stages, thus making it a great tool to use. It also caters to a variety of topics including data consolidation, diagnostics, data preparation. Download this PPT design now to present a convincing pitch that not only emphasizes the topic but also showcases your presentation skills.

Pandl Kpis Tabular Form Ppt PowerPoint Presentation File Design Templates
This is a pandl kpis tabular form ppt powerpoint presentation file design templates. This is a four stage process. The stages in this process are revenue, cogs, operating profit, net profit.

Balance Sheet Kpis Ppt PowerPoint Presentation Show Designs
This is a balance sheet kpis ppt powerpoint presentation show designs. This is a four stage process. The stages in this process are shareholders equity, non current liabilities, trade payables, total liabilities.
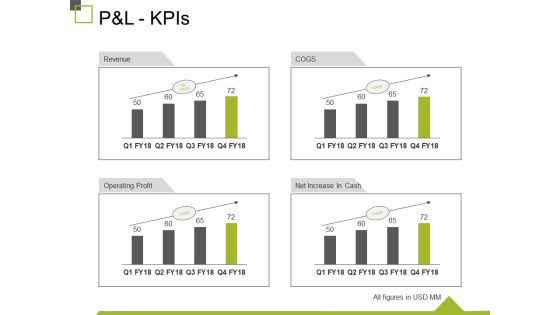
P And L Kpis Ppt PowerPoint Presentation Show Design Inspiration
This is a p and l kpis ppt powerpoint presentation show design inspiration. This is a four stage process. The stages in this process are revenue, operating profit, cogs, net increase in cash, business.

Balance Sheet Kpis Ppt PowerPoint Presentation Layouts Design Ideas
This is a balance sheet kpis ppt powerpoint presentation layouts design ideas. This is a four stage process. The stages in this process are current assets, current liabilities, total assets, total liabilities.

P And L Kpis Ppt PowerPoint Presentation Designs Download
This is a p and l kpis ppt powerpoint presentation designs download. This is a four stage process. The stages in this process are revenue, cogs, operating profit, net profit.

Balance Sheet Kpis Ppt PowerPoint Presentation Infographic Template Designs
This is a balance sheet kpis ppt powerpoint presentation infographic template designs. This is a four stage process. The stages in this process are business, marketing, finance, graph, strategy.

Balance Sheet Kpis Ppt PowerPoint Presentation Summary Designs Download
This is a balance sheet kpis ppt powerpoint presentation summary designs download. This is a four stage process. The stages in this process are current assets, current liabilities, total liabilities, operating profit, business.
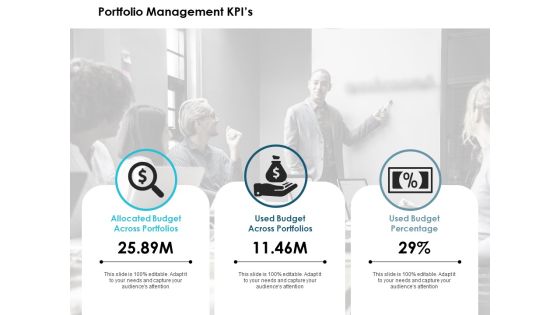
Portfolio Management Kpis Ppt PowerPoint Presentation Pictures Design Inspiration
This is a portfolio management kpis ppt powerpoint presentation pictures design inspiration. This is a three stage process. The stages in this process are management, marketing, business, strategy, planning.

Distribution Network Key CDN Metrics To Watch Themes PDF
This slide represents the key CDN metrics to watch while looking for a CDN provider, such as the time it takes DNS to reply. Presenting Distribution Network Key CDN Metrics To Watch Themes PDF to provide visual cues and insights. Share and navigate important information on seven stages that need your due attention. This template can be used to pitch topics like Key Cdn Metrics, Potential. In addtion, this PPT design contains high resolution images, graphics, etc, that are easily editable and available for immediate download.

Defining Key Metrics To Analyse Current Sales Performance Rules PDF
The following slide showcases some metrics to evaluate existing sales performance due to execute effective risk management strategies. It includes elements such as opportunities, win rate, average time to win, average value per win, sales velocity etc. Do you know about Slidesgeeks Defining Key Metrics To Analyse Current Sales Performance Rules PDF These are perfect for delivering any kind od presentation. Using it, create PowerPoint presentations that communicate your ideas and engage audiences. Save time and effort by using our pre designed presentation templates that are perfect for a wide range of topic. Our vast selection of designs covers a range of styles, from creative to business, and are all highly customizable and easy to edit. Download as a PowerPoint template or use them as Google Slides themes.

Defining Key Metrics To Analyse Current Sales Performance Summary PDF
The following slide showcases some metrics to evaluate existing sales performance due to execute effective risk management strategies. It includes elements such as opportunities, win rate, average time to win, average value per win, sales velocity etc. Do you know about Slidesgeeks Defining Key Metrics To Analyse Current Sales Performance Summary PDF These are perfect for delivering any kind od presentation. Using it, create PowerPoint presentations that communicate your ideas and engage audiences. Save time and effort by using our pre designed presentation templates that are perfect for a wide range of topic. Our vast selection of designs covers a range of styles, from creative to business, and are all highly customizable and easy to edit. Download as a PowerPoint template or use them as Google Slides themes.
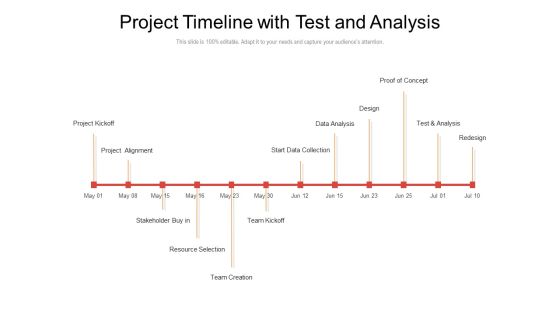
Project Timeline With Test And Analysis Ppt PowerPoint Presentation Inspiration Master Slide PDF
Presenting this set of slides with name project timeline with test and analysis ppt powerpoint presentation inspiration master slide pdf. This is a one stage process. The stages in this process are project kickoff, project alignment, start data collection, data analysis, design, proof of concept, test and analysis, redesign, stakeholder buy in, resource selection, team kickoff, team creation. This is a completely editable PowerPoint presentation and is available for immediate download. Download now and impress your audience.

Measure Campaign Results With Key Metrics Ppt Pictures Examples PDF
The following slide depicts the key metrics to evaluate campaign performance to track planned and actual results. It also includes elements such as click through and bounce rate, cost per click, quality score, paid and organic social media etc. Explore a selection of the finest Measure Campaign Results With Key Metrics Ppt Pictures Examples PDF here. With a plethora of professionally designed and pre made slide templates, you can quickly and easily find the right one for your upcoming presentation. You can use our Measure Campaign Results With Key Metrics Ppt Pictures Examples PDF to effectively convey your message to a wider audience. Slidegeeks has done a lot of research before preparing these presentation templates. The content can be personalized and the slides are highly editable. Grab templates today from Slidegeeks.

Customer Churn Report Ppt PowerPoint Presentation Layouts Mockup
This is a customer churn report ppt powerpoint presentation layouts mockup. This is a four stage process. The stages in this process are percent of customers lost, numbers of customers lost, value of recurring business lost.

IT Project Development Planning Data Migration Approach Structure PDF
This slide covers data migration analysis and discovery, extract, cleanse, validate, load and reconcile, analyze source system and many more.Presenting IT Project Development Planning Data Migration Approach Structure PDF to provide visual cues and insights. Share and navigate important information on six stages that need your due attention. This template can be used to pitch topics like Analysis Discovery, Extract Profile, Transactional Data. In addtion, this PPT design contains high resolution images, graphics, etc, that are easily editable and available for immediate download.
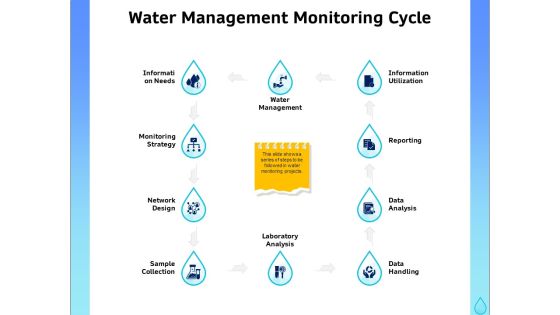
Integrated Water Resource Management Water Management Monitoring Cycle Structure PDF
Presenting this set of slides with name integrated water resource management water management monitoring cycle structure pdf. This is a ten stage process. The stages in this process are information needs, monitoring strategy, network design, sample collection, laboratory analysis, data handling, data analysis, reporting information utilization, water management. This is a completely editable PowerPoint presentation and is available for immediate download. Download now and impress your audience.
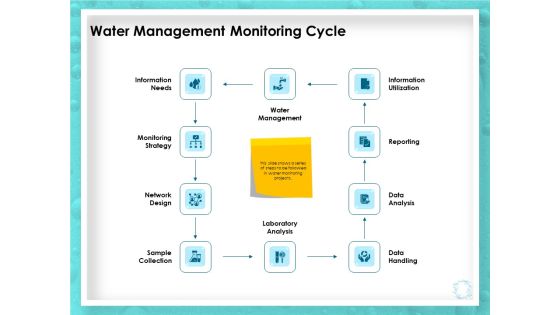
WQM System Water Management Monitoring Cycle Ppt PowerPoint Presentation Infographic Template Gallery PDF
Presenting this set of slides with name wqm system water management monitoring cycle ppt powerpoint presentation infographic template gallery pdf. This is a ten stage process. The stages in this process are information needs, monitoring strategy, network design, sample collection, laboratory analysis, data handling, data analysis, reporting information utilization, water management. This is a completely editable PowerPoint presentation and is available for immediate download. Download now and impress your audience.
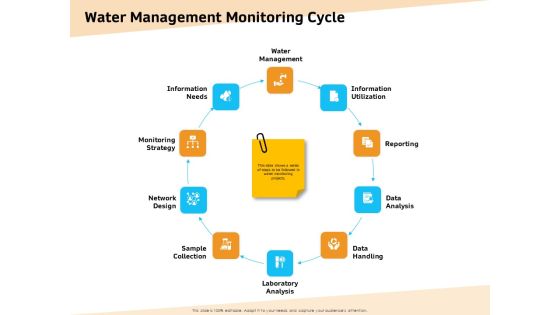
Optimization Of Water Usage Water Management Monitoring Cycle Ppt Summary Backgrounds PDF
Presenting this set of slides with name optimization of water usage water management monitoring cycle ppt summary backgrounds pdf. This is a ten stage process. The stages in this process are information needs, monitoring strategy, network design, sample collection, laboratory analysis, data handling, data analysis, reporting information utilization, water management. This is a completely editable PowerPoint presentation and is available for immediate download. Download now and impress your audience.
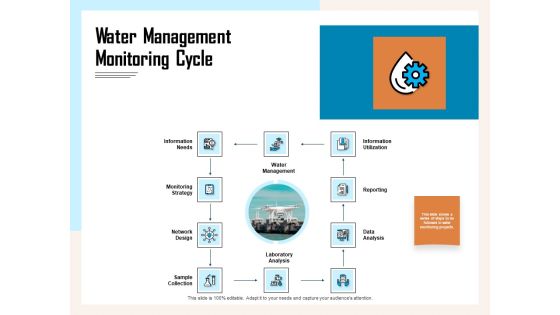
Managing Agriculture Land And Water Water Management Monitoring Cycle Ppt Infographics Slideshow PDF
Presenting this set of slides with name managing agriculture land and water water management monitoring cycle ppt infographics slideshow pdf. This is a ten stage process. The stages in this process are information needs, monitoring strategy, network design, sample collection, laboratory analysis, data handling, data analysis, reporting information utilization, water management. This is a completely editable PowerPoint presentation and is available for immediate download. Download now and impress your audience.
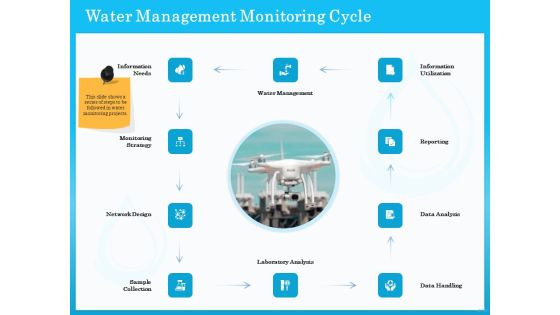
Monitoring And Evaluating Water Quality Water Management Monitoring Cycle Ppt PowerPoint Presentation Styles Graphic Tips PDF
Presenting this set of slides with name monitoring and evaluating water quality water management monitoring cycle ppt powerpoint presentation styles graphic tips pdf. This is a ten stage process. The stages in this process are information needs, monitoring strategy, network design, sample collection, laboratory analysis, data handling, data analysis, reporting information utilization, water management. This is a completely editable PowerPoint presentation and is available for immediate download. Download now and impress your audience.
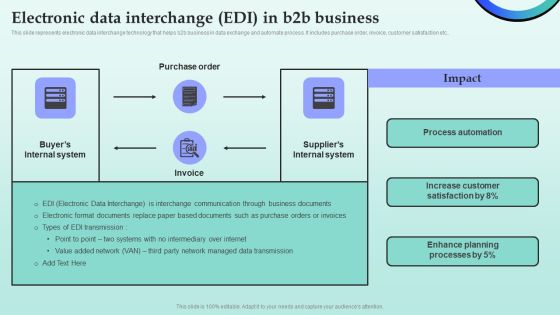
Strategies For Successful Customer Base Development In B2b M Commerce Electronic Data Interchange EDI In B2b Business Ideas PDF
This slide represents electronic data interchange technology that helps b2b business in data exchange and automate process. It includes purchase order, invoice, customer satisfaction etc.. Slidegeeks is here to make your presentations a breeze with Strategies For Successful Customer Base Development In B2b M Commerce Electronic Data Interchange EDI In B2b Business Ideas PDF With our easy to use and customizable templates, you can focus on delivering your ideas rather than worrying about formatting. With a variety of designs to choose from, you are sure to find one that suits your needs. And with animations and unique photos, illustrations, and fonts, you can make your presentation pop. So whether you are giving a sales pitch or presenting to the board, make sure to check out Slidegeeks first.

6 Steps Pie Chart Process Sample Real Estate Business Plan PowerPoint Slides
We present our 6 steps pie chart process sample real estate business plan PowerPoint Slides.Use our Marketing PowerPoint Templates because Timeline crunches are a fact of life. Meet all deadlines using our PowerPoint Templates and Slides. Present our Finance PowerPoint Templates because Our PowerPoint Templates and Slides will weave a web of your great ideas. They are gauranteed to attract even the most critical of your colleagues. Present our Circle Charts PowerPoint Templates because Our PowerPoint Templates and Slides provide you with a vast range of viable options. Select the appropriate ones and just fill in your text. Use our Business PowerPoint Templates because Our PowerPoint Templates and Slides team portray an attitude of elegance. Personify this quality by using them regularly. Download our Targets PowerPoint Templates because Our PowerPoint Templates and Slides will let you Hit the target. Go the full distance with ease and elan.Use these PowerPoint slides for presentations relating to Pie, chart, network, isolnobody, green, copy, flow, business, sign, render, symbol, diagram, change, circle, finance, data, rendering, process, flowchart, plastic, graphics, shape, computer, graph, cycle, connection, circular, strategy, round, shiny, reflection, solution, design, cylinder, growth, single, financial, 3d. The prominent colors used in the PowerPoint template are Red, Gray, Black.

Key Metrics For Measuring The SEO Performance Guidelines PDF
Purpose of the following slide is to show the key metrics of measuring the organizations SEO performance, these metrics can be lead generated, organic traffic, keywords ranking, bounce rate, page per session etc. Presenting Key Metrics For Measuring The SEO Performance Guidelines PDF to provide visual cues and insights. Share and navigate important information on three stages that need your due attention. This template can be used to pitch topics like Bounce Rate, Organic Traffic, Organic Sources. In addtion, this PPT design contains high resolution images, graphics, etc, that are easily editable and available for immediate download.

KPIs To Track The CRM Plan Ppt PowerPoint Presentation Layouts Information PDF
Showcasing this set of slides titled kpis to track the crm plan ppt powerpoint presentation layouts information pdf. The topics addressed in these templates are key performance indicator, before implementing the strategy, companys target, after implementing the strategy, comment. All the content presented in this PPT design is completely editable. Download it and make adjustments in color, background, font etc. as per your unique business setting.
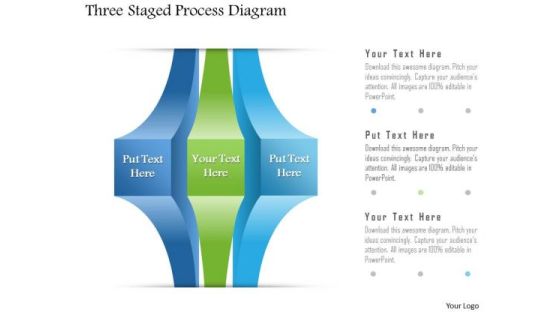
Business Diagram Three Staged Process Diagram PowerPoint Template
Three staged process diagram graphic has been used to design this power point template slide. This PPT contains the concept of data representation for business or marketing. Use this PPT for your business and sales related presentations.

Information Analytics And Ml Strategy Playbook Final Thoughts For Data Analytics Playbook Topics PDF
This template covers the data analytics company final thoughts at the end of the e book. Presenting Information Analytics And Ml Strategy Playbook Final Thoughts For Data Analytics Playbook Topics PDF to provide visual cues and insights. Share and navigate important information on five stages that need your due attention. This template can be used to pitch topics like Analytics, Organization, Business Insights. In addtion, this PPT design contains high resolution images, graphics, etc, that are easily editable and available for immediate download.

Data Lineage Implementation Use Cases Of Data Lineage Dataops Download PDF
This slide talks about how data lineage simplifies the data operations dataops, including impacting analysis, system upgrades, and data migrations. A better comprehension of data aids in improving the effectiveness of data operations and avoiding mistakes. Formulating a presentation can take up a lot of effort and time, so the content and message should always be the primary focus. The visuals of the PowerPoint can enhance the presenters message, so our Data Lineage Implementation Use Cases Of Data Lineage Dataops Download PDF was created to help save time. Instead of worrying about the design, the presenter can concentrate on the message while our designers work on creating the ideal templates for whatever situation is needed. Slidegeeks has experts for everything from amazing designs to valuable content, we have put everything into Data Lineage Implementation Use Cases Of Data Lineage Dataops Download PDF

Forecast Analysis Technique IT Working Of Predictive Modeling Models Information PDF
This slide depicts the working of predictive analytics models that operates iteratively. The main phases in working include business understanding, data understanding, data preparation, modeling, evaluation, and deployment. If your project calls for a presentation, then Slidegeeks is your go to partner because we have professionally designed, easy to edit templates that are perfect for any presentation. After downloading, you can easily edit Forecast Analysis Technique IT Working Of Predictive Modeling Models Information PDF and make the changes accordingly. You can rearrange slides or fill them with different images. Check out all the handy templates.

Customer Onboarding Process Analysis For Commercial Banks Download PDF
The slide describes the time consumed and cost analysis in customer onboarding process in commercial banks. The key steps of onboarding process are onboard request, document gathering, background verification, credit terms setup, agreement management, account setup, tracking and data archiving and analytics and cross selling. Showcasing this set of slides titled Customer Onboarding Process Analysis For Commercial Banks Download PDF. The topics addressed in these templates are Onboard Request, Document Gathering, Background Verification. All the content presented in this PPT design is completely editable. Download it and make adjustments in color, background, font etc. as per your unique business setting.

Managing Stakeholder Relationship Evaluation For Stakeholder Success Indicators Template PDF
This slide covers the stakeholders engagement success measurement key performance indicators including stakeholders type , evaluation areas, methods, sources of information and long term or short term success . Take your projects to the next level with our ultimate collection of Managing Stakeholder Relationship Evaluation For Stakeholder Success Indicators Template PDF. Slidegeeks has designed a range of layouts that are perfect for representing task or activity duration, keeping track of all your deadlines at a glance. Tailor these designs to your exact needs and give them a truly corporate look with your own brand colors theyll make your projects stand out from the rest.

Data Warehouse Ppt Diagram Presentation Powerpoint
This is a data warehouse ppt diagram presentation powerpoint. This is a five stage process. The stages in this process are enterprise architecture, metadata management, decision support systems, data warehouse, data governance.

Business Diagram Business People Over Bar Chart PowerPoint Template
This Power Point template has been designed with graphic of business people and bar chart. This PPT contains the concept of result analysis and business data display. Use this PPT slide for your business and marketing related presentations.

Data Evaluation And Processing Toolkit Change Management Data Analytics Process Themes PDF
In this slide, we are tabulating the key processes and activities involved for data management process. It contains information on implementing the change management in data analytic framework. Get a simple yet stunning designed Data Evaluation And Processing Toolkit Change Management Data Analytics Process Themes PDF. It is the best one to establish the tone in your meetings. It is an excellent way to make your presentations highly effective. So, download this PPT today from Slidegeeks and see the positive impacts. Our easy-to-edit Data Evaluation And Processing Toolkit Change Management Data Analytics Process Themes PDF can be your go-to option for all upcoming conferences and meetings. So, what are you waiting for Grab this template today.

Challenges And Solutions Catered To AI Oriented Marketing Ppt Layouts Information PDF
This slide showcases major challenges and solutions related to usage of artificial intelligence in marketing. It provides details about lack of data quality, legacy system integration, resistance to change, ethical considerations, etc. The Challenges And Solutions Catered To AI Oriented Marketing Ppt Layouts Information PDF is a compilation of the most recent design trends as a series of slides. It is suitable for any subject or industry presentation, containing attractive visuals and photo spots for businesses to clearly express their messages. This template contains a variety of slides for the user to input data, such as structures to contrast two elements, bullet points, and slides for written information. Slidegeeks is prepared to create an impression.

Quarterly Financial Performance Kpis With Balance Sheet Designs PDF
The given slide highlights the quarterly financial performance of a company. It also includes KPIs such as ROA, working capital ratio, return on equity, debt equity ratio etc. Pitch your topic with ease and precision using this Quarterly Financial Performance Kpis With Balance Sheet Designs PDF. This layout presents information on Total Liabilities, Return On Equity, Working Capital Ratio. It is also available for immediate download and adjustment. So, changes can be made in the color, design, graphics or any other component to create a unique layout.
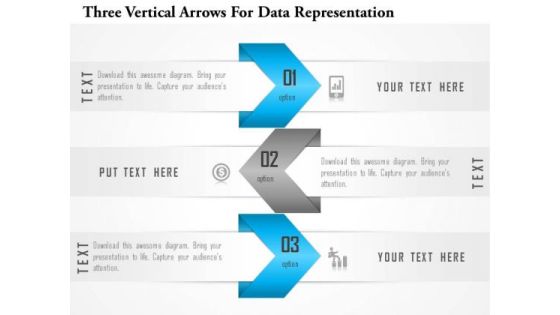
Business Diagram Three Vertical Arrows For Data Representation Presentation Template
This Power Point template slide has been designed with graphic of three vertical arrows. This PPT slide contains the concept of data representation. Use this PPt slide and build innovative presentation for your viewers.

Five Staged Funnel Diagram For Sales Data PowerPoint Template
Five staged funnel diagram has been used to design this power point template. This diagram template contains the concept of sales data representation. Use this PPT for your business and sales related presentations.
Laptop With Data Storage And Management Icons Powerpoint Template
This PowerPoint template has been designed with graphics of laptop with icons. This PPT diagram can be used to display data storage and management concepts. Capture the attention of your audience with this slide.

Analyst Icon Measuring Data Using Analytical Techniques Professional PDF
Persuade your audience using this analyst icon measuring data using analytical techniques professional pdf. This PPT design covers four stages, thus making it a great tool to use. It also caters to a variety of topics including analyst icon measuring data using analytical techniques. Download this PPT design now to present a convincing pitch that not only emphasizes the topic but also showcases your presentation skills.

Cloud Analytics Infrastructure Icon To Enhance Data Management Themes PDF
Persuade your audience using this Cloud Analytics Infrastructure Icon To Enhance Data Management Themes PDF. This PPT design covers four stages, thus making it a great tool to use. It also caters to a variety of topics including Cloud Analytics Infrastructure Icon, Enhance Data Management. Download this PPT design now to present a convincing pitch that not only emphasizes the topic but also showcases your presentation skills.

Closed Loop Supply Chain Management Key Metrics In Reverse Logistics Ppt Outline Design Templates PDF
Presenting this set of slides with name closed loop supply chain management key metrics in reverse logistics ppt outline design templates pdf. The topics discussed in these slides are customer metrics, operations metrics, capacity and quality metrics, employee metrics. This is a completely editable PowerPoint presentation and is available for immediate download. Download now and impress your audience.

Metrics Icon Showcasing Change Management Kpis Designs PDF
Showcasing this set of slides titled Metrics Icon Showcasing Change Management Kpis Designs PDF The topics addressed in these templates are Metrics, Showcasing Change, Management. All the content presented in this PPT design is completely editable. Download it and make adjustments in color, background, font etc. as per your unique business setting.

Data Analytics Cost Structure One Pager Sample Example Document
Presenting you an exemplary Data Analytics Cost Structure One Pager Sample Example Document. Our one-pager comprises all the must-have essentials of an inclusive document. You can edit it with ease, as its layout is completely editable. With such freedom, you can tweak its design and other elements to your requirements. Download this Data Analytics Cost Structure One Pager Sample Example Document brilliant piece now.

Big Data Analytics Procedure To Increase Efficiency Icon Sample PDF
Showcasing this set of slides titled Big Data Analytics Procedure To Increase Efficiency Icon Sample PDF. The topics addressed in these templates are Big Data Analytics, Procedure, Increase Efficiency. All the content presented in this PPT design is completely editable. Download it and make adjustments in color, background, font etc. as per your unique business setting.

Key CRM Metrics To Determine Success Formats PDF
This slide covers information regarding key metrics that are required to determine CRM program success in terms of customer churn, net promoter score, rate of renewal, etc. Do you know about Slidesgeeks Key CRM Metrics To Determine Success Formats PDF These are perfect for delivering any kind od presentation. Using it, create PowerPoint presentations that communicate your ideas and engage audiences. Save time and effort by using our pre-designed presentation templates that are perfect for a wide range of topic. Our vast selection of designs covers a range of styles, from creative to business, and are all highly customizable and easy to edit. Download as a PowerPoint template or use them as Google Slides themes.

Internet Security Threat Analysis With Customer Centric Approach Mockup PDF
Data security breach steps with customer centric approach. It includes 5 steps such as- proactive and preventive analysis, data protection as the default and so on. Showcasing this set of slides titled internet security threat analysis with customer centric approach mockup pdf. The topics addressed in these templates are data minimization, data protection, proactive and preventive. All the content presented in this PPT design is completely editable. Download it and make adjustments in color, background, font etc. as per your unique business setting.

3d Consecutive Flow Process 5 Concepts Ppt Tech Support Chart PowerPoint Slides
We present our 3d consecutive flow process 5 concepts ppt tech support chart PowerPoint Slides. Use our Arrows PowerPoint Templates because, you have what it takes to grow. Use our Business PowerPoint Templates because, you have the basic goal in mind. Use our Design PowerPoint Templates because, various threads are joining up and being stitched together providing necessary strength Now you have to take the last leap. Use our Signs PowerPoint Templates because, Many a core idea has various enveloping layers. Use our Metaphor PowerPoint Templates because, unravel the process layer by layer and expose their relevance to the core issue. Use these PowerPoint slides for presentations relating to Abstract, Action, Attach, Box, Business, Center, Chain, Chart, Color, Communication, Concept, Connection, Cube, Cycle, Data, Diagram, Flow, Globe, Horizontal, Idea, Illustration, Individual, Information, Interaction, Jigsaw, Join, Link, Merge, Missing, Opportunity, Part, People, Piece, Pieces, Process, Puzzle, Relation, Relationship, Search, Shape, Silhouette, Success. The prominent colors used in the PowerPoint template are Blue, Gray, and Black

Project Management Gap Evaluation Showing Current Status Ppt Styles Graphics Design PDF
This slide contains the project management gap analysis to identity and recognize the difference between the current and the future state on various basis. It includes data, market execution and market analytics. Presenting Project Management Gap Evaluation Showing Current Status Ppt Styles Graphics Design PDF to dispense important information. This template comprises one stages. It also presents valuable insights into the topics including Data, Marketing Execution, Marketing Analytics. This is a completely customizable PowerPoint theme that can be put to use immediately. So, download it and address the topic impactfully.

Information Security Program Framework Key Components Ppt Inspiration Ideas PDF
Mentioned slide portrays the key components of companys information security framework. Components covered are context and leadership, evaluation and direction, prevention, detection etc. Deliver and pitch your topic in the best possible manner with this information security program framework key components ppt inspiration ideas pdf. Use them to share invaluable insights on network security, application security, vendor management, data security and impress your audience. This template can be altered and modified as per your expectations. So, grab it now.

Cash Flow Statement Kpis Ppt PowerPoint Presentation Gallery Background Designs
This is a cash flow statement kpis ppt powerpoint presentation gallery background designs. This is a four stage process. The stages in this process are cash flow from operations, cash flow from investing activities, cash flow from financing activities, change in cash and cash equivalents.

Pandl Kpis Investment Ppt PowerPoint Presentation Slides Background Designs
Presenting this set of slides with name pandl kpis investment ppt powerpoint presentation slides background designs. The topics discussed in these slides are financial, marketing, management, investment, analysis. This is a completely editable PowerPoint presentation and is available for immediate download. Download now and impress your audience.
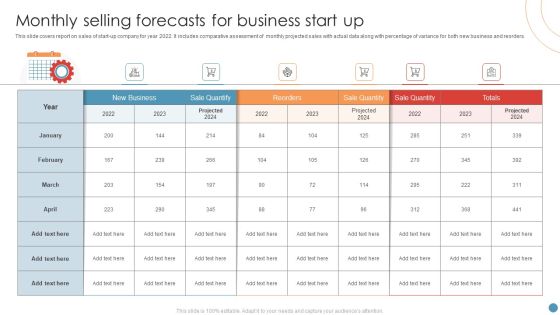
Monthly Selling Forecasts For Business Start Up Pictures PDF
This slide covers report on sales of start up company for year 2022. It includes comparative assessment of monthly projected sales with actual data along with percentage of variance for both new business and reorders. Showcasing this set of slides titled Monthly Selling Forecasts For Business Start Up Pictures PDF. The topics addressed in these templates are Sale Quantify, Business. All the content presented in this PPT design is completely editable. Download it and make adjustments in color, background, font etc. as per your unique business setting.
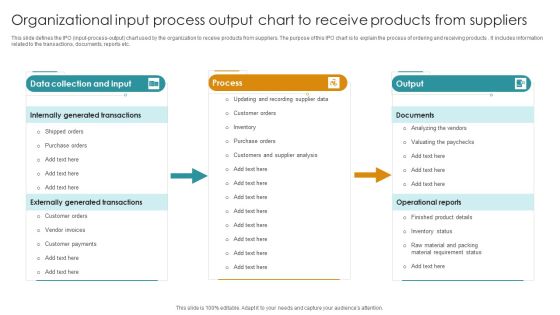
Organizational Input Process Output Chart To Receive Products From Suppliers Topics PDF
This slide defines the IPO input-process-output chart used by the organization to receive products from suppliers. The purpose of this IPO chart is to explain the process of ordering and receiving products . It includes information related to the transactions, documents, reports etc. Pitch your topic with ease and precision using this Organizational Input Process Output Chart To Receive Products From Suppliers Topics PDF. This layout presents information on Data Collection And Input, Process, Output. It is also available for immediate download and adjustment. So, changes can be made in the color, design, graphics or any other component to create a unique layout.

Incorporating HIS To Enhance Healthcare Services Medical Practice Management System To Enhance Services Graphics PDF
This slide covers medical practice management system to improve operational efficiency. It involves key components such as appointment scheduling, organizing patient data and reporting. If your project calls for a presentation, then Slidegeeks is your go to partner because we have professionally designed, easy to edit templates that are perfect for any presentation. After downloading, you can easily edit Incorporating HIS To Enhance Healthcare Services Medical Practice Management System To Enhance Services Graphics PDF and make the changes accordingly. You can rearrange slides or fill them with different images. Check out all the handy templates
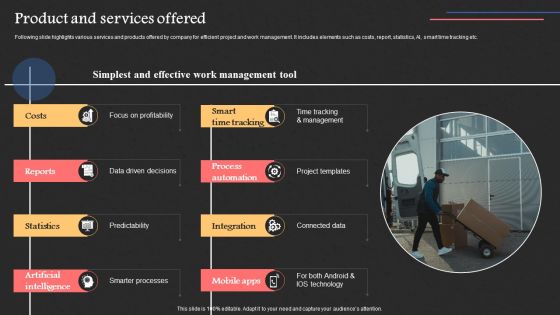
Project Management Software Capital Raising Deck Product And Services Offered Formats PDF
Following slide highlights various services and products offered by company for efficient project and work management. It includes elements such as costs, report, statistics, AI, smart time tracking etc. The Project Management Software Capital Raising Deck Product And Services Offered Formats PDF is a compilation of the most recent design trends as a series of slides. It is suitable for any subject or industry presentation, containing attractive visuals and photo spots for businesses to clearly express their messages. This template contains a variety of slides for the user to input data, such as structures to contrast two elements, bullet points, and slides for written information. Slidegeeks is prepared to create an impression.
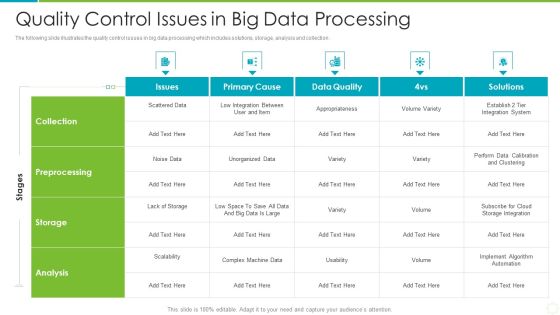
Quality Control Issues In Big Data Processing Themes PDF
The following slide illustrates the quality control issues in big data processing which includes solutions, storage, analysis and collection. Pitch your topic with ease and precision using this quality control issues in big data processing themes pdf. This layout presents information on preprocessing, storage, analysis. It is also available for immediate download and adjustment. So, changes can be made in the color, design, graphics or any other component to create a unique layout
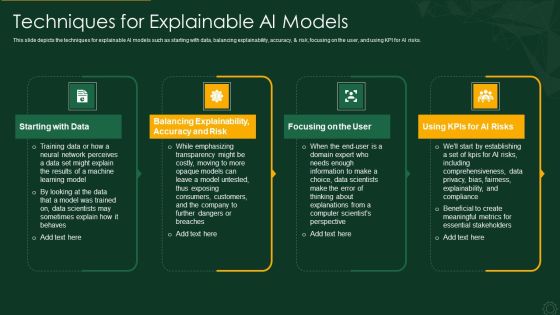
Explainable AI XAI Frameworks IT Techniques For Explainable AI Models Graphics PDF
This slide depicts the techniques for explainable AI models such as starting with data, balancing explainability, accuracy, and risk, focusing on the user, and using KPI for AI risks. Presenting explainable ai xai frameworks it techniques for explainable ai models graphics pdf to provide visual cues and insights. Share and navigate important information on four stages that need your due attention. This template can be used to pitch topics like starting with data, accuracy and risk, focusing on the user, using kpis for ai risks. In addtion, this PPT design contains high resolution images, graphics, etc, that are easily editable and available for immediate download.
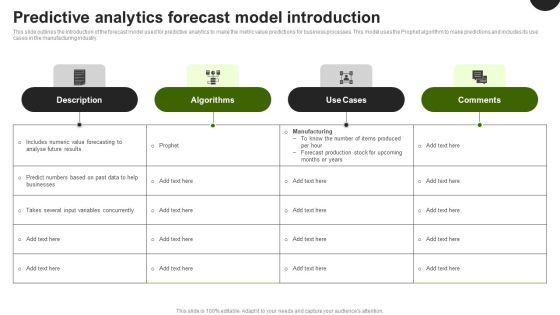
Predictive Analytics In The Age Of Big Data Predictive Analytics Forecast Model Introduction Information PDF
This slide outlines the introduction of the forecast model used for predictive analytics to make the metric value predictions for business processes. This model uses the Prophet algorithm to make predictions and includes its use cases in the manufacturing industry. Formulating a presentation can take up a lot of effort and time, so the content and message should always be the primary focus. The visuals of the PowerPoint can enhance the presenters message, so our Predictive Analytics In The Age Of Big Data Predictive Analytics Forecast Model Introduction Information PDF was created to help save time. Instead of worrying about the design, the presenter can concentrate on the message while our designers work on creating the ideal templates for whatever situation is needed. Slidegeeks has experts for everything from amazing designs to valuable content, we have put everything into Predictive Analytics In The Age Of Big Data Predictive Analytics Forecast Model Introduction Information PDF

Business Diagram Four Staged Torn Paper For Text Display PowerPoint Template
Four staged torn paper style text boxes has been used to design this power point template. This PPT contains the concept of text representation for business process. Use this PPT and build quality presentation for data and process related topics.
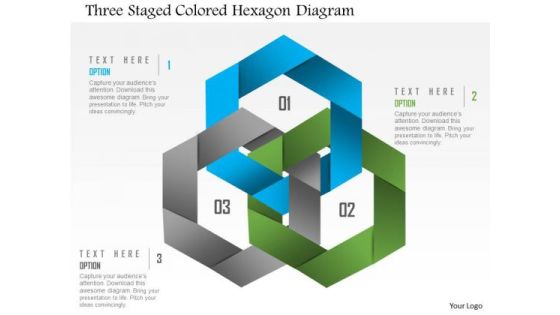
Business Diagram Three Staged Colored Hexagon Diagram PowerPoint Template
Three staged colored hexagon diagram has been used to design this power point template. This PPT contains the concept of study based data representation. This PPT is suitable for business and sales related presentations.
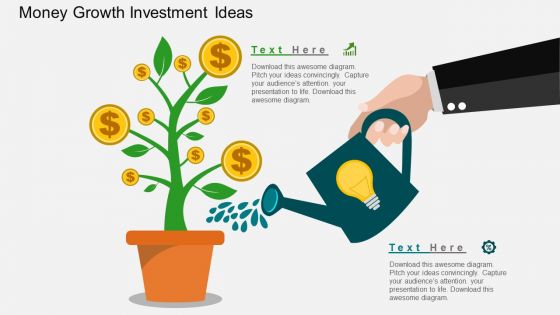
Money Growth Investment Ideas PowerPoint Template
Above is the creatively designed PPT slide which you can use to explain that how the idea of investment can lead to the money growth. This template also help you explain to your colleagues that how different ideas if put together can lead to the betterment of the company or the growth of the company. There are icons present in the template as well which are easily editable. You can choose the color, text and icon of your choice as per your requirement. Use this slide in your presentation and leave great impression on your audience.

Business Diagram Big Data Analysis From Feed Of Zeros And Ones 0s And 1s Magnifying Glass Ppt Slide
This PowerPoint template has been designed with graphic of magnifier on big data text. This magnifier is magnifying the binary data. This slide can be used to represent topics like binary, programming, coding etc.

Market Evaluation Of IT Industry Need For Market Analysis Software Tools Icons PDF
The following slide showcases the requirement for marketing analysis tool. The businesses can use market analysis tool to collect users data, client touchpoints, marketing campaign statistics, and email marketing data. This Market Evaluation Of IT Industry Need For Market Analysis Software Tools Icons PDF is perfect for any presentation, be it in front of clients or colleagues. It is a versatile and stylish solution for organizing your meetings. The Market Evaluation Of IT Industry Need For Market Analysis Software Tools Icons PDF features a modern design for your presentation meetings. The adjustable and customizable slides provide unlimited possibilities for acing up your presentation. Slidegeeks has done all the homework before launching the product for you. So, do not wait, grab the presentation templates today
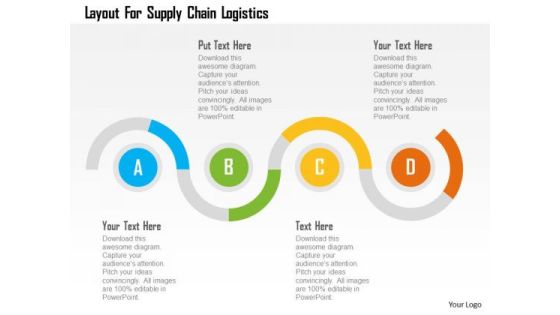
Business Diagram Layout For Supply Chain Logistics Presentation Template
This slide illustrates diagram of zigzag graphics. You may use it to represent concept of supply chain logistics. This diagram is suitable to display business information and also helps to keep your audience interested till the end of your presentation.
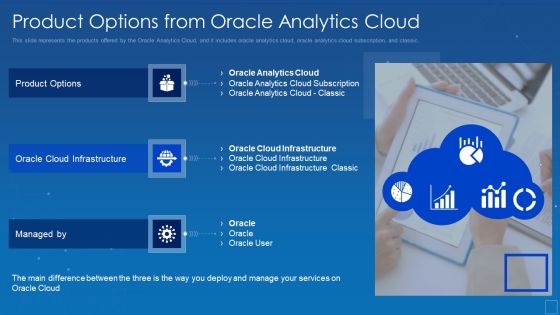
Oracle Cloud Data Analytics Administration IT Product Options From Oracle Analytics Cloud Professional PDF
This slide represents the products offered by the Oracle Analytics Cloud, and it includes oracle analytics cloud, oracle analytics cloud subscription, and classic. Presenting oracle cloud data analytics administration it product options from oracle analytics cloud professional pdf to provide visual cues and insights. Share and navigate important information on three stages that need your due attention. This template can be used to pitch topics like subscription, analytics infrastructure, managed. In addtion, this PPT design contains high resolution images, graphics, etc, that are easily editable and available for immediate download.

Balance Sheet Kpis Company Profile Ppt Ideas Design Inspiration PDF
Presenting balance sheet kpis company profile ppt ideas design inspiration pdf to provide visual cues and insights. Share and navigate important information on seven stages that need your due attention. This template can be used to pitch topics like equity, liabilities, trade payables, term provisions. In addtion, this PPT design contains high resolution images, graphics, etc, that are easily editable and available for immediate download.
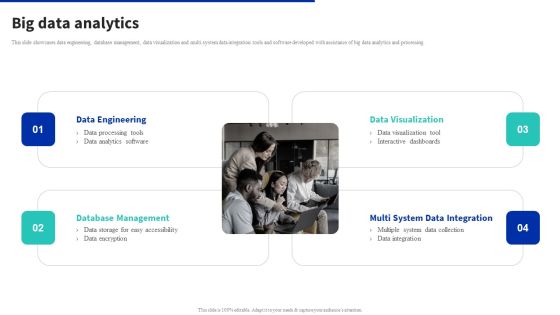
Digital Products Company Outline Big Data Analytics Formats PDF
This slide showcases data engineering, database management, data visualization and multi system data integration tools and software developed with assistance of big data analytics and processing. Create an editable Digital Products Company Outline Big Data Analytics Formats PDF that communicates your idea and engages your audience. Whether you are presenting a business or an educational presentation, pre designed presentation templates help save time. Digital Products Company Outline Big Data Analytics Formats PDF is highly customizable and very easy to edit, covering many different styles from creative to business presentations. Slidegeeks has creative team members who have crafted amazing templates. So, go and get them without any delay.

Big Business Data Analytics Action Plan Topics PDF
Following slide provides insight about inventory data management plan which can be used by business to improve business data analytics process. It includes key components such as departments, data source, manager, data categorization, data size, data type, data quality requirement, data access. Showcasing this set of slides titled Big Business Data Analytics Action Plan Topics PDF. The topics addressed in these templates are Administration, Production And Operations, ERP Systems. All the content presented in this PPT design is completely editable. Download it and make adjustments in color, background, font etc. as per your unique business setting.

Service Price Matrix For Big Data Analytics Themes PDF
This slide includes various data management services which can be used by companies to build competitive advantage. It includes services such as data migration, data integration, data security, data analytics and data quality management. Pitch your topic with ease and precision using this Service Price Matrix For Big Data Analytics Themes PDF. This layout presents information on Assessment Of Business, Financial Data, Data Quality Management. It is also available for immediate download and adjustment. So, changes can be made in the color, design, graphics or any other component to create a unique layout.

Kpis For Evaluating Business Sustainability Table Of Contents Designs PDF
This is a Kpis For Evaluating Business Sustainability Table Of Contents Designs PDF template with various stages. Focus and dispense information on seven stages using this creative set, that comes with editable features. It contains large content boxes to add your information on topics like Business Overview, Competitive Landscape Analysis, Business Goals. You can also showcase facts, figures, and other relevant content using this PPT layout. Grab it now.

Challenges Faced In Data Analytics Healthcare Inspiration PDF
This slide showcases the problems faced in healthcare data analytics. It includes challenges such as evidence based evolving medicine, mixed data and emerging regulatory requirements. Persuade your audience using this Challenges Faced In Data Analytics Healthcare Inspiration PDF. This PPT design covers Three stages, thus making it a great tool to use. It also caters to a variety of topics including Evidence Based, Mixed Data, Emerging Regulatory Requirements. Download this PPT design now to present a convincing pitch that not only emphasizes the topic but also showcases your presentation skills.

Tips To Use Cost And Schedule Performance Index Diagrams PDF
This slide mentions the tips for analyzing cost and schedule performance index effectively. It includes ensuring data accuracy, knowing analysis isnt always correct and ensuring correct usage. Persuade your audience using this Tips To Use Cost And Schedule Performance Index Diagrams PDF. This PPT design covers three stages, thus making it a great tool to use. It also caters to a variety of topics including Cost Reporting, Inaccurate Data, Management Techniques. Download this PPT design now to present a convincing pitch that not only emphasizes the topic but also showcases your presentation skills.

Marketing Communication Strategies Impact Measuring Kpis Microsoft PDF
Mentioned slide demonstrates key metrics to evaluate company progress after implementation of multiple marketing communication strategies. It includes measurement KPIs such as business revenue, product sales, market share, customer engagement and customer retention rate. Get a simple yet stunning designed Marketing Communication Strategies Impact Measuring Kpis Microsoft PDF. It is the best one to establish the tone in your meetings. It is an excellent way to make your presentations highly effective. So, download this PPT today from Slidegeeks and see the positive impacts. Our easy to edit Marketing Communication Strategies Impact Measuring Kpis Microsoft PDF can be your go to option for all upcoming conferences and meetings. So, what are you waiting for Grab this template today.

Personal Brand Pyramid To Build Effective Customer Relationship Microsoft PDF
Following slide illustrates personal brand pyramid can be used for developing effective customer relationship. It includes elements such as values, drivers, reputation, behaviors, skills etc. The Personal Brand Pyramid To Build Effective Customer Relationship Microsoft PDF is a compilation of the most recent design trends as a series of slides. It is suitable for any subject or industry presentation, containing attractive visuals and photo spots for businesses to clearly express their messages. This template contains a variety of slides for the user to input data, such as structures to contrast two elements, bullet points, and slides for written information. Slidegeeks is prepared to create an impression.
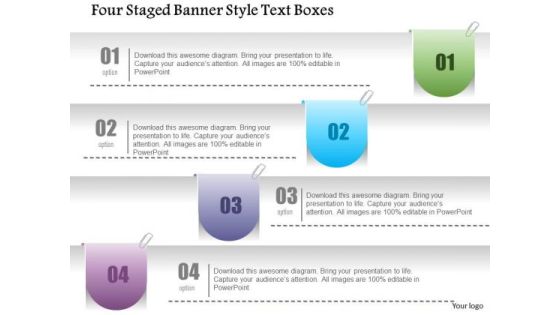
Business Diagram Four Staged Banner Style Text Boxes PowerPoint Template
Four staged banner style text boxes are used to craft this power point template slide. This PPT slide contains the concept of data updating and representation. Use this PPT and crate an impact on your viewers.

Blockchain Technology Framework IT Pillars Of Blockchain Decentralization Summary PDF
This slide describes the decentralization process in blockchain technology and the benefits of decentralization, such as a trustless atmosphere, enhanced data reconciliation, etc. Deliver an awe inspiring pitch with this creative blockchain technology framework it pillars of blockchain decentralization summary pdf bundle. Topics like organization, network can be discussed with this completely editable template. It is available for immediate download depending on the needs and requirements of the user.

Churned Customer Treatment Framework Improving Distribution Channel Ideas PDF
The firm will target its customers by testing various strategies in terms of offers and will check their performance through feedback. Deliver and pitch your topic in the best possible manner with this Churned Customer Treatment Framework Improving Distribution Channel Ideas PDF. Use them to share invaluable insights on Tracking Customer, Customer Response, Response Data and impress your audience. This template can be altered and modified as per your expectations. So, grab it now.

Android Framework For Apps Development And Deployment Competitive Analysis With Various Factors Icons PDF
Presenting this set of slides with name android framework for apps development and deployment competitive analysis with various factors icons pdf. The topics discussed in these slides are superior quality, low price, unique features, installation, data security, user engagement. This is a completely editable PowerPoint presentation and is available for immediate download. Download now and impress your audience.

Business Software Development Company Profile Big Data Analytics Professional PDF
This slide showcases data engineering, database management, data visualization and multi system data integration tools and software developed with assistance of big data analytics and processing. Presenting Business Software Development Company Profile Big Data Analytics Professional PDF to provide visual cues and insights. Share and navigate important information on four stages that need your due attention. This template can be used to pitch topics like Data Engineering, Database Management, Data Visualization. In addtion, this PPT design contains high resolution images, graphics, etc, that are easily editable and available for immediate download.
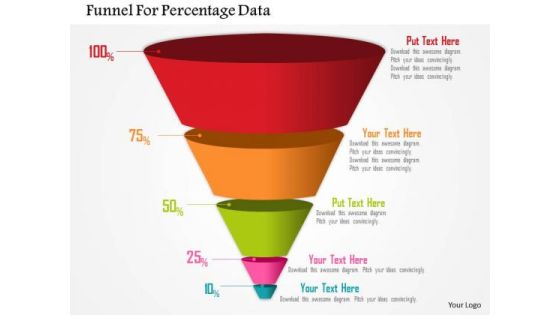
Business Diagram Funnel For Percentage Data Presentation Template
Four staged funnel diagram has been used to design this power point template. This diagram contains the concept of filtration. Present your views and ideas with this impressive image.

Smart Manufacturing Deployment Improve Production Procedures Digital Twins Model For Manufacturing Process Designs PDF
This slide represents digital twins model for manufacturing process. It includes sensors, data, integration, analytics, actuators, insights etc.Present like a pro with Smart Manufacturing Deployment Improve Production Procedures Digital Twins Model For Manufacturing Process Designs PDF Create beautiful presentations together with your team, using our easy-to-use presentation slides. Share your ideas in real-time and make changes on the fly by downloading our templates. So whether you are in the office, on the go, or in a remote location, you can stay in sync with your team and present your ideas with confidence. With Slidegeeks presentation got a whole lot easier. Grab these presentations today.

Kaizen Process Report With Improvement Metrics Ppt PowerPoint Presentation File Icons PDF
This slide focuses on the kaizen event report which covers process owner, key performance indicators, summary, problem description, improvement metrics, goals, daily milestones, team members and other considerations, etc. Pitch your topic with ease and precision using this Kaizen Process Report With Improvement Metrics Ppt PowerPoint Presentation File Icons PDF. This layout presents information on Key Performance Indoctrinator, Improvement Goal, Improvement Metric. It is also available for immediate download and adjustment. So, changes can be made in the color, design, graphics or any other component to create a unique layout.

Key Succession And Career Planning Metrics Ppt PowerPoint Presentation File Graphics Design
This is a key succession and career planning metrics ppt powerpoint presentation file graphics design. This is a two stage process. The stages in this process are marketing, business, management, planning, strategy.

Social Media Audit Chart With Post Details Ppt PowerPoint Presentation Gallery Graphics Pictures PDF
Showcasing this set of slides titled social media audit chart with post details ppt powerpoint presentation gallery graphics pictures pdf. The topics addressed in these templates are performance snapshot, findings, product. All the content presented in this PPT design is completely editable. Download it and make adjustments in color, background, font etc. as per your unique business setting.

Timeline For Successful Implementation Of Video Marketing Strategy Portrait PDF
The following slide outlines a comprehensive timeline which can be used for creating an engaging video content. The information covered in this slide is related to video marketing strategy, production and distribution channels. The Timeline For Successful Implementation Of Video Marketing Strategy Portrait PDF is a compilation of the most recent design trends as a series of slides. It is suitable for any subject or industry presentation, containing attractive visuals and photo spots for businesses to clearly express their messages. This template contains a variety of slides for the user to input data, such as structures to contrast two elements, bullet points, and slides for written information. Slidegeeks is prepared to create an impression.

Table Of Contents For Data Analytics Management Sample PDF
Presenting Table Of Contents For Data Analytics Management Sample PDF to provide visual cues and insights. Share and navigate important information on one stage that need your due attention. This template can be used to pitch topics like Management Company, Management Problems, Data Management. In addtion, this PPT design contains high resolution images, graphics, etc, that are easily editable and available for immediate download.
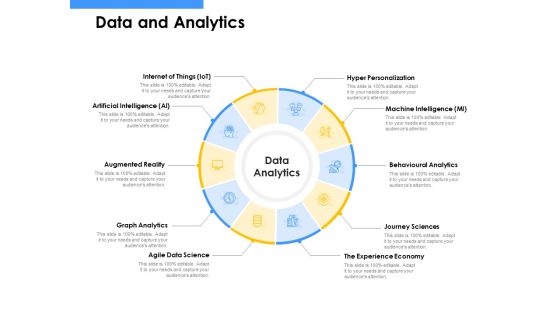
Employee Competency Matrix Data And Analytics Ppt Show Graphics PDF
Presenting employee competency matrix data and analytics ppt show graphics pdf to provide visual cues and insights. Share and navigate important information on ten stages that need your due attention. This template can be used to pitch topics like hyper personalization, machine intelligence, behavioural analytics, journey sciences, the experience economy, agile data science, internet of things. In addition, this PPT design contains high-resolution images, graphics, etc, that are easily editable and available for immediate download.

Data Analytics Team Cost Structure One Pager Sample Example Document
Presenting you an exemplary Data Analytics Team Cost Structure One Pager Sample Example Document. Our one-pager comprises all the must-have essentials of an inclusive document. You can edit it with ease, as its layout is completely editable. With such freedom, you can tweak its design and other elements to your requirements. Download this Data Analytics Team Cost Structure One Pager Sample Example Document brilliant piece now.

Financial Analytics Solution Investor Funding Elevator Pitch Deck Revenue Streams Elements PDF
This slide represents various revenue generation sources of global analytics marketplace. It includes revenue sources such as subscription plans, API access, Data licensing, and custom analytics. Coming up with a presentation necessitates that the majority of the effort goes into the content and the message you intend to convey. The visuals of a PowerPoint presentation can only be effective if it supplements and supports the story that is being told. Keeping this in mind our experts created Financial Analytics Solution Investor Funding Elevator Pitch Deck Revenue Streams Elements PDF to reduce the time that goes into designing the presentation. This way, you can concentrate on the message while our designers take care of providing you with the right template for the situation.
PowerPoint Designs Round Chart Business Ppt Presentation Designs
PowerPoint Designs Round Chart Business PPT Presentation Designs-Determine your targets and sequence them as per your priorities. Unravel each one for your audience while setting key timelines as you go along. Educate your listeners on the relevance and importance of each one as per your plan and how they all contribute as you strive to hit the Bullseye-PowerPoint Designs Round Chart Business PPT Presentation Designs-This ppt can be used for presentations relating to-3d, Angle, Arrow, Business, Chart, Circle, Complex, Concept, Data, Depth, Diagram, Dimensional, Financial, Graph, Graphic, Process
PowerPoint Slide Designs Round Chart Business Ppt Slide Designs
PowerPoint Slide Designs Round Chart Business PPT Slide Designs-Determine your targets and sequence them as per your priorities. Unravel each one for your audience while setting key timelines as you go along. Educate your listeners on the relevance and importance of each one as per your plan and how they all contribute as you strive to hit the Bullseye-PowerPoint Slide Designs Round Chart Business PPT Slide Designs-This ppt can be used for presentations relating to-3d, Angle, Arrow, Business, Chart, Circle, Complex, Concept, Data, Depth, Diagram, Dimensional, Financial, Graph, Graphic, Process

Factors Influencing Workforce Performance Strategy Ppt Infographics Graphics Pictures PDF
The purpose of this slide is to showcase the key factors for establishing proper workforce management systems. This includes effective work conditions, planning elements and human resource involvement. Persuade your audience using this Factors Influencing Workforce Performance Strategy Ppt Infographics Graphics Pictures PDF. This PPT design covers three stages, thus making it a great tool to use. It also caters to a variety of topics including Performance Plan, Building Elements, Involve Human Resource. Download this PPT design now to present a convincing pitch that not only emphasizes the topic but also showcases your presentation skills.

Six Step Data Analytic Strategy For Business Transformation Download PDF
This slide covers role of data analytics in six steps for transformation of business. It includes acquire customers, transform financial process, create business models, optimize operations, manage risks and maximise insights. Persuade your audience using this Six Step Data Analytic Strategy For Business Transformation Download PDF. This PPT design covers six stages, thus making it a great tool to use. It also caters to a variety of topics including Transform Financial Process, Acquire Customers, Create Business Models. Download this PPT design now to present a convincing pitch that not only emphasizes the topic but also showcases your presentation skills.

Big Tools For Data Analytics In Healthcare Background PDF
This slide showcase tools and its functions and benefits for big data analytics in healthcare. It includes tools such as Hadoop distributed file system, MapReduce, PIG and hive. Persuade your audience using this Big Tools For Data Analytics In Healthcare Background PDF. This PPT design covers Four stages, thus making it a great tool to use. It also caters to a variety of topics including Hadoop Distributed, File System, Map Reduce. Download this PPT design now to present a convincing pitch that not only emphasizes the topic but also showcases your presentation skills.
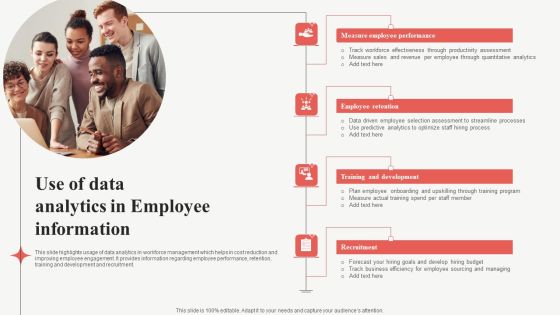
Use Of Data Analytics In Employee Information Graphics PDF
This slide highlights usage of data analytics in workforce management which helps in cost reduction and improving employee engagement. It provides information regarding employee performance, retention, training and development and recruitment. Persuade your audience using this Use Of Data Analytics In Employee Information Graphics PDF. This PPT design covers four stages, thus making it a great tool to use. It also caters to a variety of topics including Training And Development, Employee Retention, Measure Employee Performance. Download this PPT design now to present a convincing pitch that not only emphasizes the topic but also showcases your presentation skills.

Digital Content Marketing Techniques Checklist Introduction PDF
This slide shows online content marketing strategy audit checklist. It provides information about data collection, analytics, goals, inventory, videos, blogs, mobile view, search engine optimization SEO, content calendar, etc. Persuade your audience using this Digital Content Marketing Techniques Checklist Introduction PDF. This PPT design covers one stages, thus making it a great tool to use. It also caters to a variety of topics including Content Marketing Goals, Measurable, Team Prioritized Content. Download this PPT design now to present a convincing pitch that not only emphasizes the topic but also showcases your presentation skills.

Business Diagram Infographics Design With Five Options Presentation Template
Five staged info graphics has been used to craft this power point template diagram. This PPT diagram contains the concept of data flow and data technology. Use this PPT for business and data related presentations.
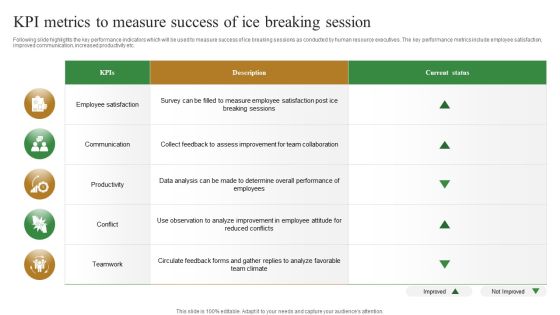
KPI Metrics To Measure Success Of Ice Breaking Session Microsoft PDF
Following slide highlights the key performance indicators which will be used to measure success of ice breaking sessions as conducted by human resource executives. The key performance metrics include employee satisfaction, improved communication, increased productivity etc. Showcasing this set of slides titled KPI Metrics To Measure Success Of Ice Breaking Session Microsoft PDF. The topics addressed in these templates are Communication, Productivity, Teamwork. All the content presented in this PPT design is completely editable. Download it and make adjustments in color, background, font etc. as per your unique business setting.

Predictive Analytics In The Age Of Big Data Roadmap For Predictive Analytics Model Development Ideas PDF
This slide represents the roadmap for predictive analytics model development, including the steps to be performed in the process, such as highlighting and formulating a problem, data preparation, information exploration, transforming and choosing, making, validating, and so on. Find a pre designed and impeccable Predictive Analytics In The Age Of Big Data Roadmap For Predictive Analytics Model Development Ideas PDF. The templates can ace your presentation without additional effort. You can download these easy to edit presentation templates to make your presentation stand out from others. So, what are you waiting for Download the template from Slidegeeks today and give a unique touch to your presentation.
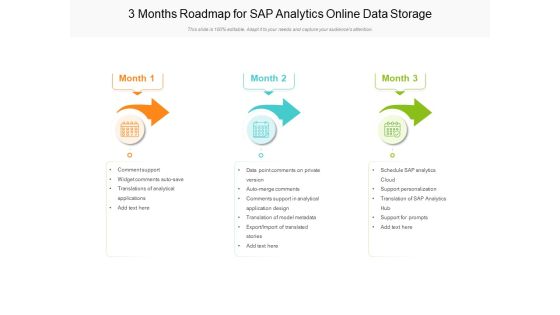
3 Months Roadmap For SAP Analytics Online Data Storage Guidelines
Presenting our jaw-dropping 3 months roadmap for sap analytics online data storage guidelines. You can alternate the color, font size, font type, and shapes of this PPT layout according to your strategic process. This PPT presentation is compatible with Google Slides and is available in both standard screen and widescreen aspect ratios. You can also download this well-researched PowerPoint template design in different formats like PDF, JPG, and PNG. So utilize this visually-appealing design by clicking the download button given below.

5 Year Roadmap For SAP Analytics Online Data Storage Professional
Presenting our jaw-dropping 5 year roadmap for sap analytics online data storage professional. You can alternate the color, font size, font type, and shapes of this PPT layout according to your strategic process. This PPT presentation is compatible with Google Slides and is available in both standard screen and widescreen aspect ratios. You can also download this well-researched PowerPoint template design in different formats like PDF, JPG, and PNG. So utilize this visually-appealing design by clicking the download button given below.

6 Months Roadmap For SAP Analytics Online Data Storage Information
Presenting our jaw-dropping 6 months roadmap for sap analytics online data storage information. You can alternate the color, font size, font type, and shapes of this PPT layout according to your strategic process. This PPT presentation is compatible with Google Slides and is available in both standard screen and widescreen aspect ratios. You can also download this well-researched PowerPoint template design in different formats like PDF, JPG, and PNG. So utilize this visually-appealing design by clicking the download button given below.

Half Yearly Roadmap For SAP Analytics Online Data Storage Pictures
Presenting our jaw-dropping half yearly roadmap for sap analytics online data storage pictures. You can alternate the color, font size, font type, and shapes of this PPT layout according to your strategic process. This PPT presentation is compatible with Google Slides and is available in both standard screen and widescreen aspect ratios. You can also download this well-researched PowerPoint template design in different formats like PDF, JPG, and PNG. So utilize this visually-appealing design by clicking the download button given below.
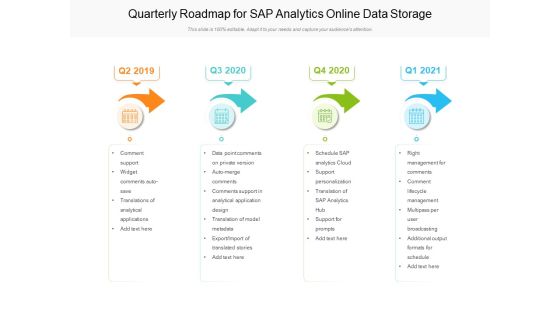
Quarterly Roadmap For SAP Analytics Online Data Storage Guidelines
Presenting our jaw-dropping quarterly roadmap for sap analytics online data storage guidelines. You can alternate the color, font size, font type, and shapes of this PPT layout according to your strategic process. This PPT presentation is compatible with Google Slides and is available in both standard screen and widescreen aspect ratios. You can also download this well-researched PowerPoint template design in different formats like PDF, JPG, and PNG. So utilize this visually-appealing design by clicking the download button given below.

Five Years Data Analytics Career Roadmap For Programmers Pictures
Introducing our five years data analytics career roadmap for programmers pictures. This PPT presentation is Google Slides compatible, therefore, you can share it easily with the collaborators for measuring the progress. Also, the presentation is available in both standard screen and widescreen aspect ratios. So edit the template design by modifying the font size, font type, color, and shapes as per your requirements. As this PPT design is fully editable it can be presented in PDF, JPG and PNG formats.

Half Yearly Data Analytics Career Roadmap For Programmers Demonstration
Introducing our half yearly data analytics career roadmap for programmers demonstration. This PPT presentation is Google Slides compatible, therefore, you can share it easily with the collaborators for measuring the progress. Also, the presentation is available in both standard screen and widescreen aspect ratios. So edit the template design by modifying the font size, font type, color, and shapes as per your requirements. As this PPT design is fully editable it can be presented in PDF, JPG and PNG formats.
Quarterly Data Analytics Career Roadmap For Programmers Icons
Introducing our quarterly data analytics career roadmap for programmers icons. This PPT presentation is Google Slides compatible, therefore, you can share it easily with the collaborators for measuring the progress. Also, the presentation is available in both standard screen and widescreen aspect ratios. So edit the template design by modifying the font size, font type, color, and shapes as per your requirements. As this PPT design is fully editable it can be presented in PDF, JPG and PNG formats.
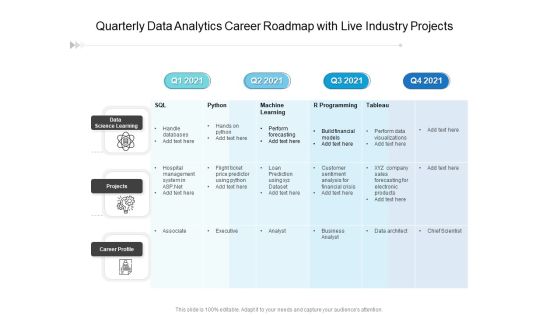
Quarterly Data Analytics Career Roadmap With Live Industry Projects Template
Presenting our jaw-dropping quarterly data analytics career roadmap with live industry projects template. You can alternate the color, font size, font type, and shapes of this PPT layout according to your strategic process. This PPT presentation is compatible with Google Slides and is available in both standard screen and widescreen aspect ratios. You can also download this well-researched PowerPoint template design in different formats like PDF, JPG, and PNG. So utilize this visually-appealing design by clicking the download button given below.
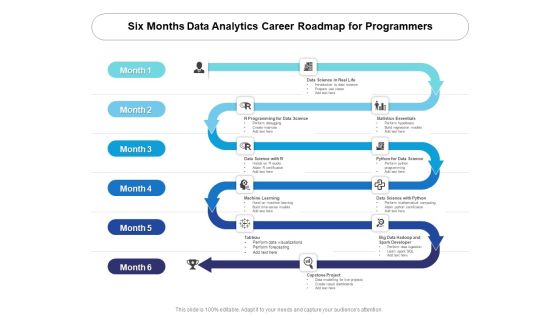
Six Months Data Analytics Career Roadmap For Programmers Demonstration
Introducing our six months data analytics career roadmap for programmers demonstration. This PPT presentation is Google Slides compatible, therefore, you can share it easily with the collaborators for measuring the progress. Also, the presentation is available in both standard screen and widescreen aspect ratios. So edit the template design by modifying the font size, font type, color, and shapes as per your requirements. As this PPT design is fully editable it can be presented in PDF, JPG and PNG formats.

Three Months Data Analytics Career Roadmap For Programmers Rules
Introducing our three months data analytics career roadmap for programmers rules. This PPT presentation is Google Slides compatible, therefore, you can share it easily with the collaborators for measuring the progress. Also, the presentation is available in both standard screen and widescreen aspect ratios. So edit the template design by modifying the font size, font type, color, and shapes as per your requirements. As this PPT design is fully editable it can be presented in PDF, JPG and PNG formats.

3 Months Roadmap For Data Analytics Technology Infographics
Presenting our jaw-dropping 3 months roadmap for data analytics technology infographics. You can alternate the color, font size, font type, and shapes of this PPT layout according to your strategic process. This PPT presentation is compatible with Google Slides and is available in both standard screen and widescreen aspect ratios. You can also download this well-researched PowerPoint template design in different formats like PDF, JPG, and PNG. So utilize this visually-appealing design by clicking the download button given below.
