Dashboard

Financial KPI Dashboard With Liquidity Ratio Analysis And Current Assets Breakdown Ideas PDF
This showcases KPI dashboard the can help organization to evaluate the financial performance and analyze the liquidity ratios. Its key components are vendor payment error rate, budget variance and cash conversion cycle. Showcasing this set of slides titled. The topics addressed in these templates are Quick Status, Workning Capital, Budget Variance. All the content presented in this PPT design is completely editable. Download it and make adjustments in color, background, font etc. as per your unique business setting.

Dashboard Showing Digital Marketing Performance Ppt PowerPoint Presentation File Model PDF
Slidegeeks is one of the best resources for PowerPoint templates. You can download easily and regulate Dashboard Showing Digital Marketing Performance Ppt PowerPoint Presentation File Model PDF for your personal presentations from our wonderful collection. A few clicks is all it takes to discover and get the most relevant and appropriate templates. Use our Templates to add a unique zing and appeal to your presentation and meetings. All the slides are easy to edit and you can use them even for advertisement purposes.

Sales Work Performance Monitoring Dashboard With Actual And Targets Introduction PDF
This slide elaborates about the performance of sales of an organization to know about the actual position of the firm. Showcasing this set of slides titled Sales Work Performance Monitoring Dashboard With Actual And Targets Introduction PDF. The topics addressed in these templates are Sales Realization, Team Monthly, Performance. All the content presented in this PPT design is completely editable. Download it and make adjustments in color, background, font etc. as per your unique business setting.

Dashboard Of India Country Profile Statistics Ppt Ideas Format Ideas PDF
Persuade your audience using this Dashboard Of India Country Profile Statistics Ppt Ideas Format Ideas PDF. This PPT design covers one stages, thus making it a great tool to use. It also caters to a variety of topics including Human Development Index, Global Ghg Emissions, GDP Per Capita. Download this PPT design now to present a convincing pitch that not only emphasizes the topic but also showcases your presentation skills.

Brazil Country Profile Statistics Dashboard With GDP Per Capita Mockup PDF
Persuade your audience using this Brazil Country Profile Statistics Dashboard With GDP Per Capita Mockup PDF. This PPT design covers one stages, thus making it a great tool to use. It also caters to a variety of topics including Global Ghg Emissions, Human Development Index, GDP Per Capita. Download this PPT design now to present a convincing pitch that not only emphasizes the topic but also showcases your presentation skills.

Online Business Simulation Activity Dashboard With Quarterly Performance Details Guidelines PDF
This slide shows business simulation tasks with performance information. It provides information about financial and production advisor comments, revenue, rivals, profit, strategies, etc. Pitch your topic with ease and precision using this Online Business Simulation Activity Dashboard With Quarterly Performance Details Guidelines PDF. This layout presents information on Financial Adviser, Production Adviser, Revenue. It is also available for immediate download and adjustment. So, changes can be made in the color, design, graphics or any other component to create a unique layout.

Security Control Techniques For Real Estate Project Dashboard To Monitor Construction Site Injuries Diagrams PDF
The best PPT templates are a great way to save time, energy, and resources. Slidegeeks have 100 percent editable powerpoint slides making them incredibly versatile. With these quality presentation templates, you can create a captivating and memorable presentation by combining visually appealing slides and effectively communicating your message. Download Security Control Techniques For Real Estate Project Dashboard To Monitor Construction Site Injuries Diagrams PDF from Slidegeeks and deliver a wonderful presentation.

Employee Performance Management To Enhance Organizational Growth KPI Dashboard To Assess Training Diagrams PDF
The best PPT templates are a great way to save time, energy, and resources. Slidegeeks have 100 percent editable powerpoint slides making them incredibly versatile. With these quality presentation templates, you can create a captivating and memorable presentation by combining visually appealing slides and effectively communicating your message. Download Employee Performance Management To Enhance Organizational Growth KPI Dashboard To Assess Training Diagrams PDF from Slidegeeks and deliver a wonderful presentation.
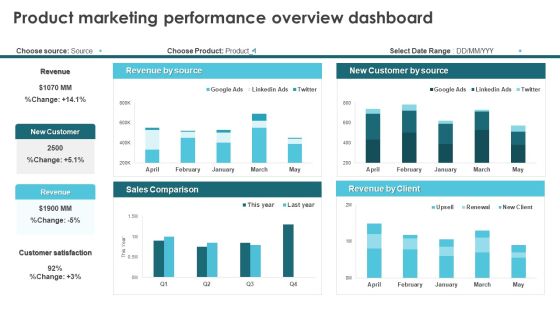
Product Marketing For Generating Product Marketing Performance Overview Dashboard Template PDF
Present like a pro with Product Marketing For Generating Product Marketing Performance Overview Dashboard Template PDF Create beautiful presentations together with your team, using our easy-to-use presentation slides. Share your ideas in real-time and make changes on the fly by downloading our templates. So whether youre in the office, on the go, or in a remote location, you can stay in sync with your team and present your ideas with confidence. With Slidegeeks presentation got a whole lot easier. Grab these presentations today.

Multi Cloud Infrastructure Management Cost Management Dashboard In Cloud Management Structure PDF
Boost your pitch with our creative Multi Cloud Infrastructure Management Cost Management Dashboard In Cloud Management Structure PDF. Deliver an awe-inspiring pitch that will mesmerize everyone. Using these presentation templates you will surely catch everyones attention. You can browse the ppts collection on our website. We have researchers who are experts at creating the right content for the templates. So you dont have to invest time in any additional work. Just grab the template now and use them.
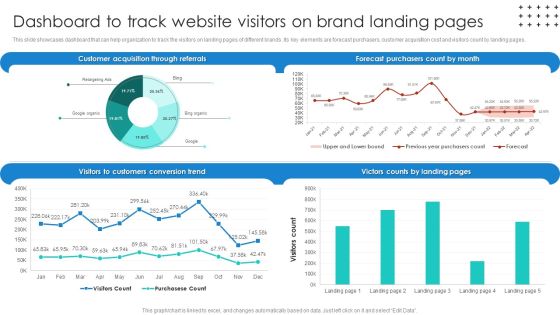
Promotional Techniques To Market Several Brands Among Target Groups Dashboard To Track Topics PDF
Want to ace your presentation in front of a live audience. Our Promotional Techniques To Market Several Brands Among Target Groups Dashboard To Track Topics PDF can help you do that by engaging all the users towards you.. Slidegeeks experts have put their efforts and expertise into creating these impeccable powerpoint presentations so that you can communicate your ideas clearly. Moreover, all the templates are customizable, and easy-to-edit and downloadable. Use these for both personal and commercial use.
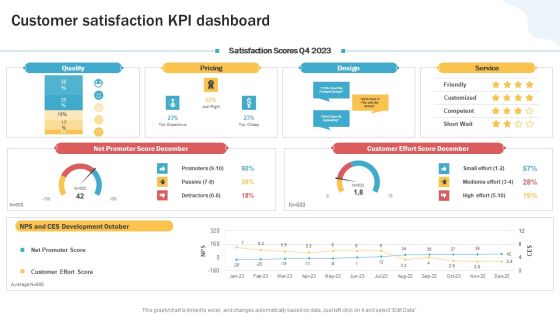
Developing Personal Brand On Social Media Channels Customer Satisfaction Kpi Dashboard Designs PDF
Make sure to capture your audiences attention in your business displays with our gratis customizable Developing Personal Brand On Social Media Channels Customer Satisfaction Kpi Dashboard Designs PDF. These are great for business strategies, office conferences, capital raising or task suggestions. If you desire to acquire more customers for your tech business and ensure they stay satisfied, create your own sales presentation with these plain slides.
Progress Summary Dashboard For Tracking Project Health And Timeline Icons PDF
The following slide showcases business progress report for work completion status. It presents information related to task status, health, testing, budget, etc. Showcasing this set of slides titled Progress Summary Dashboard For Tracking Project Health And Timeline Icons PDF. The topics addressed in these templates are Project Progress, Budget, Project Timeline. All the content presented in this PPT design is completely editable. Download it and make adjustments in color, background, font etc. as per your unique business setting.

Customer Relationship Management And Daily Payments Dashboard With Top Reviews Professional PDF
This slide illustrates graphical representation of customer relationship management figures. It includes revenue, daily payments graph and top products etc. Showcasing this set of slides titled Customer Relationship Management And Daily Payments Dashboard With Top Reviews Professional PDF. The topics addressed in these templates are Quality Product, Services, Revenue. All the content presented in this PPT design is completely editable. Download it and make adjustments in color, background, font etc. as per your unique business setting.

Customer Relationship Management Dashboard With Sales And Profit Summary Microsoft PDF
This slide illustrates graphical representation of sales and profit figures. It includes sales summary, revenue vs. expenditure graph and ticket record etc. Showcasing this set of slides titled Customer Relationship Management Dashboard With Sales And Profit Summary Microsoft PDF. The topics addressed in these templates are Product Catalogue, Sales, Profit. All the content presented in this PPT design is completely editable. Download it and make adjustments in color, background, font etc. as per your unique business setting.

Efficient Product Marketing Techniques Dashboard Showing Digital Marketing Performance Slides PDF
Slidegeeks is one of the best resources for PowerPoint templates. You can download easily and regulate Efficient Product Marketing Techniques Dashboard Showing Digital Marketing Performance Slides PDF for your personal presentations from our wonderful collection. A few clicks is all it takes to discover and get the most relevant and appropriate templates. Use our Templates to add a unique zing and appeal to your presentation and meetings. All the slides are easy to edit and you can use them even for advertisement purposes.

Quarterly Sales Performance Of Business Dashboard With Region And Product Wise Comparison Guidelines PDF
This slide displays sales analysis for different products and regions in each quarter. t also includes inter year comparisons. Pitch your topic with ease and precision using this Quarterly Sales Performance Of Business Dashboard With Region And Product Wise Comparison Guidelines PDF. This layout presents information on Product Wise Quarterly Sales, Comparison. It is also available for immediate download and adjustment. So, changes can be made in the color, design, graphics or any other component to create a unique layout.
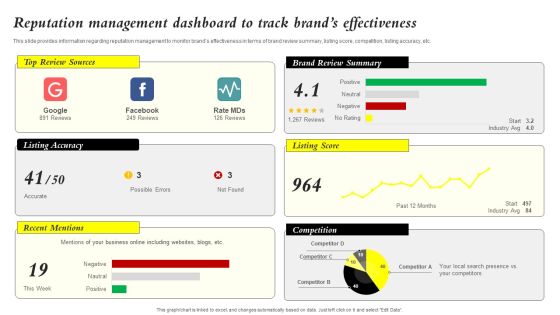
Core Components Of Strategic Brand Administration Reputation Management Dashboard Download PDF
This slide provides information regarding reputation management to monitor brands effectiveness in terms of brand review summary, listing score, competition, listing accuracy, etc. There are so many reasons you need a Core Components Of Strategic Brand Administration Reputation Management Dashboard Download PDF. The first reason is you can not spend time making everything from scratch, Thus, Slidegeeks has made presentation templates for you too. You can easily download these templates from our website easily.

Software Project Portfolio Management Dashboard With Budget And Costs Structure PDF
The following slide illustrates the project portfolio management software which showcases allocated budget and used budget with estimated and actual costs. Showcasing this set of slides titled Software Project Portfolio Management Dashboard With Budget And Costs Structure PDF. The topics addressed in these templates are Allocated Budget, Used Budget, Used Budget Percentage. All the content presented in this PPT design is completely editable. Download it and make adjustments in color, background, font etc. as per your unique business setting.

Project Progress Kpi Dashboard To Meet Roll Out Date Themes PDF
The following slide highlights the KPI of project to manage and meet launch date. It includes elements such as percentage of project completed, time left etc. Showcasing this set of slides titled Project Progress Kpi Dashboard To Meet Roll Out Date Themes PDF. The topics addressed in these templates are Legend, Nicole, Maria. All the content presented in this PPT design is completely editable. Download it and make adjustments in color, background, font etc. as per your unique business setting.
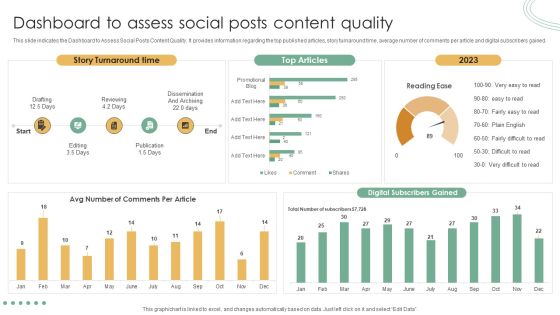
Online Marketing Techniques Assessment Approach Dashboard To Assess Social Posts Content Quality Information PDF
Take your projects to the next level with our ultimate collection of Online Marketing Techniques Assessment Approach Dashboard To Assess Social Posts Content Quality Information PDF. Slidegeeks has designed a range of layouts that are perfect for representing task or activity duration, keeping track of all your deadlines at a glance. Tailor these designs to your exact needs and give them a truly corporate look with your own brand colors they will make your projects stand out from the rest.

Brand Recognition Overview Dashboard To Track Brand Awareness Across Social Media Channels Introduction PDF
This slide provides information regarding brand awareness performance across various social media channels in terms of page reach, post impressions, etc. There are so many reasons you need a Brand Recognition Overview Dashboard To Track Brand Awareness Across Social Media Channels Introduction PDF. The first reason is you can not spend time making everything from scratch, Thus, Slidegeeks has made presentation templates for you too. You can easily download these templates from our website easily.

Supplier Planning Dashboard Highlighting Compliance Stats With Procurement Time Topics PDF
From laying roadmaps to briefing everything in detail, our templates are perfect for you. You can set the stage with your presentation slides. All you have to do is download these easy to edit and customizable templates. Supplier Planning Dashboard Highlighting Compliance Stats With Procurement Time Topics PDF will help you deliver an outstanding performance that everyone would remember and praise you for. Do download this presentation today.
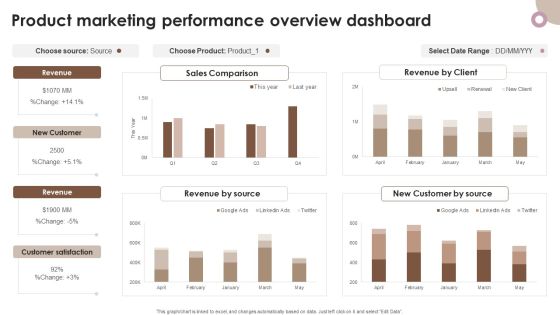
Strategic Components Of Product Advertising Product Marketing Performance Overview Dashboard Pictures PDF
The best PPT templates are a great way to save time, energy, and resources. Slidegeeks have 100 percent editable powerpoint slides making them incredibly versatile. With these quality presentation templates, you can create a captivating and memorable presentation by combining visually appealing slides and effectively communicating your message. Download Strategic Components Of Product Advertising Product Marketing Performance Overview Dashboard Pictures PDF from Slidegeeks and deliver a wonderful presentation.

Market Research Assessment Of Target Market Requirements Kpi Dashboard To Analyze Customer Satisfaction Pictures PDF
The following slide outlines a comprehensive visual representation of customer satisfaction CSAT that can assist companies to measure how happy are customers wit the brand. The KPIs covered are net promoter score NPS, customer effort score CES, product quality, pricing, etc. Presenting this PowerPoint presentation, titled Market Research Assessment Of Target Market Requirements Kpi Dashboard To Analyze Customer Satisfaction Pictures PDF, with topics curated by our researchers after extensive research. This editable presentation is available for immediate download and provides attractive features when used. Download now and captivate your audience. Presenting this Market Research Assessment Of Target Market Requirements Kpi Dashboard To Analyze Customer Satisfaction Pictures PDF. Our researchers have carefully researched and created these slides with all aspects taken into consideration. This is a completely customizable Market Research Assessment Of Target Market Requirements Kpi Dashboard To Analyze Customer Satisfaction Pictures PDF that is available for immediate downloading. Download now and make an impact on your audience. Highlight the attractive features available with our PPTs.

Firm Marketing Dashboard Report With Closed Sales Ppt Slides Graphics Example PDF
This graph or chart is linked to excel, and changes automatically based on data. Just left click on it and select Edit Data. Showcasing this set of slides titled Firm Marketing Dashboard Report With Closed Sales Ppt Slides Graphics Example PDF. The topics addressed in these templates are Days On Market, Homes For Sale, Median Sales Price, Closed Sales. All the content presented in this PPT design is completely editable. Download it and make adjustments in color, background, font etc. as per your unique business setting.
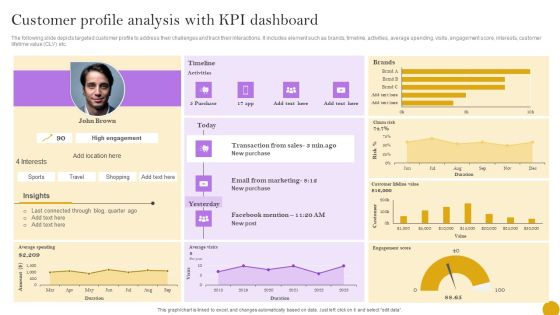
Comprehensive Customer Data Platform Guide Optimizing Promotional Initiatives Customer Profile Analysis KPI Dashboard Pictures PDF
The following slide depicts targeted customer profile to address their challenges and track their interactions. It includes element such as brands, timeline, activities, average spending, visits, engagement score, interests, customer lifetime value CLV etc. The best PPT templates are a great way to save time, energy, and resources. Slidegeeks have 100 percent editable powerpoint slides making them incredibly versatile. With these quality presentation templates, you can create a captivating and memorable presentation by combining visually appealing slides and effectively communicating your message. Download Comprehensive Customer Data Platform Guide Optimizing Promotional Initiatives Customer Profile Analysis KPI Dashboard Pictures PDF from Slidegeeks and deliver a wonderful presentation.

Product Marketing For Generating Product Marketing Dashboard With Sales Trend Designs PDF
This graph or chart is linked to excel, and changes automatically based on data. Just left click on it and select Edit Data. From laying roadmaps to briefing everything in detail, our templates are perfect for you. You can set the stage with your presentation slides. All you have to do is download these easy-to-edit and customizable templates. Product Marketing For Generating Product Marketing Dashboard With Sales Trend Designs PDF will help you deliver an outstanding performance that everyone would remember and praise you for. Do download this presentation today.

Budget Analysis Dashboard With Actual And Forecasted Revenue Comparison Structure PDF
This slide displays the budget analysis report comparing the budget with the actual year to date data. It also helps in making estimations for the remaining year. It includes variance between budgeted and actual gross margin results, service revenue, profit margin, product revenue, payroll cost, etc. Pitch your topic with ease and precision using this Budget Analysis Dashboard With Actual And Forecasted Revenue Comparison Structure PDF. This layout presents information on Payroll Cost, Budget Revenue Components, Product Revenue. It is also available for immediate download and adjustment. So, changes can be made in the color, design, graphics or any other component to create a unique layout.

Cybersecurity Threat Status In Project Management Dashboard With Reported Incidents Introduction PDF
This slide represents open and closed cybersecurity risk incidents in areas such as 2 factor authentication, daily backup data etc. Showcasing this set of slides titled cybersecurity threat status in project management dashboard with reported incidents introduction pdf. The topics addressed in these templates are application control, application patch, operating system patch, restricted admin privileges, untrusted application alert. All the content presented in this PPT design is completely editable. Download it and make adjustments in color, background, font etc. as per your unique business setting.

Project Data Quality Kpis Metrics Summary Dashboard With Threshold Guidelines PDF
This slide covers different KPIs to measure performance of data quality for project completion. It includes metric such as consistency, completeness, orderliness, timeliness, accuracy, auditability and uniqueness with thresholds. Pitch your topic with ease and precision using this Project Data Quality Kpis Metrics Summary Dashboard With Threshold Guidelines PDF. This layout presents information on Consistency, Completeness, Orderliness. It is also available for immediate download and adjustment. So, changes can be made in the color, design, graphics or any other component to create a unique layout.

Marketing Strategy For Shipping Business Key Performance Indicator Dashboard Graphics PDF
The following slide depicts the key areas in Marketing Strategy for Shipping Business to monitor and optimize supply chain processes. It includes elements such as fleet and shipment status, country wise revenue, location wise delivery, average shipment time etc.Pitch your topic with ease and precision using this Marketing Strategy For Shipping Business Key Performance Indicator Dashboard Graphics PDF. This layout presents information on Shipment Status, Average Shipment, Wise Revenue. It is also available for immediate download and adjustment. So, changes can be made in the color, design, graphics or any other component to create a unique layout.
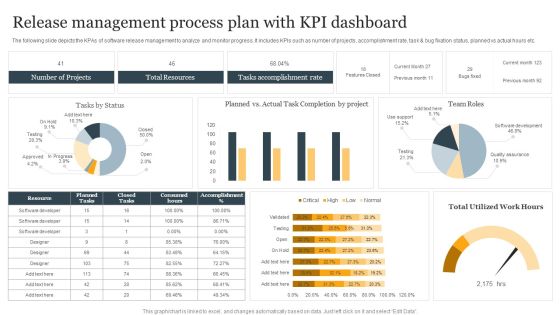
Release Management Process Plan With KPI Dashboard Ppt Infographic Template Structure PDF
The following slide depicts the KPAs of software release management to analyze and monitor progress. It includes KPIs such as number of projects, accomplishment rate, task and bug fixation status, planned vs actual hours etc. Showcasing this set of slides titled Release Management Process Plan With KPI Dashboard Ppt Infographic Template Structure PDF. The topics addressed in these templates are Number Of Projects, Total Resources, Tasks Accomplishment Rate. All the content presented in this PPT design is completely editable. Download it and make adjustments in color, background, font etc. as per your unique business setting.
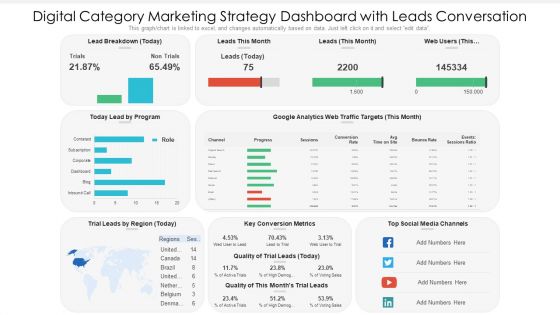
Digital Category Marketing Strategy Dashboard With Leads Conversation Ppt PowerPoint Presentation Slides Information PDF
This graph chart is linked to excel, and changes automatically based on data. Just left click on it and select edit data. Pitch your topic with ease and precision using this digital category marketing strategy dashboard with leads conversation ppt powerpoint presentation slides information pdf. This layout presents information on key conversion metrics, social media channels, lead by program. It is also available for immediate download and adjustment. So, changes can be made in the color, design, graphics or any other component to create a unique layout.
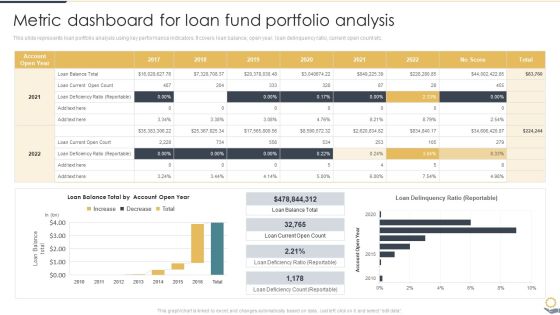
Metric Dashboard For Loan Fund Portfolio Analysis Portfolio Investment Analysis Formats PDF
This slide represents loan portfolio analysis using key performance indicators. It covers loan balance, open year, loan delinquency ratio, current open count etc.From laying roadmaps to briefing everything in detail, our templates are perfect for you. You can set the stage with your presentation slides. All you have to do is download these easy-to-edit and customizable templates. Metric Dashboard For Loan Fund Portfolio Analysis Portfolio Investment Analysis Formats PDF will help you deliver an outstanding performance that everyone would remember and praise you for. Do download this presentation today.
Education Metrics Dashboard For Tracking Student Ethnicity And Specially Abled Characteristics Brochure PDF
This slide covers the education key performance indicator tracker. It include metrics such as total applications, conversion rate, offers year to date, applications by ethnicity and disabilities, etc. Showcasing this set of slides titled Education Metrics Dashboard For Tracking Student Ethnicity And Specially Abled Characteristics Brochure PDF. The topics addressed in these templates are Total Applications, Conversion Rate 2022, Ethnicity. All the content presented in this PPT design is completely editable. Download it and make adjustments in color, background, font etc. as per your unique business setting.
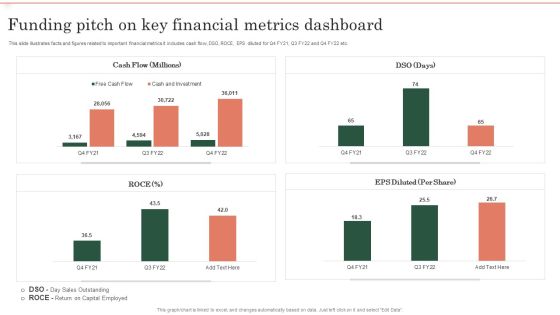
Funding Pitch On Key Financial Metrics Dashboard Ppt Ideas Deck PDF
This slide illustrates facts and figures related to important financial metrics It includes cash flow, DSO, ROCE, EPS diluted for Q4 FY21, Q3 FY22 and Q4 FY22 etc. Showcasing this set of slides titled Funding Pitch On Key Financial Metrics Dashboard Ppt Ideas Deck PDF. The topics addressed in these templates are Cash Flow, EPS Diluted, ROCE. All the content presented in this PPT design is completely editable. Download it and make adjustments in color, background, font etc. as per your unique business setting.

KPI Dashboard To Track Automation Performance In Employee Onboarding Introduction PDF
The following slide outlines performance key performance indicator KPI which can be used to evaluate business process automation performance in employee onboarding. The metrics highlighted in the slide are onboarding completion status, hires per office, etc. Deliver an awe inspiring pitch with this creative KPI Dashboard To Track Automation Performance In Employee Onboarding Introduction PDF bundle. Topics like Onboarding Completion Status, Onboardings In Progress, Employee Onboarding can be discussed with this completely editable template. It is available for immediate download depending on the needs and requirements of the user.

KPI Dashboard To Track Automation Performance In Employee Onboarding Achieving Operational Efficiency Download PDF
The following slide outlines performance key performance indicator KPI which can be used to evaluate business process automation performance in employee onboarding. The metrics highlighted in the slide are onboarding completion status, hires per office, etc.Deliver an awe inspiring pitch with this creative KPI Dashboard To Track Automation Performance In Employee Onboarding Achieving Operational Efficiency Download PDF bundle. Topics like Onboarding Completion, Onboarding, Onboarding Completion can be discussed with this completely editable template. It is available for immediate download depending on the needs and requirements of the user.
Implementing Digital Transformation Performance Tracking Kpi Dashboard For Digital Background PDF
Mentioned slide provides information about the key performance indicators that can be used by managers to measure the success of digital marketing strategy, KPIs covered are status, progress, priority and timeline. Boost your pitch with our creative Implementing Digital Transformation Performance Tracking Kpi Dashboard For Digital Background PDF. Deliver an awe-inspiring pitch that will mesmerize everyone. Using these presentation templates you will surely catch everyones attention. You can browse the ppts collection on our website. We have researchers who are experts at creating the right content for the templates. So you dont have to invest time in any additional work. Just grab the template now and use them.

Product And Services Promotion Marketing Performance Dashboard With Advertisement Graphics PDF
This graph or chart is linked to excel, and changes automatically based on data. Just left click on it and select Edit Data. Slidegeeks is here to make your presentations a breeze with Product And Services Promotion Marketing Performance Dashboard With Advertisement Graphics PDF With our easy-to-use and customizable templates, you can focus on delivering your ideas rather than worrying about formatting. With a variety of designs to choose from, youre sure to find one that suits your needs. And with animations and unique photos, illustrations, and fonts, you can make your presentation pop. So whether youre giving a sales pitch or presenting to the board, make sure to check out Slidegeeks first.
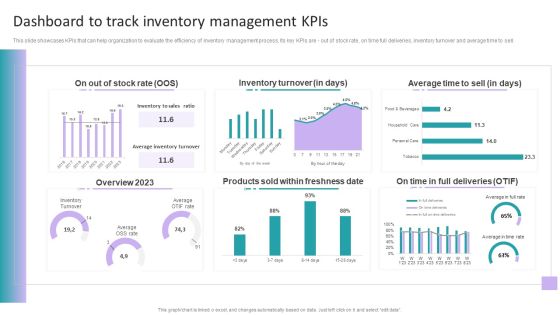
Stock Inventory Acquisition Dashboard To Track Inventory Management Kpis Themes PDF
This slide showcases KPIs that can help organization to evaluate the efficiency of inventory management process. Its key KPIs are - out of stock rate, on time full deliveries, inventory turnover and average time to sell. The best PPT templates are a great way to save time, energy, and resources. Slidegeeks have 100 percent editable powerpoint slides making them incredibly versatile. With these quality presentation templates, you can create a captivating and memorable presentation by combining visually appealing slides and effectively communicating your message. Download Stock Inventory Acquisition Dashboard To Track Inventory Management Kpis Themes PDF from Slidegeeks and deliver a wonderful presentation.
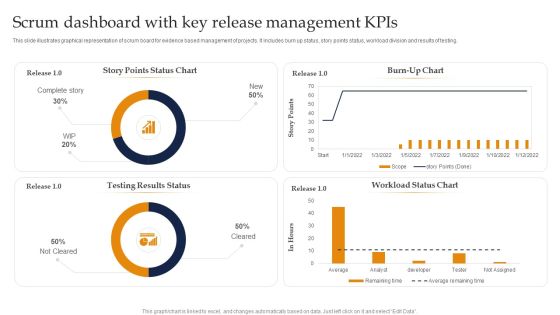
Scrum Dashboard With Key Release Management Kpis Ppt Summary Vector PDF
This slide illustrates graphical representation of scrum board for evidence based management of projects. It includes burn up status, story points status, workload division and results of testing. Showcasing this set of slides titled Scrum Dashboard With Key Release Management Kpis Ppt Summary Vector PDF. The topics addressed in these templates are Burn Up Chart, Workload Status Chart, Testing Results Status. All the content presented in this PPT design is completely editable. Download it and make adjustments in color, background, font etc. as per your unique business setting.
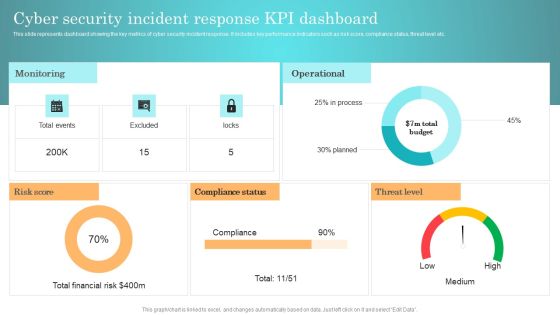
Incident Response Techniques Deployement Cyber Security Incident Response KPI Dashboard Background PDF
This slide represents dashboard showing the key metrics of cyber security incident response. It includes key performance indicators such as risk score, compliance status, threat level etc. From laying roadmaps to briefing everything in detail, our templates are perfect for you. You can set the stage with your presentation slides. All you have to do is download these easy to edit and customizable templates. Incident Response Techniques Deployement Cyber Security Incident Handler Contact Information Guidelines PDF will help you deliver an outstanding performance that everyone would remember and praise you for. Do download this presentation today.

Dashboard Showing Digital Marketing Campaign Report Ppt Infographic Template Template PDF
This slide represents the campaign report of digital marketing which includes total spend , impressions , clicks , acquisitions, cost per action that results in analyzing marketing efforts to improve market share of business. Pitch your topic with ease and precision using this Dashboard Showing Digital Marketing Campaign Report Ppt Infographic Template Template PDF. This layout presents information on Customer Acquisition, Total Impressions, Total Clicks, Total Acquisition. It is also available for immediate download and adjustment. So, changes can be made in the color, design, graphics or any other component to create a unique layout.

Cloud Performance Tracking Dashboard Cloud Computing Complexities And Solutions Structure PDF
This slide covers the Key performance indicators for tracking performance of the cloud such as violations break down, sources, rules and severity. Are you searching for a xxxxxxxxxxxxxxxxxxxxxx that is uncluttered, straightforward, and original Its easy to edit, and you can change the colors to suit your personal or business branding. For a presentation that expresses how much effort you ve put in, this template is ideal With all of its features, including tables, diagrams, statistics, and lists, its perfect for a business plan presentation. Make your ideas more appealing with these professional slides. Download Cloud Performance Tracking Dashboard Cloud Computing Complexities And Solutions Structure PDF from Slidegeeks today.
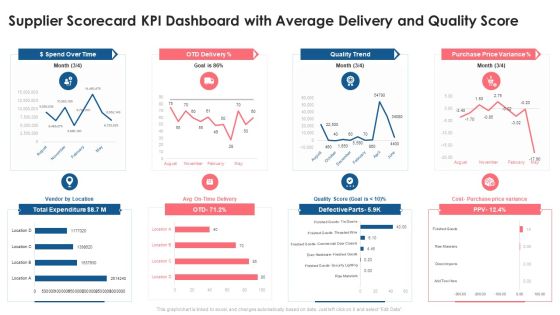
Supplier Scorecard Supplier Scorecard KPI Dashboard With Average Delivery And Quality Score Introduction PDF
This graph or chart is linked to excel, and changes automatically based on data. Just left click on it and select Edit Data. Deliver an awe inspiring pitch with this creative supplier scorecard supplier scorecard kpi dashboard with average delivery and quality score introduction pdf bundle. Topics like dollar spend over time, otd delivery, quality trend, purchase price variance, total expenditure can be discussed with this completely editable template. It is available for immediate download depending on the needs and requirements of the user.

Finance Metrics Dashboard Indicating Account Receivable And Account Payable Demonstration PDF
This graph or chart is linked to excel, and changes automatically based on data. Just left click on it and select edit data. Showcasing this set of slides titled Finance Metrics Dashboard Indicating Account Receivable And Account Payable Demonstration PDF. The topics addressed in these templates are Total Accounts Receivable, Total Accounts Payable, Recommended Payment Timeline, Monthly Cash Flow. All the content presented in this PPT design is completely editable. Download it and make adjustments in color, background, font etc. as per your unique business setting.

Client Helpline Dashboard At Valet Information Dsk Ppt Gallery Slide Portrait PDF
This graph or chart is linked to excel, and changes automatically based on data. Just left click on it and select Edit Data. Pitch your topic with ease and precision using this Client Helpline Dashboard At Valet Information Dsk Ppt Gallery Slide Portrait PDF. This layout presents information on Valet Damage Claims, Valet Wait Times, Information Desk. It is also available for immediate download and adjustment. So, changes can be made in the color, design, graphics or any other component to create a unique layout.

Firm KPI Dashboard With Average Click Through Rate Ppt Inspiration Sample PDF
This graph or chart is linked to excel, and changes automatically based on data. Just left click on it and select Edit Data. Pitch your topic with ease and precision using this Firm KPI Dashboard With Average Click Through Rate Ppt Inspiration Sample PDF. This layout presents information on Total Clicks, Total Impressive, Average CTR, Average Position. It is also available for immediate download and adjustment. So, changes can be made in the color, design, graphics or any other component to create a unique layout.

Firm KPI Dashboard With Schedule Performance Index Ppt Visual Aids PDF
This graph or chart is linked to excel, and changes automatically based on data. Just left click on it and select Edit Data. Pitch your topic with ease and precision using this Firm KPI Dashboard With Schedule Performance Index Ppt Visual Aids PDF. This layout presents information on Project Cost Performance, Project Planning Stage, Monitor And Control. It is also available for immediate download and adjustment. So, changes can be made in the color, design, graphics or any other component to create a unique layout.

Service Level Agreement KPI Dashboard Indicating Violation Count And Overdue Requests Diagrams PDF
This graph or chart is linked to excel, and changes automatically based on data. Just left click on it and select Edit Data. Showcasing this set of slides titled Service Level Agreement KPI Dashboard Indicating Violation Count And Overdue Requests Diagrams PDF. The topics addressed in these templates are Total Requests Category, Total Requests Status, Urgent Requests. All the content presented in this PPT design is completely editable. Download it and make adjustments in color, background, font etc. as per your unique business setting.

Service Level Agreement KPI Dashboard With Current Risk Statistics Topics PDF
This graph or chart is linked to excel, and changes automatically based on data. Just left click on it and select Edit Data. Pitch your topic with ease and precision using this Service Level Agreement KPI Dashboard With Current Risk Statistics Topics PDF. This layout presents information on Current Risk SLAS, Current Breached Slas, Personal Active SLA It is also available for immediate download and adjustment. So, changes can be made in the color, design, graphics or any other component to create a unique layout.

Company Financial Performance Indicators Dashboard With Liquidity And Turnover Ratios Formats PDF
This graph or chart is linked to excel, and changes automatically based on data. Just left click on it and select Edit Data. Pitch your topic with ease and precision using this Company Financial Performance Indicators Dashboard With Liquidity And Turnover Ratios Formats PDF. This layout presents information on Cash Balance, Days Inventory Outstanding, Days Payable Outstanding. It is also available for immediate download and adjustment. So, changes can be made in the color, design, graphics or any other component to create a unique layout.
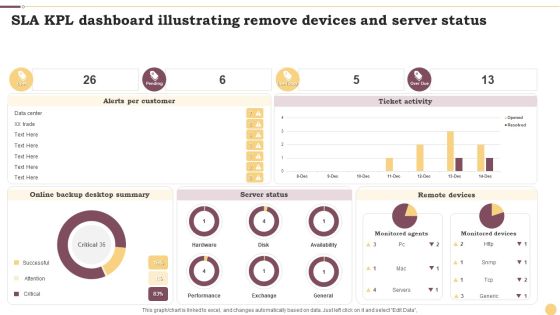
SLA KPL Dashboard Illustrating Remove Devices And Server Status Ppt Inspiration Layout Ideas PDF
This graph or chart is linked to excel, and changes automatically based on data. Just left click on it and select Edit Data. Showcasing this set of slides titled SLA KPL Dashboard Illustrating Remove Devices And Server Status Ppt Inspiration Layout Ideas PDF. The topics addressed in these templates are Alerts Per Customer, Ticket Activity, Server Status. All the content presented in this PPT design is completely editable. Download it and make adjustments in color, background, font etc. as per your unique business setting.

SLA KPL Dashboard Illustrating Risk And Active Services Ppt Portfolio Design Inspiration PDF
This graph or chart is linked to excel, and changes automatically based on data. Just left click on it and select Edit Data. Pitch your topic with ease and precision using this SLA KPL Dashboard Illustrating Risk And Active Services Ppt Portfolio Design Inspiration PDF. This layout presents information on My Active SLAs, Database Group, Priority. It is also available for immediate download and adjustment. So, changes can be made in the color, design, graphics or any other component to create a unique layout.
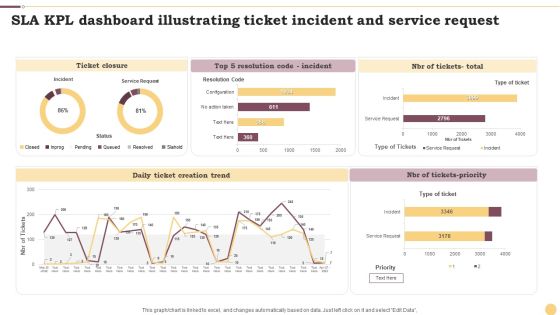
SLA KPL Dashboard Illustrating Ticket Incident And Service Request Ppt File Portrait PDF
This graph or chart is linked to excel, and changes automatically based on data. Just left click on it and select Edit Data. Showcasing this set of slides titled SLA KPL Dashboard Illustrating Ticket Incident And Service Request Ppt File Portrait PDF. The topics addressed in these templates are Ticket Closure, Daily Ticket, Creation Trend, NBR Tickets Priority. All the content presented in this PPT design is completely editable. Download it and make adjustments in color, background, font etc. as per your unique business setting.
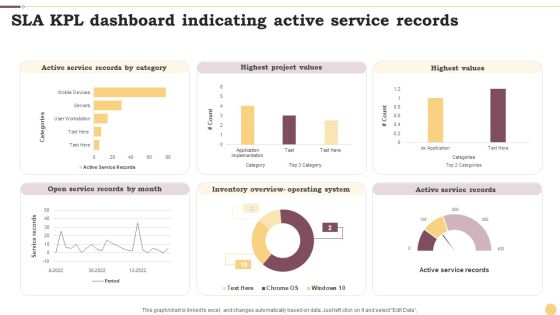
SLA KPL Dashboard Indicating Active Service Records Ppt Professional Graphics Example PDF
This graph or chart is linked to excel, and changes automatically based on data. Just left click on it and select Edit Data. Pitch your topic with ease and precision using this SLA KPL Dashboard Indicating Active Service Records Ppt Professional Graphics Example PDF. This layout presents information on Active Service Records, Highest Project Values, Highest Values. It is also available for immediate download and adjustment. So, changes can be made in the color, design, graphics or any other component to create a unique layout.
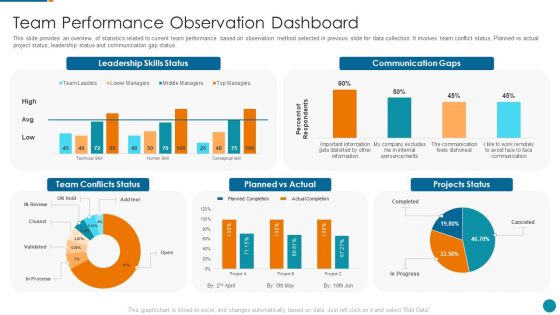
Strategic Procedure To Improve Employee Efficiency Team Performance Observation Dashboard Formats PDF
This slide provides an overview of statistics related to current team performance based on observation method selected in previous slide for data collection. It involves team conflict status, Planned vs actual project status, leadership status and communication gap status.Deliver an awe inspiring pitch with this creative strategic procedure to improve employee efficiency team performance observation dashboard formats pdf bundle. Topics like leadership skills status, communication gaps, planned vs actual can be discussed with this completely editable template. It is available for immediate download depending on the needs and requirements of the user.

Website And Social Media Digital Audit Dashboard Highlighting Website Visitors With Device Rules PDF
This slide highlights the website visitors by different countries which also includes the users and session data from last 10 days, it also includes user demographic. Device and new vs returning user. Deliver an awe inspiring pitch with this creative Website And Social Media Digital Audit Dashboard Highlighting Website Visitors With Device Rules PDF bundle. Topics like Website Visitors Country, User Demographics, Social Networks can be discussed with this completely editable template. It is available for immediate download depending on the needs and requirements of the user.
 Home
Home