AI PPT Maker
Templates
PPT Bundles
Design Services
Business PPTs
Business Plan
Management
Strategy
Introduction PPT
Roadmap
Self Introduction
Timelines
Process
Marketing
Agenda
Technology
Medical
Startup Business Plan
Cyber Security
Dashboards
SWOT
Proposals
Education
Pitch Deck
Digital Marketing
KPIs
Project Management
Product Management
Artificial Intelligence
Target Market
Communication
Supply Chain
Google Slides
Research Services
 One Pagers
All Categories
-
Home
- Customer Favorites
- Dashboard
Dashboard

Data And Customer Analysis Company Outline Financial Performance Estimation FY22 Pictures PDF
This slide highlights the Nielsen financial performance guidance which includes the EBITDA, free cash flow, organic CC growth, interest expense, tax rate, depreciation and amortization, and average diluted shares. Formulating a presentation can take up a lot of effort and time, so the content and message should always be the primary focus. The visuals of the PowerPoint can enhance the presenters message, so our Data And Customer Analysis Company Outline Financial Performance Estimation FY22 Pictures PDF was created to help save time. Instead of worrying about the design, the presenter can concentrate on the message while our designers work on creating the ideal templates for whatever situation is needed. Slidegeeks has experts for everything from amazing designs to valuable content, we have put everything into Data And Customer Analysis Company Outline Financial Performance Estimation FY22 Pictures PDF

Data Lake Architecture Purpose Of Data Lake In Business Ppt Visual Aids Outline PDF
This slide depicts the purpose of the data lake in the business such as beneficial for time-to-market analytics, IT-driven business process, cost-effective decisions, and so on. This is a Data Lake Architecture Purpose Of Data Lake In Business Ppt Visual Aids Outline PDF template with various stages. Focus and dispense information on seven stages using this creative set, that comes with editable features. It contains large content boxes to add your information on topics like Business Enabler, Data Driven, Time To Market, Analytics Solutions, IT Driven Business Process. You can also showcase facts, figures, and other relevant content using this PPT layout. Grab it now.

Data Analytics IT Tasks And Skills Of Data And Analytics Manager Ppt Gallery Influencers PDF
This slide depicts the tasks performed by a data and analytics manager and skills he should have, such as leadership and project management qualities, interpersonal communication skills, and so on. This is a data analytics it tasks and skills of data and analytics manager ppt gallery influencers pdf template with various stages. Focus and dispense information on six stages using this creative set, that comes with editable features. It contains large content boxes to add your information on topics like data mining and predictive monitoring, interpersonal communication, leadership and project management, database systems. You can also showcase facts, figures, and other relevant content using this PPT layout. Grab it now.

Administered Data And Analytic Quality Playbook Final Thoughts For Data Analytics Playbook Summary PDF
This template covers the data analytics company final thoughts at the end of the e book.Presenting Administered Data And Analytic Quality Playbook Final Thoughts For Data Analytics Playbook Summary PDF to provide visual cues and insights. Share and navigate important information on five stages that need your due attention. This template can be used to pitch topics like Data Accelerating, Intelligent Actionable, Companies Constantly In addtion, this PPT design contains high resolution images, graphics, etc, that are easily editable and available for immediate download.

Toolkit For Data Science And Analytics Transition Key Features Of Predictive Data Analytics Software Ideas PDF
This slide represents the characteristics of predictive data analytics software. It includes features like predictive modeling, predictive scoring and data mining functions that help companies to get better insights. If your project calls for a presentation, then Slidegeeks is your go to partner because we have professionally designed, easy to edit templates that are perfect for any presentation. After downloading, you can easily edit Toolkit For Data Science And Analytics Transition Key Features Of Predictive Data Analytics Software Ideas PDF and make the changes accordingly. You can rearrange slides or fill them with different images. Check out all the handy templates.

Toolkit For Data Science And Analytics Transition Key Requirements For Data Analytics Project Ideas PDF
The slide gives an overview of key business elements that are required for data analytics project. It includes information such as business value drivers, data strategy, and decision model etc. Make sure to capture your audiences attention in your business displays with our gratis customizable Toolkit For Data Science And Analytics Transition Key Requirements For Data Analytics Project Ideas PDF. These are great for business strategies, office conferences, capital raising or task suggestions. If you desire to acquire more customers for your tech business and ensure they stay satisfied, create your own sales presentation with these plain slides.

Toolkit For Data Science And Analytics Transition Change Management Data Analytics Process Guidelines PDF
In this slide, we are tabulating the key processes and activities involved for data management process. It contains information on implementing the change management in data analytic framework. Take your projects to the next level with our ultimate collection of Toolkit For Data Science And Analytics Transition Change Management Data Analytics Process Guidelines PDF. Slidegeeks has designed a range of layouts that are perfect for representing task or activity duration, keeping track of all your deadlines at a glance. Tailor these designs to your exact needs and give them a truly corporate look with your own brand colors they will make your projects stand out from the rest.

Introducing CRM Framework Within Organization CRM Data Analysis Period Ppt Ideas Themes PDF
Presenting this set of slides with name introducing crm framework within organization crm data analysis period ppt ideas themes pdf. The topics discussed in these slides are entities by rep, completed activities, biz notes month, phone calls last 3 months, activity last 3 months, sales last 3 months, profit last 3 months. This is a completely editable PowerPoint presentation and is available for immediate download. Download now and impress your audience.
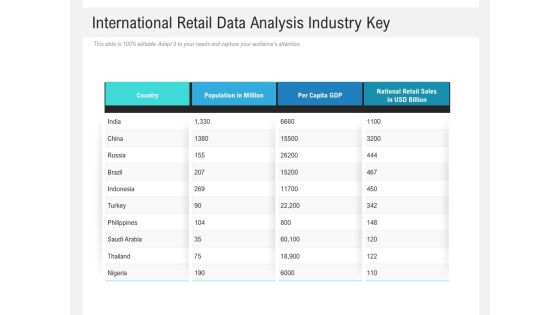
International Retail Data Analysis Industry Key Ppt Powerpoint Presentation Portfolio Infographics Pdf
Pitch your topic with ease and precision using this international retail data analysis industry key ppt powerpoint presentation portfolio infographics pdf. This layout presents information on national retail sales in usd billion, per capita gdp, population in million, country. It is also available for immediate download and adjustment. So, changes can be made in the color, design, graphics or any other component to create a unique layout.

Corporate Intelligence Business Analysis Data Integration Processes Design Ppt Slides Visual Aids PDF
Presenting corporate intelligence business analysis data integration processes design ppt slides visual aids pdf to provide visual cues and insights. Share and navigate important information on four stages that need your due attention. This template can be used to pitch topics like extract, transform, cleansing, load. In addition, this PPT design contains high-resolution images, graphics, etc, that are easily editable and available for immediate download.

Business Data Analysis Network And In Stream Monitoring Technologies Portrait PDF
This is a business data analysis network and in stream monitoring technologies portrait pdf template with various stages. Focus and dispense information on three stages using this creative set, that comes with editable features. It contains large content boxes to add your information on topics like packet evaluation, distributed query processing like applications, email parsers . You can also showcase facts, figures, and other relevant content using this PPT layout. Grab it now.

Competitive Analysis By Operational And Financial Data Ppt Outline Graphics Example PDF
The slide provides the Competitive landscape of the company on the basis of companys size i.e. number of users, revenue, app downloads, user traffic, social media followers etc. Deliver an awe inspiring pitch with this creative competitive analysis by operational and financial data ppt outline graphics example pdf bundle. Topics like competitive factor, product service, profit, competitor can be discussed with this completely editable template. It is available for immediate download depending on the needs and requirements of the user.
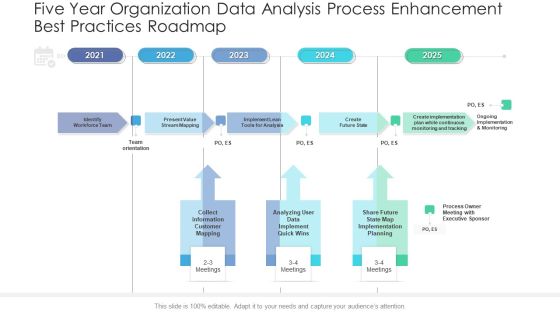
Five Year Organization Data Analysis Process Enhancement Best Practices Roadmap Rules
Presenting our innovatively structured five year organization data analysis process enhancement best practices roadmap rules Template. Showcase your roadmap process in different formats like PDF, PNG, and JPG by clicking the download button below. This PPT design is available in both Standard Screen and Widescreen aspect ratios. It can also be easily personalized and presented with modified font size, font type, color, and shapes to measure your progress in a clear way.
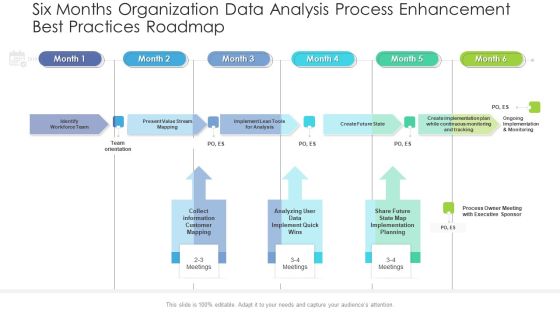
Six Months Organization Data Analysis Process Enhancement Best Practices Roadmap Inspiration
Presenting our innovatively structured six months organization data analysis process enhancement best practices roadmap inspiration Template. Showcase your roadmap process in different formats like PDF, PNG, and JPG by clicking the download button below. This PPT design is available in both Standard Screen and Widescreen aspect ratios. It can also be easily personalized and presented with modified font size, font type, color, and shapes to measure your progress in a clear way.

Three Months Organization Data Analysis Process Enhancement Best Practices Roadmap Portrait
Presenting our innovatively structured three months organization data analysis process enhancement best practices roadmap portrait Template. Showcase your roadmap process in different formats like PDF, PNG, and JPG by clicking the download button below. This PPT design is available in both Standard Screen and Widescreen aspect ratios. It can also be easily personalized and presented with modified font size, font type, color, and shapes to measure your progress in a clear way.

Half Yearly Development And Strategy Roadmap For Big Data Analysis Ideas
Presenting our innovatively-structured half yearly development and strategy roadmap for big data analysis ideas Template. Showcase your roadmap process in different formats like PDF, PNG, and JPG by clicking the download button below. This PPT design is available in both Standard Screen and Widescreen aspect ratios. It can also be easily personalized and presented with modified font size, font type, color, and shapes to measure your progress in a clear way.

3 Months Development And Strategy Roadmap For Big Data Analysis Background
Presenting our innovatively-structured 3 months development and strategy roadmap for big data analysis background Template. Showcase your roadmap process in different formats like PDF, PNG, and JPG by clicking the download button below. This PPT design is available in both Standard Screen and Widescreen aspect ratios. It can also be easily personalized and presented with modified font size, font type, color, and shapes to measure your progress in a clear way.

3 Months Strategy Roadmap For Data Analysis Integration To Business Icons
Introducing our 3 months strategy roadmap for data analysis integration to business icons. This PPT presentation is Google Slides compatible, therefore, you can share it easily with the collaborators for measuring the progress. Also, the presentation is available in both standard screen and widescreen aspect ratios. So edit the template design by modifying the font size, font type, color, and shapes as per your requirements. As this PPT design is fully editable it can be presented in PDF, JPG and PNG formats.

5 Year Development And Strategy Roadmap For Big Data Analysis Elements
Presenting our innovatively-structured 5 year development and strategy roadmap for big data analysis elements Template. Showcase your roadmap process in different formats like PDF, PNG, and JPG by clicking the download button below. This PPT design is available in both Standard Screen and Widescreen aspect ratios. It can also be easily personalized and presented with modified font size, font type, color, and shapes to measure your progress in a clear way.

5 Year Strategy Roadmap For Data Analysis Integration To Business Pictures
Introducing our 5 year strategy roadmap for data analysis integration to business pictures. This PPT presentation is Google Slides compatible, therefore, you can share it easily with the collaborators for measuring the progress. Also, the presentation is available in both standard screen and widescreen aspect ratios. So edit the template design by modifying the font size, font type, color, and shapes as per your requirements. As this PPT design is fully editable it can be presented in PDF, JPG and PNG formats.

6 Months Development And Strategy Roadmap For Big Data Analysis Graphics
Presenting our innovatively-structured 6 months development and strategy roadmap for big data analysis graphics Template. Showcase your roadmap process in different formats like PDF, PNG, and JPG by clicking the download button below. This PPT design is available in both Standard Screen and Widescreen aspect ratios. It can also be easily personalized and presented with modified font size, font type, color, and shapes to measure your progress in a clear way.

6 Months Strategy Roadmap For Data Analysis Integration To Business Diagrams
Introducing our 6 months strategy roadmap for data analysis integration to business diagrams. This PPT presentation is Google Slides compatible, therefore, you can share it easily with the collaborators for measuring the progress. Also, the presentation is available in both standard screen and widescreen aspect ratios. So edit the template design by modifying the font size, font type, color, and shapes as per your requirements. As this PPT design is fully editable it can be presented in PDF, JPG and PNG formats.

Quantitative Risk Assessment Cost Of Quality Data Analysis Tool Graphics PDF
Presenting Quantitative Risk Assessment Cost Of Quality Data Analysis Tool Graphics PDF to provide visual cues and insights. Share and navigate important information on three stages that need your due attention. This template can be used to pitch topics like Cost Of Conformance, Cost Of Quality, Internal Failure Costs, External Failure Costs, Appraisal Cost. In addtion, this PPT design contains high resolution images, graphics, etc, that are easily editable and available for immediate download.

Comparision Matrix To Select Best Quantitative Data Analysis Software Download PDF
Persuade your audience using this Comparision Matrix To Select Best Quantitative Data Analysis Software Download PDF. This PPT design covers six stages, thus making it a great tool to use. It also caters to a variety of topics including Manufacturer, Platform, Licensing, Features, Costing. Download this PPT design now to present a convincing pitch that not only emphasizes the topic but also showcases your presentation skills.

Data And Customer Analysis Company Outline Facts And Figures Topics PDF
This slide highlights the Nielsen facts and figures, which showcases number of people participated in the companys panels, employee count, and business resources group. There are so many reasons you need a Data And Customer Analysis Company Outline Facts And Figures Topics PDF. The first reason is you cannot spend time making everything from scratch, Thus, Slidegeeks has made presentation templates for you too. You can easily download these templates from our website easily.

NLP Applications Methodology Business Applications Sentiment Analysis Infographics PDF
This slide represents the sentiment analysis in NLP business applications and how online generated data is interpreted by NLP to generate useful insights. From laying roadmaps to briefing everything in detail, our templates are perfect for you. You can set the stage with your presentation slides. All you have to do is download these easy-to-edit and customizable templates. NLP Applications Methodology Business Applications Sentiment Analysis Infographics PDF will help you deliver an outstanding performance that everyone would remember and praise you for. Do download this presentation today.

Social Media Marketing Department Detail Report One Pager Documents
This one pager marketing department report template covers SMM report including twitter, facebook, instagram, linkedin, pinterest summary. Presenting you an exemplary Social Media Marketing Department Detail Report One Pager Documents. Our one-pager comprises all the must-have essentials of an inclusive document. You can edit it with ease, as its layout is completely editable. With such freedom, you can tweak its design and other elements to your requirements. Download this Social Media Marketing Department Detail Report One Pager Documents brilliant piece now.
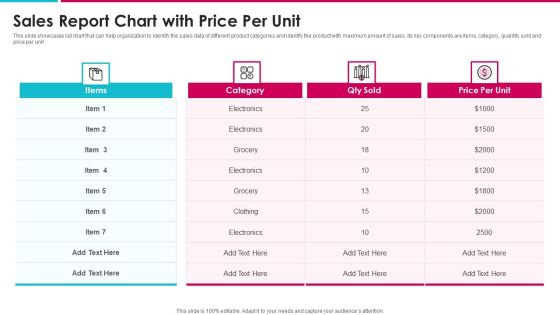
Sales Report Chart With Price Per Unit Information PDF
This slide showcases list chart that can help organization to identify the sales data of different product categories and identify the product with maximum amount of sales. Its key components are items, category, quantity sold and price per unit Showcasing this set of slides titled sales report chart with price per unit information pdf. The topics addressed in these templates are sales report chart with price per unit. All the content presented in this PPT design is completely editable. Download it and make adjustments in color, background, font etc. as per your unique business setting.

Customer Retention Business Monthly Report Summary With Graphs Guidelines PDF
The Following Slide highlights the Customer Retention Monthly Report with graphs . It showcases data and graphs with headings, metrics, current month, last month , change , customer churn , revenue churn , net retention and MRR growth. Showcasing this set of slides titled Customer Retention Business Monthly Report Summary With Graphs Guidelines PDF The topics addressed in these templates are Recurring Revenue, Customer Churn, Promoter Score All the content presented in this PPT design is completely editable. Download it and make adjustments in color, background, font etc. as per your unique business setting.

Automotive Industry Report Motor Vehicle Production By Type Portrait PDF
This slide covers the details of the data related to vehicle production all over the world in last 10 years to know where we are right now and what is needed to be at a good spot in future. Pitch your topic with ease and precision using this Automotive Industry Report Motor Vehicle Production By Type Portrait PDF. This layout presents information on Automotive Industry Report, Motor Vehicle Production. It is also available for immediate download and adjustment. So, changes can be made in the color, design, graphics or any other component to create a unique layout.

Recruitment Requisition Departmental Performance Report Sheet Demonstration PDF
Following slide illustrates hiring performance chart utilized by organizations to identify planned and spent budget along with time to fill requisitions. This slide provides data regarding various departments, planned and filled requisitions, salary budget, average days, etc. Pitch your topic with ease and precision using this Recruitment Requisition Departmental Performance Report Sheet Demonstration PDF. This layout presents information on Recruitment Requisition, Departmental Performance, Report Sheet. It is also available for immediate download and adjustment. So, changes can be made in the color, design, graphics or any other component to create a unique layout.

Environmental Social And Governance Reporting Framework Model Demonstration PDF
This slide provides a framework for managers in order to develop their annual ESG report. It incorporated factors such as climate change, water and waste management, technology advancement , diversity, corporate governance and data privacy etc. Pitch your topic with ease and precision using this Environmental Social And Governance Reporting Framework Model Demonstration PDF. This layout presents information on Environmental, Social, Measures. It is also available for immediate download and adjustment. So, changes can be made in the color, design, graphics or any other component to create a unique layout.

5 Week Dissertation Roadmap To Create Project Report Pictures PDF
This slide shows 6 months roadmap for preparation of dissertation report. It includes various tasks such as prepare research plan, review available literature, create lesson plans, etc. Persuade your audience using this 5 Week Dissertation Roadmap To Create Project Report Pictures PDF. This PPT design covers six stages, thus making it a great tool to use. It also caters to a variety of topics including Implement Research Plan, Analyze Collected Data, Revise Plans. Download this PPT design now to present a convincing pitch that not only emphasizes the topic but also showcases your presentation skills.

Data Analytics Must Have Skills Before Implementing Data Analytics Ppt Ideas PDF
This slide depicts the three primary skill sets needed to become a Data Scientists, including mathematical expertise, knowledge of technology, and business acumen. Deliver an awe inspiring pitch with this creative data analytics must have skills before implementing data analytics ppt ideas pdf bundle. Topics like business, system, measurements, information can be discussed with this completely editable template. It is available for immediate download depending on the needs and requirements of the user.

Company Budget Analysis Strategies To Control Marketing Department Overspending Mockup PDF
The following slide provides information regarding strategies to control marketing department overspending which are outsourcing work to digital marketing agency and hiring a marketing specialist. The also provides details of the business advantage offered by each strategy. The Company Budget Analysis Strategies To Control Marketing Department Overspending Mockup PDF is a compilation of the most recent design trends as a series of slides. It is suitable for any subject or industry presentation, containing attractive visuals and photo spots for businesses to clearly express their messages. This template contains a variety of slides for the user to input data, such as structures to contrast two elements, bullet points, and slides for written information. Slidegeeks is prepared to create an impression.
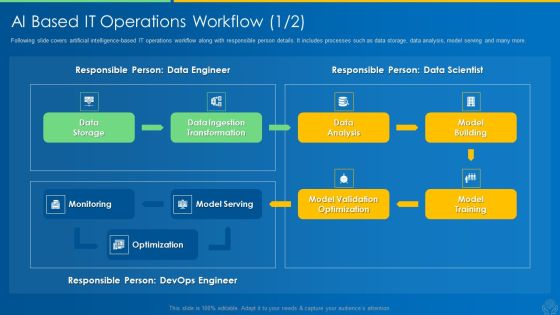
AI And ML Driving Monetary Value For Organization AI Based IT Operations Workflow Data Topics PDF
Following slide covers artificial intelligence-based IT operations workflow along with responsible person details. It includes processes such as data storage, data analysis, model serving and many more. Deliver an awe inspiring pitch with this creative ai and ml driving monetary value for organization ai based it operations workflow data topics pdf bundle. Topics like data storage, data ingestion transformation, data analysis, model building, model training can be discussed with this completely editable template. It is available for immediate download depending on the needs and requirements of the user.

Online Marketing Techniques Assessment Approach Social Media Competitor Analysis For Digital Footprint Microsoft PDF
The purpose of the following slide is to showcase the findings of the social media competitor analysis. It includes information regarding the multiple social media channels followers, audience growth, published posts and engagement rate. The Online Marketing Techniques Assessment Approach Social Media Competitor Analysis For Digital Footprint Microsoft PDF is a compilation of the most recent design trends as a series of slides. It is suitable for any subject or industry presentation, containing attractive visuals and photo spots for businesses to clearly express their messages. This template contains a variety of slides for the user to input data, such as structures to contrast two elements, bullet points, and slides for written information. Slidegeeks is prepared to create an impression.

Toolkit For Data Science And Analytics Transition Reasons Towards Failure Of Data Analytics Project Background PDF
This slide shows the graph highlighting key reasons for the failure of data management project. If you are looking for a format to display your unique thoughts, then the professionally designed Toolkit For Data Science And Analytics Transition Reasons Towards Failure Of Data Analytics Project Background PDF is the one for you. You can use it as a Google Slides template or a PowerPoint template. Incorporate impressive visuals, symbols, images, and other charts. Modify or reorganize the text boxes as you desire. Experiment with shade schemes and font pairings. Alter, share or cooperate with other people on your work. Download Toolkit For Data Science And Analytics Transition Reasons Towards Failure Of Data Analytics Project Background PDF and find out how to give a successful presentation. Present a perfect display to your team and make your presentation unforgettable.

Toolkit For Data Science And Analytics Transition Data Analytics Program Checklist Portrait PDF
This slide shows progress status of data analytics process which includes important key tasks that must be performed while initiating a project. From laying roadmaps to briefing everything in detail, our templates are perfect for you. You can set the stage with your presentation slides. All you have to do is download these easy to edit and customizable templates. Toolkit For Data Science And Analytics Transition Data Analytics Program Checklist Portrait PDF will help you deliver an outstanding performance that everyone would remember and praise you for. Do download this presentation today.

Toolkit For Data Science And Analytics Transition Training Skills Plan For Data Analytics Program Summary PDF
This slide illustrates the training plan by analyzing the key skills required data analytics project. Make sure to capture your audiences attention in your business displays with our gratis customizable Toolkit For Data Science And Analytics Transition Training Skills Plan For Data Analytics Program Summary PDF. These are great for business strategies, office conferences, capital raising or task suggestions. If you desire to acquire more customers for your tech business and ensure they stay satisfied, create your own sales presentation with these plain slides.
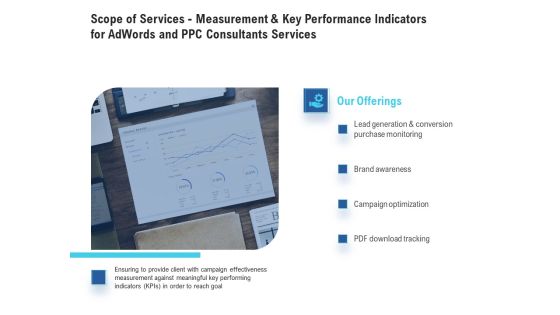
Scope Of Services - Measurement And Key Performance Indicators For Adwords And PPC Consultants Services Brochure PDF
Presenting this set of slides with name scope of services - measurement and key performance indicators for adwords and ppc consultants services brochure pdf. This is a four stage process. The stages in this process are lead generation and conversion purchase monitoring, brand awareness, campaign optimization, pdf download tracking. This is a completely editable PowerPoint presentation and is available for immediate download. Download now and impress your audience.

Emerging Market Trends Retail Marketing Rules PDF
This slide covers the market trends related to retail sector for convenience stores, drugstores or pharmacies and departmental stores. Deliver and pitch your topic in the best possible manner with this emerging market trends retail marketing rules pdf. Use them to share invaluable insights on emerging market trends and impress your audience. This template can be altered and modified as per your expectations. So, grab it now.

Digital Competency Evaluation And Modification Key Kpis For Digital Transformation Portrait PDF
Purpose of the following slide is to show the KPI which can be used to measure the digital transformation, these KPIs can be customer experience, user metrics and application metrics. Do you have an important presentation coming up Are you looking for something that will make your presentation stand out from the rest Look no further than Digital Competency Evaluation And Modification Key Kpis For Digital Transformation Portrait PDF. With our professional designs, you can trust that your presentation will pop and make delivering it a smooth process. And with Slidegeeks, you can trust that your presentation will be unique and memorable. So why wait Grab Digital Competency Evaluation And Modification Key Kpis For Digital Transformation Portrait PDF today and make your presentation stand out from the rest.
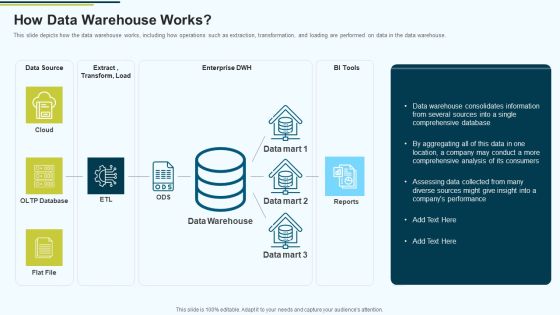
MIS How Data Warehouse Works Ppt PowerPoint Presentation Summary Backgrounds PDF
This slide depicts how the data warehouse works, including how operations such as extraction, transformation, and loading are performed on data in the data warehouse.Deliver an awe inspiring pitch with this creative MIS How Data Warehouse Works Ppt PowerPoint Presentation Summary Backgrounds PDF bundle. Topics like Data Warehouse Consolidates, Comprehensive Analysis, Companys Performance can be discussed with this completely editable template. It is available for immediate download depending on the needs and requirements of the user.
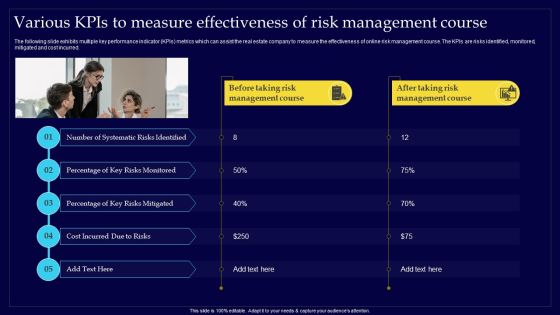
Executing Risk Mitigation Various Kpis To Measure Effectiveness Of Risk Management Sample PDF
The following slide exhibits multiple key performance indicator KPIs metrics which can assist the real estate company to measure the effectiveness of online risk management course. The KPIs are risks identified, monitored, mitigated and cost incurred. This Executing Risk Mitigation Various Kpis To Measure Effectiveness Of Risk Management Sample PDF from Slidegeeks makes it easy to present information on your topic with precision. It provides customization options, so you can make changes to the colors, design, graphics, or any other component to create a unique layout. It is also available for immediate download, so you can begin using it right away. Slidegeeks has done good research to ensure that you have everything you need to make your presentation stand out. Make a name out there for a brilliant performance.

Successful Risk Administration Various Kpis To Measure Effectiveness Of Risk Management Course Inspiration PDF
The following slide exhibits multiple key performance indicator Kpis metrics which can assist the real estate company to measure the effectiveness of online risk management course. The KPIs are risks identified, monitored, mitigated and cost incurred. This Successful Risk Administration Various Kpis To Measure Effectiveness Of Risk Management Course Inspiration PDF from Slidegeeks makes it easy to present information on your topic with precision. It provides customization options, so you can make changes to the colors, design, graphics, or any other component to create a unique layout. It is also available for immediate download, so you can begin using it right away. Slidegeeks has done good research to ensure that you have everything you need to make your presentation stand out. Make a name out there for a brilliant performance.

Addressing Market Trends Of Global Convention Industry Themes PDF
This slide provides information regarding market trends of global convention industry during COVID - 19. Additionally, it shows the stats related to market size post pandemie and total loss of the industry during pandemic time Presenting addressing market trends of global convention industry themes pdf to provide visual cues and insights. Share and navigate important information on six stages that need your due attention. This template can be used to pitch topics like redesigning of event models, application of big data, integration of trade shows. In addtion, this PPT design contains high resolution images, graphics, etc, that are easily editable and available for immediate download.
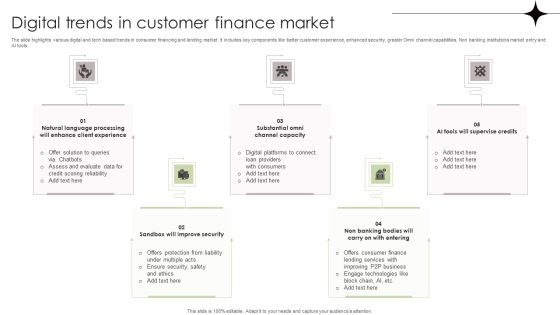
Digital Trends In Customer Finance Market Template PDF
The slide highlights various digital and tech based trends in consumer financing and lending market. It includes key components like better customer experience, enhanced security, greater Omni channel capabilities, Non banking institutions market entry and AI tools. Persuade your audience using this Digital Trends In Customer Finance Market Template PDF. This PPT design covers five stages, thus making it a great tool to use. It also caters to a variety of topics including Evaluate Data, Ensure Security, Lending Services. Download this PPT design now to present a convincing pitch that not only emphasizes the topic but also showcases your presentation skills.
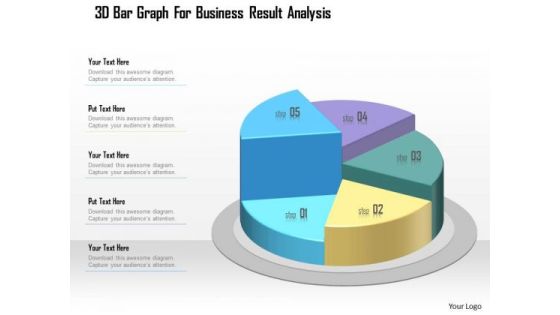
Business Diagram 3d Bar Graph For Business Result Analysis Presentation Template
This business slide displays five staged pie chart. This diagram is a data visualization tool that gives you a simple way to present statistical information. This slide helps your audience examine and interpret the data you present.

Toolkit For Data Science And Analytics Transition Priority Checklist For Data Analytics Program Sample PDF
The slide displays the to do list that allows to set the high priority task at first and Least priority at last to ensure consistency and completeness while performing the process. This Toolkit For Data Science And Analytics Transition Priority Checklist For Data Analytics Program Sample PDF is perfect for any presentation, be it in front of clients or colleagues. It is a versatile and stylish solution for organizing your meetings. The Toolkit For Data Science And Analytics Transition Priority Checklist For Data Analytics Program Sample PDF features a modern design for your presentation meetings. The adjustable and customizable slides provide unlimited possibilities for acing up your presentation. Slidegeeks has done all the homework before launching the product for you. So, do not wait, grab the presentation templates today.

Toolkit For Data Science And Analytics Transition Employee Training Plan For Data Analytics Program Microsoft PDF
This slide shows the cross training employee assessment chart based on the key skill levels with respective responsibilities. Do you have an important presentation coming up Are you looking for something that will make your presentation stand out from the rest Look no further than Toolkit For Data Science And Analytics Transition Employee Training Plan For Data Analytics Program Microsoft PDF. With our professional designs, you can trust that your presentation will pop and make delivering it a smooth process. And with Slidegeeks, you can trust that your presentation will be unique and memorable. So why wait Grab Toolkit For Data Science And Analytics Transition Employee Training Plan For Data Analytics Program Microsoft PDF today and make your presentation stand out from the rest.

Tactical Measures And Strategic Analysis Framework For Competitors Elements PDF
This slide defines the template for planning and analyzing the strategies to be implemented. It includes information related to the data, analysis, reviews, strategic matrix and implement. Persuade your audience using this Tactical Measures And Strategic Analysis Framework For Competitors Elements PDF. This PPT design covers five stages, thus making it a great tool to use. It also caters to a variety of topics including Gather Data, Conduct Analysis, Review Data. Download this PPT design now to present a convincing pitch that not only emphasizes the topic but also showcases your presentation skills.

Toolkit For Data Science And Analytics Transition Key Features Of Data Analytics Software Topics PDF
If your project calls for a presentation, then Slidegeeks is your go to partner because we have professionally designed, easy to edit templates that are perfect for any presentation. After downloading, you can easily edit Toolkit For Data Science And Analytics Transition Key Features Of Data Analytics Software Topics PDF and make the changes accordingly. You can rearrange slides or fill them with different images. Check out all the handy templates.
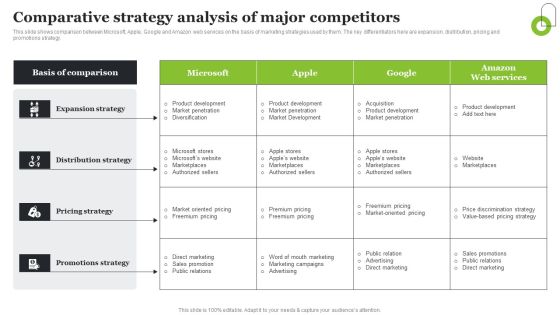
Microsoft Strategic Plan To Become Market Leader Comparative Strategy Analysis Of Major Competitors Structure PDF
This slide shows comparison between Microsoft, Apple, Google and Amazon web services on the basis of marketing strategies used by them. The key differentiators here are expansion, distribution, pricing and promotions strategy. The Microsoft Strategic Plan To Become Market Leader Comparative Strategy Analysis Of Major Competitors Structure PDF is a compilation of the most recent design trends as a series of slides. It is suitable for any subject or industry presentation, containing attractive visuals and photo spots for businesses to clearly express their messages. This template contains a variety of slides for the user to input data, such as structures to contrast two elements, bullet points, and slides for written information. Slidegeeks is prepared to create an impression.

Designing Effective Kpis Ppt Example
This is a designing effective kpis ppt example. This is a seven stage process. The stages in this process are goal, audience, cost, benchmark, kpi, tool, insight, the networked nonprofit.

Digital Marketing Kpis Powerpoint Guide
This is a digital marketing kpis powerpoint guide. This is a four stage process. The stages in this process are awareness, consideration, decision, visitors, sales and marketing process, leads, marketing qualified leads, sales qualified leads.

Kpis Campaign Success Powerpoint Slide
This is a kpis campaign success powerpoint slide. This is a three stage process. The stages in this process are high value actions, video views, website visitors, purchases, installs, sign ups, traffic, engagement, conversion.
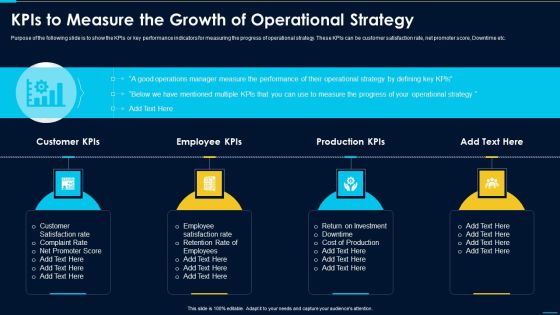
Kpis To Measure The Growth Of Operational Strategy Information PDF
Purpose of the following slide is to show the KPIs or key performance indicators for measuring the progress of operational strategy. These KPIs can be customer satisfaction rate, net promoter score, Downtime etc.This is a kpis to measure the growth of operational strategy information pdf template with various stages. Focus and dispense information on four stages using this creative set, that comes with editable features. It contains large content boxes to add your information on topics like unnecessary transportation, producing excessive, multiple products. You can also showcase facts, figures, and other relevant content using this PPT layout. Grab it now.

Measuring Security Awareness Campaign Results With Kpis Template PDF
The purpose of this slide is to showcase various key performance indicator KPIs which can assist the company to effectively track cyber security awareness campaign results. The KPIs are phishing rate, self reported incidents, security breaches, cost of security breach and campaign participation rateDeliver an awe inspiring pitch with this creative Measuring Security Awareness Campaign Results With Kpis Template PDF bundle. Topics like Security Breaches, Cost Of Security, Campaign Participation can be discussed with this completely editable template. It is available for immediate download depending on the needs and requirements of the user.
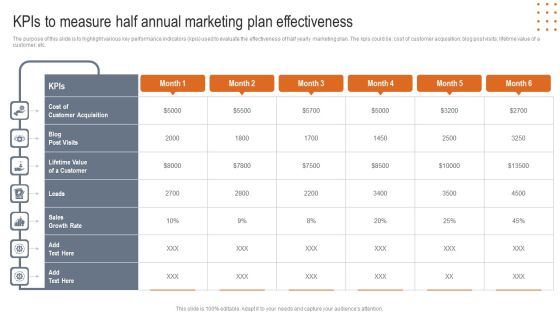
Kpis To Measure Half Annual Marketing Plan Effectiveness Designs PDF
The purpose of this slide is to highlight various key performance indicators kpis used to evaluate the effectiveness of half yearly marketing plan. The kpis could be cost of customer acquisition blog post visits lifetime value of a customer etc. Pitch your topic with ease and precision using this Kpis To Measure Half Annual Marketing Plan Effectiveness Designs PDF. This layout presents information on Customer Acquisition, Lifetime Value Customer, Growth Rate. It is also available for immediate download and adjustment. So, changes can be made in the color, design, graphics or any other component to create a unique layout.
