AI PPT Maker
Templates
PPT Bundles
Design Services
Business PPTs
Business Plan
Management
Strategy
Introduction PPT
Roadmap
Self Introduction
Timelines
Process
Marketing
Agenda
Technology
Medical
Startup Business Plan
Cyber Security
Dashboards
SWOT
Proposals
Education
Pitch Deck
Digital Marketing
KPIs
Project Management
Product Management
Artificial Intelligence
Target Market
Communication
Supply Chain
Google Slides
Research Services
 One Pagers
All Categories
-
Home
- Customer Favorites
- Dashboard
Dashboard

Business Diagram Four Staged Business Text Boxes For Data Representation Presentation Template
Four staged business text boxes are used to design this Power Point template slide. This PPT slide contains the concept of data representation. Use this PPT slide for your business and sales data analysis related topics in any presentation.

Defining Key Metrics To Analyse Current Sales Performance Ppt Infographics Ideas PDF
The following slide showcases some metrics to evaluate existing sales performance due to execute effective risk management strategies. It includes elements such as opportunities, win rate, average time to win, average value per win, sales velocity etc. Welcome to our selection of the Defining Key Metrics To Analyse Current Sales Performance Ppt Infographics Ideas PDF. These are designed to help you showcase your creativity and bring your sphere to life. Planning and Innovation are essential for any business that is just starting out. This collection contains the designs that you need for your everyday presentations. All of our PowerPoints are 100 percent editable, so you can customize them to suit your needs. This multi purpose template can be used in various situations. Grab these presentation templates today.

Comparative Analysis Of Major Players In Global Automobile Market Analysis Topics PDF
This slide covers a comparative assessment of key manufacturers of the worldwide automobile industry. It includes comparison on basis of founding date, type, locations, employees, valuation, revenue, cost of goods, gross profit, net profit, etc. The Comparative Analysis Of Major Players In Global Automobile Market Analysis Topics PDF is a compilation of the most recent design trends as a series of slides. It is suitable for any subject or industry presentation, containing attractive visuals and photo spots for businesses to clearly express their messages. This template contains a variety of slides for the user to input data, such as structures to contrast two elements, bullet points, and slides for written information. Slidegeeks is prepared to create an impression.

Guide For Marketing Analytics To Improve Decisions Target Audience Segmentation Assessment For Personalization Slides PDF
The following slide covers market segmentation analysis to determine ideal customers and their needs. It includes elements such as personality trait overlap, customer expense analysis, behavior assessment, market group, financial interest etc. The Guide For Marketing Analytics To Improve Decisions Target Audience Segmentation Assessment For Personalization Slides PDF is a compilation of the most recent design trends as a series of slides. It is suitable for any subject or industry presentation, containing attractive visuals and photo spots for businesses to clearly express their messages. This template contains a variety of slides for the user to input data, such as structures to contrast two elements, bullet points, and slides for written information. Slidegeeks is prepared to create an impression.

Brand And Performance Marketing Services And Metrics Themes PDF
The slide showcases services offered by brand and performance marketing, which helps differentiate between them. There are a few services that are offered by both. The most common elements are the services that are provided by these marketing types, as well as key performance indicators. Presenting Brand And Performance Marketing Services And Metrics Themes PDF to dispense important information. This template comprises three stages. It also presents valuable insights into the topics including Services Provided, Services Provided, Services Provided Performance Marketing. This is a completely customizable PowerPoint theme that can be put to use immediately. So, download it and address the topic impactfully.

Big Data Opportunities And Challenges In Construction Ppt PowerPoint Presentation Outline
This is a big data opportunities and challenges in construction ppt powerpoint presentation outline. This is a three stage process. The stages in this process are finance, management, growth, percentage, business.

Bar Graph For Financial Statements Ppt PowerPoint Presentation Example
This is a bar graph for financial statements ppt powerpoint presentation example. This is a four stage process. The stages in this process are product version, finance, year.

Acquisition Cost Per Customer Ppt PowerPoint Presentation Example 2015
This is a acquisition cost per customer ppt powerpoint presentation example 2015. This is a three stage process. The stages in this process are rising, steady, falling.
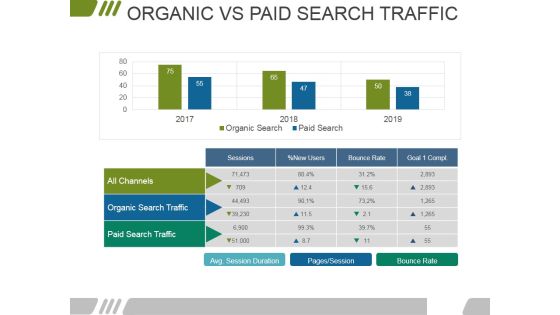
Organic Vs Paid Search Traffic Ppt PowerPoint Presentation Summary Visuals
This is a organic vs paid search traffic ppt powerpoint presentation summary visuals. This is a two stage process. The stages in this process are all channels, organic search traffic, paid search traffic, sessions, bounce rate.
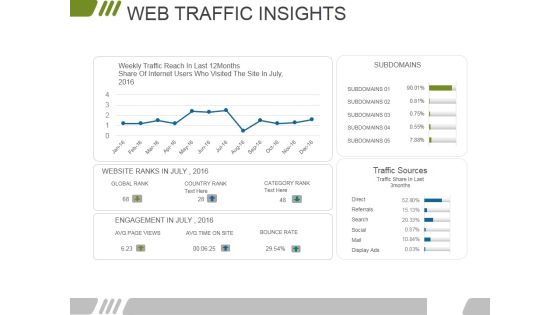
Web Traffic Insights Ppt PowerPoint Presentation Pictures Portrait
This is a web traffic insights ppt powerpoint presentation pictures portrait. This is a four stage process. The stages in this process are subdomains, traffic sources, category rank, country rank, global rank.
Website Performance Review Template 1 Ppt PowerPoint Presentation Slides Icons
This is a website performance review template 1 ppt powerpoint presentation slides icons. This is a three stage process. The stages in this process are online transaction, conversion rate, traffic source, site consumption time, organic branded.

Debt Retrieval Techniques Understanding Our Cash Flow Statements Kpi Fy 20 21 Ppt Infographic Template Background Images PDF
Purpose of the following slide is to show the major key performing indicators of the organization , these KPIs can be the operation activities, cash flow from financing activities, investing activities and the net decrease in cash flow This is a debt retrieval techniques understanding our cash flow statements kpi fy 20 21 ppt infographic template background images pdf template with various stages. Focus and dispense information on four stages using this creative set, that comes with editable features. It contains large content boxes to add your information on topics like cash flow from operations, cash flow from investing activities, cash flow from financing activities, change in cash and cash equivalents. You can also showcase facts, figures, and other relevant content using this PPT layout. Grab it now.
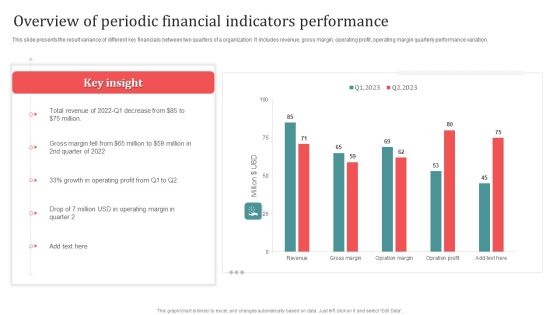
Overview Of Periodic Financial Indicators Performance Designs PDF
This slide presents the result variance of different key financials between two quarters of a organization. It includes revenue, gross margin, operating profit, operating margin quarterly performance variation. Showcasing this set of slides titled Overview Of Periodic Financial Indicators Performance Designs PDF. The topics addressed in these templates are Overview Of Periodic, Financial Indicators Performance. All the content presented in this PPT design is completely editable. Download it and make adjustments in color, background, font etc. as per your unique business setting.

Customer Relationship Management Analytical CRM Ppt Inspiration Portfolio PDF
This is a customer relationship management analytical CRM ppt inspiration portfolio pdf template with various stages. Focus and dispense information on one stages using this creative set, that comes with editable features. It contains large content boxes to add your information on topics like analytical CRM, database management overview, data analysis and data mining. You can also showcase facts, figures, and other relevant content using this PPT layout. Grab it now.
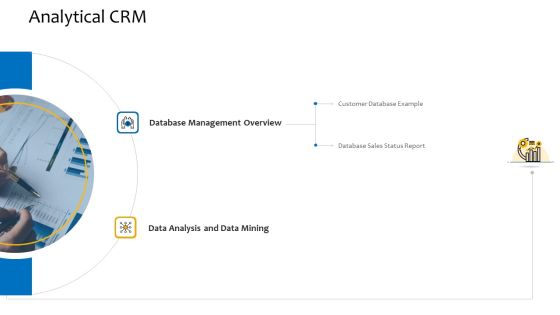
Customer Relationship Management Procedure Analytical CRM Ppt Layouts Information PDF
This is a customer relationship management procedure analytical CRM ppt layouts information pdf template with various stages. Focus and dispense information on two stages using this creative set, that comes with editable features. It contains large content boxes to add your information on topics like analytical CRM, database management overview, data analysis and data mining. You can also showcase facts, figures, and other relevant content using this PPT layout. Grab it now.

Data Center Management Storage Facility For Enterprises Icon Themes PDF
Showcasing this set of slides titled Data Center Management Storage Facility For Enterprises Icon Themes PDF. The topics addressed in these templates are Data Center Management, Storage Facility, Enterprises Icon. All the content presented in this PPT design is completely editable. Download it and make adjustments in color, background, font etc. as per your unique business setting.

Omnichannel Marketing To Optimize Customer Purchase Experience Tools To Improve Marketing Efforts Professional PDF
This slide shows some tools that can be used to improve the marketing efforts of the company such as CRM Customer Relationship Management software, Marketing Automation, Analytics and data visualization, and content management systems along with their implementation costs. Deliver an awe inspiring pitch with this creative omnichannel marketing to optimize customer purchase experience tools to improve marketing efforts professional pdf bundle. Topics like marketing automation, analytics and data visualizations, content management systems can be discussed with this completely editable template. It is available for immediate download depending on the needs and requirements of the user.

Personnel Promotion Evaluation Criteria With Key Indicators Portrait PDF
This slide exhibits promotion criteria used by company to select potential and best employee. It include various factors such as length of service, tenure, performance and potential with description and indicators. Pitch your topic with ease and precision using this Personnel Promotion Evaluation Criteria With Key Indicators Portrait PDF. This layout presents information on Performance, Length Of Service, Potential. It is also available for immediate download and adjustment. So, changes can be made in the color, design, graphics or any other component to create a unique layout.

Chart With Magnifying Glass For Business Research Ppt PowerPoint Presentation Inspiration Shapes
This is a chart with magnifying glass for business research ppt powerpoint presentation inspiration shapes. This is a two stage process. The stages in this process are metrics icon, kpis icon, statistics icon.
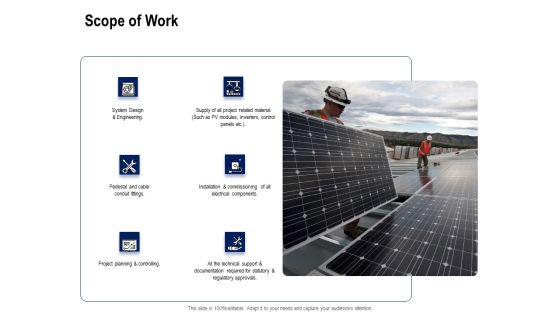
Solar Panel Maintenance Scope Of Work Ppt Professional Design Templates PDF
Deliver an awe-inspiring pitch with this creative solar panel maintenance scope of work ppt professional design templates pdf bundle. Topics like system design and engineering, pedestal and cable conduit fittings, installation and commissioning of all electrical components, project planning and controlling can be discussed with this completely editable template. It is available for immediate download depending on the needs and requirements of the user.
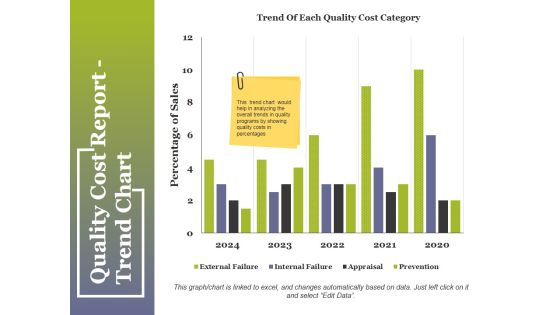
Quality Cost Report Trend Chart Ppt PowerPoint Presentation Summary Pictures
This is a quality cost report trend chart ppt powerpoint presentation summary pictures. This is a two stage process. The stages in this process are compare, business, table, marketing, strategy.

Quality Cost Report Trend Chart Ppt PowerPoint Presentation Portfolio Maker
This is a quality cost report trend chart ppt powerpoint presentation portfolio maker. This is a two stage process. The stages in this process are compare, marketing, business, strategy, planning.

AGENDA Data Driven Promotional Guide To Increase Return On Investment Designs PDF
Are you in need of a template that can accommodate all of your creative concepts This one is crafted professionally and can be altered to fit any style. Use it with Google Slides or PowerPoint. Include striking photographs, symbols, depictions, and other visuals. Fill, move around, or remove text boxes as desired. Test out color palettes and font mixtures. Edit and save your work, or work with colleagues. Download AGENDA Data Driven Promotional Guide To Increase Return On Investment Designs PDF and observe how to make your presentation outstanding. Give an impeccable presentation to your group and make your presentation unforgettable.

Projection Of Major Kpis Related To Customer Onboarding Ppt Infographic Template Designs Download PDF
This slide provides the projections of key performance indicators KPIs related to customer onboarding. KPIs covered in this slide include number of customers, customer churn rate, customer retention rate etc. Deliver and pitch your topic in the best possible manner with this projection of major kpis related to customer onboarding ppt infographic template designs download pdf. Use them to share invaluable insights on number of customers, customer churn rate, customer retention rate, indicator and impress your audience. This template can be altered and modified as per your expectations. So, grab it now.
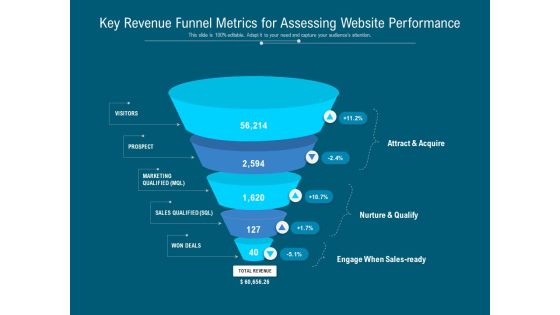
Key Revenue Funnel Metrics For Assessing Website Performance Ppt PowerPoint Presentation Infographics Master Slide PDF
Persuade your audience using this key revenue funnel metrics for assessing website performance ppt powerpoint presentation infographics master slide pdf. This PPT design covers five stages, thus making it a great tool to use. It also caters to a variety of topics including visitors, prospect, marketing qualified mql, sales qualified sql, won deals, attract and acquire, nurture and qualify, engage when sales ready. Download this PPT design now to present a convincing pitch that not only emphasizes the topic but also showcases your presentation skills.

Deploying Online Marketing Impact And Performance Analysis Of Digital Marketing Background PDF
This slide represents marketing impact and performance analysis of digital marketing program. It covers an decline in cart abandonment rate and increase in qualified leads resulting in increase in revenue. The Deploying Online Marketing Impact And Performance Analysis Of Digital Marketing Background PDF is a compilation of the most recent design trends as a series of slides. It is suitable for any subject or industry presentation, containing attractive visuals and photo spots for businesses to clearly express their messages. This template contains a variety of slides for the user to input data, such as structures to contrast two elements, bullet points, and slides for written information. Slidegeeks is prepared to create an impression.

Feature Development Data Associated Activities Guidelines PDF
This slide exhibits survey of data scientists to understand feature engineering activities that helps to improve performance of machine learning business models. It includes activities such as data cleaning, organizing, collection, mining, refining algorithms etc. Pitch your topic with ease and precision using this Feature Development Data Associated Activities Guidelines PDF. This layout presents information on Programming, Developing Training Sets, Gathering Data Sets. It is also available for immediate download and adjustment. So, changes can be made in the color, design, graphics or any other component to create a unique layout.

Customer Kpis For Managers Scorecard Template PDF
This slide mentions customer key performance indicator used to formulate executive balanced scorecard. It includes retaining customers, fulfilling customer needs, and formulating loyalty programs. Presenting Customer Kpis For Managers Scorecard Template PDF to dispense important information. This template comprises three stages. It also presents valuable insights into the topics including Customer, Scorecard, Current. This is a completely customizable PowerPoint theme that can be put to use immediately. So, download it and address the topic impactfully.

Data Analytics Vector Icon Ppt Powerpoint Presentation Icon Designs
This is a data analytics vector icon ppt powerpoint presentation icon designs. This is a four stage process. The stages in this process are data visualization icon, data management icon.

Tiktok Digital Marketing Campaign Vet Potential Tiktok Influencers Key Metrics Download PDF
This slide represents the analysis of key performance indicators of the selected potential TikTok influencer by the marketers for their influencer marketing campaign. It includes details related to key metrics such as engagement rate, followers count etc. Do you have to make sure that everyone on your team knows about any specific topic I yes, then you should give Tiktok Digital Marketing Campaign Vet Potential Tiktok Influencers Key Metrics Download PDF a try. Our experts have put a lot of knowledge and effort into creating this impeccable Tiktok Digital Marketing Campaign Vet Potential Tiktok Influencers Key Metrics Download PDF. You can use this template for your upcoming presentations, as the slides are perfect to represent even the tiniest detail. You can download these templates from the Slidegeeks website and these are easy to edit. So grab these today

Market Data Integration Project Ppt Slides Styles
This is a market data integration project ppt slides styles. This is a four stage process. The stages in this process are market data integration project, technical proof of concept, hardware installed, contract negotiation.
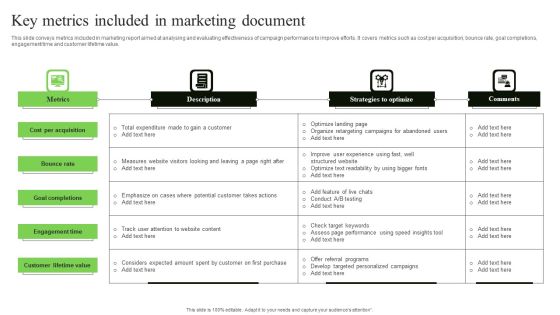
Key Metrics Included In Marketing Document Guidelines PDF
This slide conveys metrics included in marketing report aimed at analysing and evaluating effectiveness of campaign performance to improve efforts. It covers metrics such as cost per acquisition, bounce rate, goal completions, engagement time and customer lifetime value. Showcasing this set of slides titled Key Metrics Included In Marketing Document Guidelines PDF. The topics addressed in these templates are Cost Per Acquisition, Bounce Rate, Goal Completions . All the content presented in this PPT design is completely editable. Download it and make adjustments in color, background, font etc. as per your unique business setting.

Corporate Intelligence Business Analysis Advanced Analytics Final Output Results Source Template PDF
Deliver an awe-inspiring pitch with this creative corporate intelligence business analysis advanced analytics final output results source template pdf bundle. Topics like learning question, outcome, outcome metric, analysis approach, results, data source can be discussed with this completely editable template. It is available for immediate download depending on the needs and requirements of the user.

Bar Graph Displaying Profit Growth Powerpoint Slides
This PowerPoint template has been designed with six point?s bar graph with icons. This PPT slide can be used to prepare presentations for marketing reports and also for financial data analysis. You can download finance PowerPoint template to prepare awesome presentations.
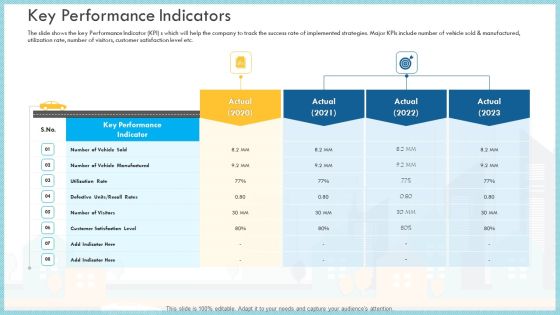
Loss Of Income And Financials Decline In An Automobile Organization Case Study Key Performance Indicators Brochure PDF
The slide shows the key Performance Indicator KPI s which will help the company to track the success rate of implemented strategies. Major KPIs include number of vehicle sold and manufactured, utilization rate, number of visitors, customer satisfaction level etc.Deliver an awe inspiring pitch with this creative loss of income and financials decline in an automobile organization case study key performance indicators brochure pdf bundle. Topics like key performance indicator, utilization rate, customer satisfaction level can be discussed with this completely editable template. It is available for immediate download depending on the needs and requirements of the user
Key Performance Indicators Accounting Ppt Powerpoint Presentation Portfolio Master Slide Cpb
This is a key performance indicators accounting ppt powerpoint presentation portfolio master slide cpb. This is a five stage process. The stages in this process are key performance indicators accounting.
Icon For Data Requirements For Analytics Pictures PDF
Persuade your audience using this icon for data requirements for analytics pictures pdf. This PPT design covers four stages, thus making it a great tool to use. It also caters to a variety of topics including icon for data requirements for analytics. Download this PPT design now to present a convincing pitch that not only emphasizes the topic but also showcases your presentation skills.
Statistical Data Icon Of Data Analytics Using Bar Graph Background PDF
Presenting statistical data icon of data analytics using bar graph background pdf to dispense important information. This template comprises four stages. It also presents valuable insights into the topics including statistical data icon of data analytics using bar graph. This is a completely customizable PowerPoint theme that can be put to use immediately. So, download it and address the topic impactfully.

Bulb With Business Analysis Icons Powerpoint Templates
This PowerPoint slide contains graphics of bulb diagram with icons. It helps to exhibit concepts of sales planning. Use this diagram to impart more clarity to data and to create more sound impact on viewers.
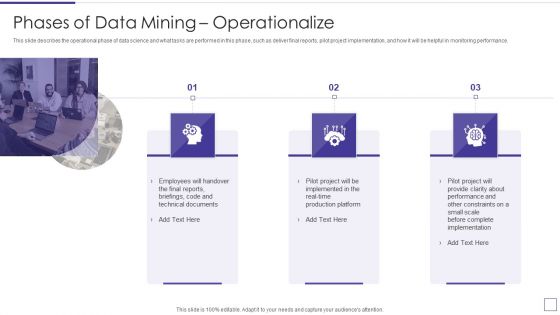
Data Mining Implementation Phases Of Data Mining Operationalize Professional PDF
This slide describes the operational phase of data science and what tasks are performed in this phase, such as deliver final reports, pilot project implementation, and how it will be helpful in monitoring performance.Presenting data mining implementation phases of data mining operationalize professional pdf to provide visual cues and insights. Share and navigate important information on three stages that need your due attention. This template can be used to pitch topics like employees will handover, technical documents, complete implementation In addtion, this PPT design contains high resolution images, graphics, etc, that are easily editable and available for immediate download.
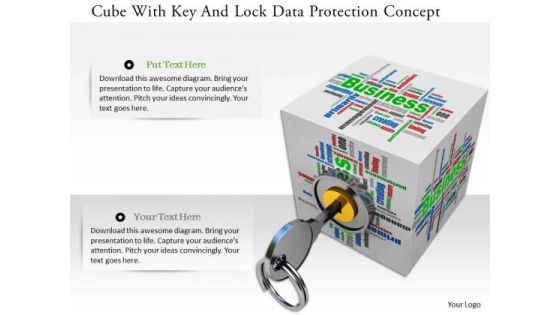
Stock Photo Cube With Key And Lock Data Protection Concept PowerPoint Slide
Graphic of cube with lock and key has been used to design this power point image template. This image template contains the concept of data protection. This image template can e used for data related presentations.

Scope Of Consumer Information Platform Categories Summary PDF
This slide focuses on three categories of customer data platform such as data, analytics and campaign with scope which includes loading, transforming, aggregating, reformatting data for managing customer data. Showcasing this set of slides titled scope of consumer information platform categories summary pdf. The topics addressed in these templates are data, analytics, campaign. All the content presented in this PPT design is completely editable. Download it and make adjustments in color, background, font etc. as per your unique business setting.
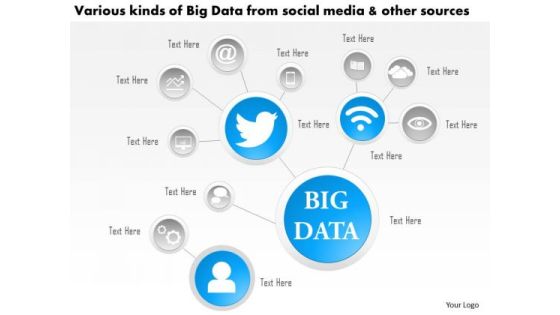
Business Diagram Various Kinds Of Big Data From Social Media And Other Sources Ppt Slide
This technology diagram contains the concept of big data analysis. This slide depicts various kinds of social media and other sources. Use this diagram for mobile and communication related presentations.
Business Diagram Test Tube With Colored Bubbles For Science Data Presentation Template
Test tubes with colored bubbles are used to design this power point template slide. This PPt slide contains the concept of science data analysis. Use this PPT slide for your business and science related presentations.

Working Of Predictive Analytics Models Forward Looking Analysis IT Elements PDF
This slide depicts the working of predictive analytics models that operates iteratively. The main phases in working include business understanding, data understanding, data preparation, modeling, evaluation, and deployment.Slidegeeks is here to make your presentations a breeze with Working Of Predictive Analytics Models Forward Looking Analysis IT Elements PDF With our easy-to-use and customizable templates, you can focus on delivering your ideas rather than worrying about formatting. With a variety of designs to choose from, you are sure to find one that suits your needs. And with animations and unique photos, illustrations, and fonts, you can make your presentation pop. So whether you are giving a sales pitch or presenting to the board, make sure to check out Slidegeeks first.

Post Implementation Other Operation And Financial Kpis Ppt Infographic Template PDF
The slide provides five years graphs 2020F-2024F forecasted number of major KPIs key performance indicators, that might help to track the performance of ABC Railway. Covered KPIs include Revenue, Total Passengers, operating income, customer satisfaction rate etc. Deliver an awe inspiring pitch with this creative post implementation other operation and financial kpis ppt infographic template pdf bundle. Topics like operating income, revenue, customer satisfaction can be discussed with this completely editable template. It is available for immediate download depending on the needs and requirements of the user.

Cybersecurity Statistical Data Insights Sample PDF
The given below slide presents the number of organizations being victim of cyber attacks in the previous year. It also includes category wise attack data in the form of donut chart. Pitch your topic with ease and precision using this Cybersecurity Statistical Data Insights Sample PDF. This layout presents information on Social Media Attacks, Malware Attacks, Phishing Attacks. It is also available for immediate download and adjustment. So, changes can be made in the color, design, graphics or any other component to create a unique layout.

Ready To Eat Food Market Analysis Pricing Strategy For Ready To Eat Market Structure PDF
The Ready To Eat Food Market Analysis Pricing Strategy For Ready To Eat Market Structure PDF is a compilation of the most recent design trends as a series of slides. It is suitable for any subject or industry presentation, containing attractive visuals and photo spots for businesses to clearly express their messages. This template contains a variety of slides for the user to input data, such as structures to contrast two elements, bullet points, and slides for written information. Slidegeeks is prepared to create an impression.

BPO Performance Improvement Action Plan Evaluate Performance By Monitoring Call Center Kpis Slides PDF
This slide highlights call center key performance indicators which can be used to evaluate organization and employee performance which includes service level, response time, abandonment rate, quality monitoring scores, customer satisfaction and first call resolution. From laying roadmaps to briefing everything in detail, our templates are perfect for you. You can set the stage with your presentation slides. All you have to do is download these easy to edit and customizable templates. BPO Performance Improvement Action Plan Evaluate Performance By Monitoring Call Center Kpis Slides PDF will help you deliver an outstanding performance that everyone would remember and praise you for. Do download this presentation today.
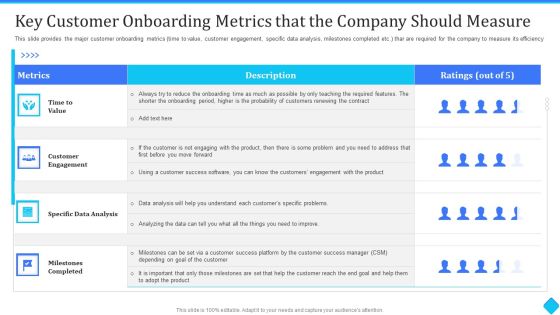
Key Customer Onboarding Metrics That The Company Should Measure Structure PDF
This slide provides the major customer onboarding metrics time to value, customer engagement, specific data analysis, milestones completed etc. thar are required for the company to measure its efficiency. Deliver an awe-inspiring pitch with this creative key customer onboarding metrics that the company should measure structure pdf bundle. Topics like time to value, customer engagement, specific data analysis can be discussed with this completely editable template. It is available for immediate download depending on the needs and requirements of the user.
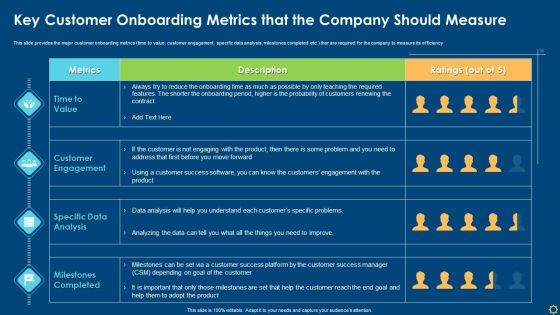
Key Customer Onboarding Metrics That The Company Should Measure Infographics PDF
This slide provides the major customer onboarding metrics time to value, customer engagement, specific data analysis, milestones completed etc. thar are required for the company to measure its efficiency Deliver an awe inspiring pitch with this creative key customer onboarding metrics that the company should measure infographics pdf bundle. Topics like customer engagement, data analysis, customer success can be discussed with this completely editable template. It is available for immediate download depending on the needs and requirements of the user.

Data Requirements For Analytics Icon With Solution Slides PDF
Persuade your audience using this data requirements for analytics icon with solution slides pdf. This PPT design covers four stages, thus making it a great tool to use. It also caters to a variety of topics including data requirements for analytics icon with solution. Download this PPT design now to present a convincing pitch that not only emphasizes the topic but also showcases your presentation skills.
Product Repositioning KPI Monitoring And Tracking Ppt PowerPoint Presentation File Infographic Template PDF
This slide highlights the key performance indicator of product repositioning which includes product sales, product demand in the market, position in the market and social media channels growth rate. If you are looking for a format to display your unique thoughts, then the professionally designed Product Repositioning KPI Monitoring And Tracking Ppt PowerPoint Presentation File Infographic Template PDF is the one for you. You can use it as a Google Slides template or a PowerPoint template. Incorporate impressive visuals, symbols, images, and other charts. Modify or reorganize the text boxes as you desire. Experiment with shade schemes and font pairings. Alter, share or cooperate with other people on your work. Download Product Repositioning KPI Monitoring And Tracking Ppt PowerPoint Presentation File Infographic Template PDF and find out how to give a successful presentation. Present a perfect display to your team and make your presentation unforgettable.

Business Improvement Process Plan With Strategy Implementation Ppt PowerPoint Presentation Gallery Layout Ideas PDF
Presenting this set of slides with name business improvement process plan with strategy implementation ppt powerpoint presentation gallery layout ideas pdf. This is a six stage process. The stages in this process are measure business impact, optimization, analysis reporting, strategy implementation, data mining. This is a completely editable PowerPoint presentation and is available for immediate download. Download now and impress your audience.

Customer Service Agent Performance Evaluate Performance By Monitoring Call Center Kpis Formats PDF
This slide highlights call center key performance indicators which can be used to evaluate organization and employee performance which includes service level, response time, abandonment rate, quality monitoring scores, customer satisfaction and first call resolution. If your project calls for a presentation, then Slidegeeks is your go-to partner because we have professionally designed, easy-to-edit templates that are perfect for any presentation. After downloading, you can easily edit Customer Service Agent Performance Evaluate Performance By Monitoring Call Center Kpis Formats PDF and make the changes accordingly. You can rearrange slides or fill them with different images. Check out all the handy templates.

Customer Analysis Diagram Example Ppt Background
This is a customer analysis diagram example ppt background. This is a eight stage process. The stages in this process are repair and append records, number, maintain data, email deliverability scoring, analysis of data completeness, customer base products, decision process, value drivers, customer analysis.

Illustration Of 9 Stages Market Analysis Diagram Business Plan PowerPoint Templates
We present our illustration of 9 stages market analysis diagram business plan PowerPoint templates.Download and present our Communication PowerPoint Templates because Our PowerPoint Templates and Slides will let you Hit the target. Go the full distance with ease and elan. Present our Marketing PowerPoint Templates because Our PowerPoint Templates and Slides will weave a web of your great ideas. They are gauranteed to attract even the most critical of your colleagues. Download and present our Business PowerPoint Templates because Our PowerPoint Templates and Slides help you meet the demand of the Market. Just browse and pick the slides that appeal to your intuitive senses. Present our Shapes PowerPoint Templates because Timeline crunches are a fact of life. Meet all deadlines using our PowerPoint Templates and Slides. Present our Process and Flows PowerPoint Templates because Our PowerPoint Templates and Slides will let you Clearly mark the path for others to follow.Use these PowerPoint slides for presentations relating to Market, sales, statistics, economy, target, achievement, corporate, business, success, presentation, diagram, finance, data, stock, analysis, flowchart, drawing, report, calculation, graph, illustration, economic, chart, money, pie-chart, planning, design, growth, pencil, company, competition, progress, investment, analyze, office, banking, financial, cash, exchange. The prominent colors used in the PowerPoint template are Yellow, Gray, Black.
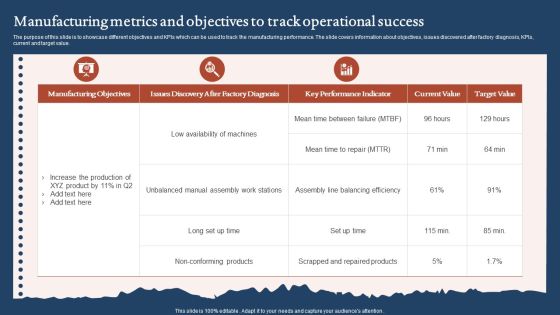
Manufacturing Metrics And Objectives To Track Operational Success Formats PDF
The purpose of this slide is to showcase different objectives and KPIs which can be used to track the manufacturing performance. The slide covers information about objectives, issues discovered after factory diagnosis, KPIs, current and target value. Showcasing this set of slides titled Manufacturing Metrics And Objectives To Track Operational Success Formats PDF. The topics addressed in these templates are Manufacturing Objectives, Key Performance Indicator, Target Value. All the content presented in this PPT design is completely editable. Download it and make adjustments in color, background, font etc. as per your unique business setting.

Introduction To Predictive Analytics Technology Forward Looking Analysis IT Structure PDF
This slide represents the predictive analytics introduction that is used for forecasts action, behaviors, and trends using recent and past information. It performs the operations such as data mining, text analytics, statistics, and modeling on structured and unstructured data.Get a simple yet stunning designed Introduction To Predictive Analytics Technology Forward Looking Analysis IT Structure PDF. It is the best one to establish the tone in your meetings. It is an excellent way to make your presentations highly effective. So, download this PPT today from Slidegeeks and see the positive impacts. Our easy-to-edit Introduction To Predictive Analytics Technology Forward Looking Analysis IT Structure PDF can be your go-to option for all upcoming conferences and meetings. So, what are you waiting for Grab this template today.
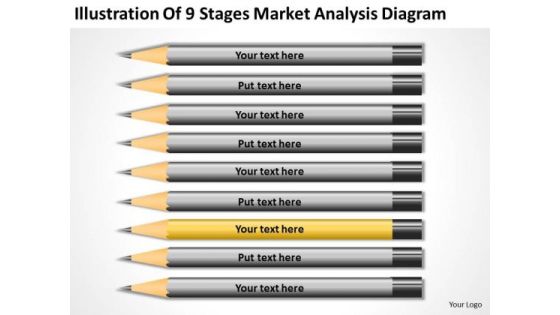
Illustration Of 9 Stages Market Analysis Diagram Ppt Business Plan Companies PowerPoint Slides
We present our illustration of 9 stages market analysis diagram ppt business plan companies PowerPoint Slides.Present our Communication PowerPoint Templates because Our PowerPoint Templates and Slides will definately Enhance the stature of your presentation. Adorn the beauty of your thoughts with their colourful backgrounds. Present our Marketing PowerPoint Templates because Our PowerPoint Templates and Slides offer you the needful to organise your thoughts. Use them to list out your views in a logical sequence. Download and present our Business PowerPoint Templates because Our PowerPoint Templates and Slides are aesthetically designed to attract attention. We gaurantee that they will grab all the eyeballs you need. Present our Shapes PowerPoint Templates because It is Aesthetically crafted by artistic young minds. Our PowerPoint Templates and Slides are designed to display your dexterity. Download our Process and Flows PowerPoint Templates because Our PowerPoint Templates and Slides offer you the widest possible range of options.Use these PowerPoint slides for presentations relating to Market, sales, statistics, economy, target, achievement, corporate, business, success, presentation, diagram, finance, data, stock, analysis, flowchart, drawing, report, calculation, graph, illustration, economic, chart, money, pie-chart, planning, design, growth, pencil, company, competition, progress, investment, analyze, office, banking, financial, cash, exchange. The prominent colors used in the PowerPoint template are Yellow, Gray, Black.
