AI PPT Maker
Templates
PPT Bundles
Design Services
Business PPTs
Business Plan
Management
Strategy
Introduction PPT
Roadmap
Self Introduction
Timelines
Process
Marketing
Agenda
Technology
Medical
Startup Business Plan
Cyber Security
Dashboards
SWOT
Proposals
Education
Pitch Deck
Digital Marketing
KPIs
Project Management
Product Management
Artificial Intelligence
Target Market
Communication
Supply Chain
Google Slides
Research Services
 One Pagers
All Categories
-
Home
- Customer Favorites
- Dashboard
Dashboard
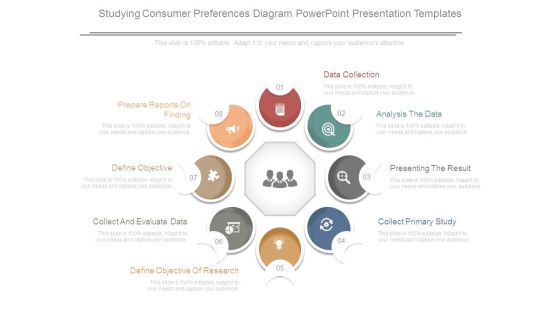
Studying Consumer Preferences Diagram Powerpoint Presentation Templates
This is a studying consumer preferences diagram powerpoint presentation templates. This is a eight stage process. The stages in this process are prepare reports on finding, define objective, collect and evaluate data, define objective of research, collect primary study, presenting the result, analysis the data, data collection.

Cloud Based Computing Analysis Data Complexity Slows Down The Business Process Professional PDF
This slide covers the current complex multi-cloud architecture with all their inherent complexity, fragility, and limitations that slow down the business process. Do you have an important presentation coming up Are you looking for something that will make your presentation stand out from the rest Look no further than Cloud Based Computing Analysis Data Complexity Slows Down The Business Process Professional PDF. With our professional designs, you can trust that your presentation will pop and make delivering it a smooth process. And with Slidegeeks, you can trust that your presentation will be unique and memorable. So why wait Grab Cloud Based Computing Analysis Data Complexity Slows Down The Business Process Professional PDF today and make your presentation stand out from the rest
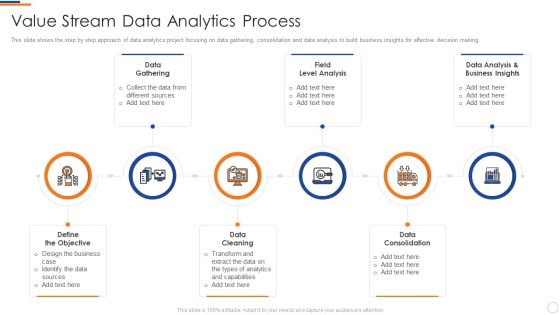
Business Intelligence And Big Value Stream Data Analytics Process Download PDF
This slide shows the step by step approach of data analytics project focusing on data gathering, consolidation and data analysis to build business insights for effective decision making. Presenting business intelligence and big value stream data analytics process download pdf to provide visual cues and insights. Share and navigate important information on six stages that need your due attention. This template can be used to pitch topics like data gathering, field level analysis, data analysis and business insights, data cleaning, data consolidation. In addtion, this PPT design contains high resolution images, graphics, etc, that are easily editable and available for immediate download.
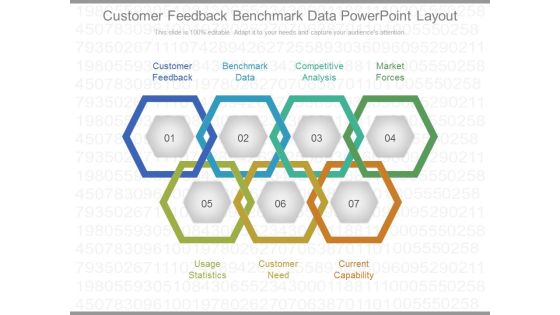
Customer Feedback Benchmark Data Powerpoint Layout
This is a customer feedback benchmark data powerpoint layout. This is a seven stage process. The stages in this process are customer feedback, benchmark data, competitive analysis, market forces, usage statistics, customer need, current capability.

Strategies To Future Plans Marketing Trends Icons PDF
This slide illustrates the set of tactics for any organization to implement and compete in the emerging marketing trends. It incorporates virtual reality, voice marketing, data driven decision making and blockchain technology. Persuade your audience using this Strategies To Future Plans Marketing Trends Icons PDF. This PPT design covers four stages, thus making it a great tool to use. It also caters to a variety of topics including Virtual Reality, Voice Marketing, Data Driven Decisions. Download this PPT design now to present a convincing pitch that not only emphasizes the topic but also showcases your presentation skills.

Crm Market Size Data Management Ppt PowerPoint Presentation File Microsoft
This is a crm market size data management ppt powerpoint presentation file microsoft. This is a four stage process. The stages in this process are crm, market, size, data, management.

Data Analysis Business PowerPoint Template 0910
binary data under a magnifying lens. digital illustration.
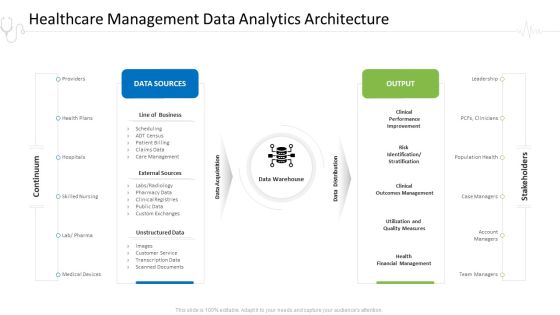
Hospital Administration Healthcare Management Data Analytics Architecture Ppt Infographics Information PDF
This is a hospital administration healthcare management data analytics architecture ppt infographics information pdf template with various stages. Focus and dispense information on two stages using this creative set, that comes with editable features. It contains large content boxes to add your information on topics like line of business, external sources, management, performance improvement, financial management. You can also showcase facts, figures, and other relevant content using this PPT layout. Grab it now.

Various Power Meter Panel In Factory Control Room Ppt PowerPoint Presentation Gallery Smartart PDF
Pitch your topic with ease and precision using this various power meter panel in factory control room ppt powerpoint presentation gallery smartart pdf. This layout presents information on various power meter panel in factory control room. It is also available for immediate download and adjustment. So, changes can be made in the color, design, graphics or any other component to create a unique layout.

Tactical Approach For Vendor Reskilling Key Metrices To Measure The Supplier Performance Designs PDF
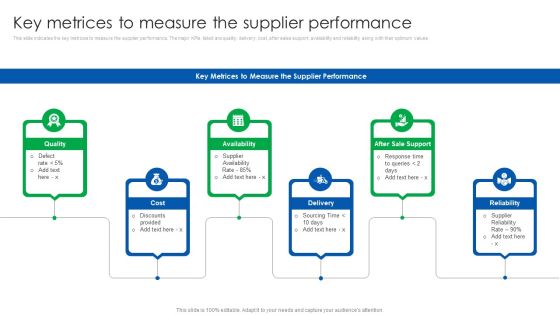
This slide indicates the key metrices to measure the supplier performance. The major KPIs listed are quality, delivery, cost, after sales support, availability and reliability along with their optimum values. Slidegeeks is here to make your presentations a breeze with Tactical Approach For Vendor Reskilling Key Metrices To Measure The Supplier Performance Designs PDF With our easy to use and customizable templates, you can focus on delivering your ideas rather than worrying about formatting. With a variety of designs to choose from, you are sure to find one that suits your needs. And with animations and unique photos, illustrations, and fonts, you can make your presentation pop. So whether you are giving a sales pitch or presenting to the board, make sure to check out Slidegeeks first.
Vendor Relationship Management Strategic Plan Key Metrices To Measure The Supplier Performance Formats PDF
This slide indicates the key metrices to measure the supplier performance. The major KPIs listed are quality, delivery, cost, after sales support, availability and reliability along with their optimum values. Slidegeeks is here to make your presentations a breeze with Vendor Relationship Management Strategic Plan Key Metrices To Measure The Supplier Performance Formats PDF With our easy to use and customizable templates, you can focus on delivering your ideas rather than worrying about formatting. With a variety of designs to choose from, you are sure to find one that suits your needs. And with animations and unique photos, illustrations, and fonts, you can make your presentation pop. So whether you are giving a sales pitch or presenting to the board, make sure to check out Slidegeeks first.

Checklist Showcasing Staff Strategy Data Management Process Information PDF
This slide represents checklist showcasing workforce data management process which helps optimize employee activity scheduling. It provides information regarding employee performance management, field service training , data collection, recruitment and data analytics. Persuade your audience using this Checklist Showcasing Staff Strategy Data Management Process Information PDF. This PPT design covers One stage, thus making it a great tool to use. It also caters to a variety of topics including Recruitment Budgeting, Scheduling Data Analytics. Download this PPT design now to present a convincing pitch that not only emphasizes the topic but also showcases your presentation skills.

Data Mining In CRM Customer Relationship Management CRM Graphics PDF
Deliver and pitch your topic in the best possible manner with this data mining in crm customer relationship management crm graphics pdf. Use them to share invaluable insights on analysis, strategies, profitable, target marketing and impress your audience. This template can be altered and modified as per your expectations. So, grab it now.

Centralized Data Science Team Structure Model Summary PDF
This slide represents the model showing the centralized data science team. It includes key stakeholders such as finance, product, supply, marketing and operations team lead.Showcasing this set of slides titled Centralized Data Science Team Structure Model Summary PDF. The topics addressed in these templates are Marketing Team, Finance Team, Operations Team. All the content presented in this PPT design is completely editable. Download it and make adjustments in color, background, font etc. as per your unique business setting.
Retail Data Analysis Diagram Ppt Sample File
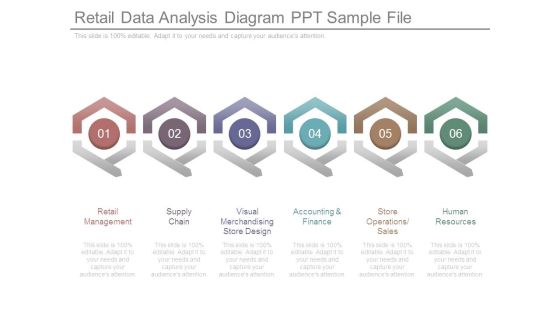
This is a retail data analysis diagram ppt sample file. This is a six stage process. The stages in this process are retail management, supply chain, visual merchandising store design, accounting and finance, store operations sales, human resources.

Information Analysis And BI Playbook Data Science Depends On Six Critical Elements Designs PDF
This template depicts that data science depends on six critical elements, including analytic opportunities, data, analytic techniques, people, technology, and culture, also known as ADAPT C. There are so many reasons you need a Information Analysis And BI Playbook Data Science Depends On Six Critical Elements Designs PDF. The first reason is you can not spend time making everything from scratch, Thus, Slidegeeks has made presentation templates for you too. You can easily download these templates from our website easily.

Areas For Data Analytics Application With Icons Ppt PowerPoint Presentation Gallery Inspiration PDF
Persuade your audience using this areas for data analytics application with icons ppt powerpoint presentation gallery inspiration pdf. This PPT design covers six stages, thus making it a great tool to use. It also caters to a variety of topics including manufacturing, e commerce, finance . Download this PPT design now to present a convincing pitch that not only emphasizes the topic but also showcases your presentation skills.
Integrated Data Architecture For Omnichannel Banking Services Information PDF
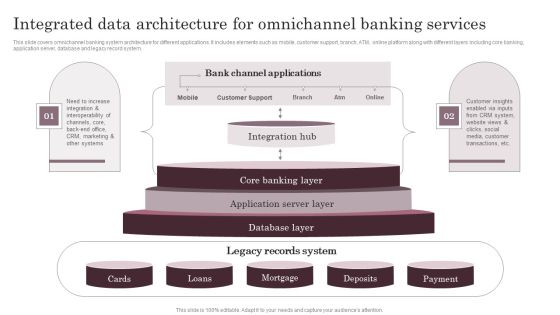
This slide covers omnichannel banking system architecture for different applications. It includes elements such as mobile, customer support, branch, ATM, online platform along with different layers including core banking, application server, database and legacy record system. Are you in need of a template that can accommodate all of your creative concepts This one is crafted professionally and can be altered to fit any style. Use it with Google Slides or PowerPoint. Include striking photographs, symbols, depictions, and other visuals. Fill, move around, or remove text boxes as desired. Test out color palettes and font mixtures. Edit and save your work, or work with colleagues. Download Integrated Data Architecture For Omnichannel Banking Services Information PDF and observe how to make your presentation outstanding. Give an impeccable presentation to your group and make your presentation unforgettable.

Data Interpretation And Analysis Playbook How To Overcome Automated Discovery Of Insights Challenges Rules PDF
This template illustrates that business needs is an intelligent analytics platform that can automatically discover valuable insights from the data. It also depicts that next-generation analytics platform acts as an analyst for the organizations. Deliver an awe inspiring pitch with this creative data interpretation and analysis playbook how to overcome automated discovery of insights challenges rules pdf bundle. Topics like opportunities, organizations, analytics, business can be discussed with this completely editable template. It is available for immediate download depending on the needs and requirements of the user.
Expert Systems Advanced Analytics Final Output Results Analysis Ideas PDF
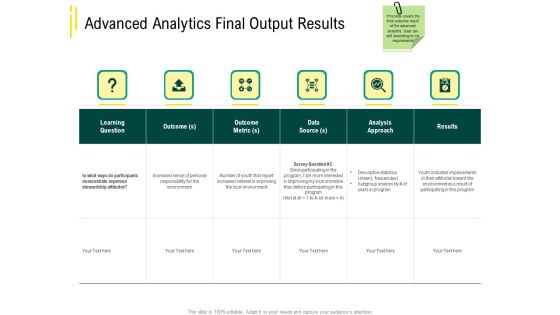
This is a expert systems advanced analytics final output results analysis ideas pdf template with various stages. Focus and dispense information on six stages using this creative set, that comes with editable features. It contains large content boxes to add your information on topics like learning question, data source, analysis approach. You can also showcase facts, figures, and other relevant content using this PPT layout. Grab it now.

Comparative Analysis Of Quantitative And Qualitative Data Analysis Pictures PDF
Presenting Comparative Analysis Of Quantitative And Qualitative Data Analysis Pictures PDF to dispense important information. This template comprises five stages. It also presents valuable insights into the topics including Data Format, Analysis, Definition. This is a completely customizable PowerPoint theme that can be put to use immediately. So, download it and address the topic impactfully.

Data Analytics For Business Operations Administration Icon Professional PDF
Presenting Data Analytics For Business Operations Administration Icon Professional PDF to dispense important information. This template comprises four stages. It also presents valuable insights into the topics including Business Operations Administration Icon, Data Analytics. This is a completely customizable PowerPoint theme that can be put to use immediately. So, download it and address the topic impactfully.

Financial Data And Analytics Expansion Icon Mockup PDF
Persuade your audience using this Financial Data And Analytics Expansion Icon Mockup PDF. This PPT design covers three stages, thus making it a great tool to use. It also caters to a variety of topics including Financial Data, Analytics, Expansion Icon. Download this PPT design now to present a convincing pitch that not only emphasizes the topic but also showcases your presentation skills.

Big Data And Analytics Framework Layers Icon Formats PDF
Presenting Big Data And Analytics Framework Layers Icon Formats PDF to dispense important information. This template comprises three stages. It also presents valuable insights into the topics including Big Data Analytics, Framework, Layers. This is a completely customizable PowerPoint theme that can be put to use immediately. So, download it and address the topic impactfully.

Concept Of Ontology In The Semantic Web How Does It Add Meaning To Data On The Web Inspiration PDF
This slide represents how the semantic web adds meaning to information on the web so that it can only provide accurate results to user queries. The techniques include vocabularies, ontologies, RDF prototype, web ontology language, etc. Crafting an eye catching presentation has never been more straightforward. Let your presentation shine with this tasteful yet straightforward Concept Of Ontology In The Semantic Web How Does It Add Meaning To Data On The Web Inspiration PDF template. It offers a minimalistic and classy look that is great for making a statement. The colors have been employed intelligently to add a bit of playfulness while still remaining professional. Construct the ideal Concept Of Ontology In The Semantic Web How Does It Add Meaning To Data On The Web Inspiration PDF that effortlessly grabs the attention of your audience Begin now and be certain to wow your customers.
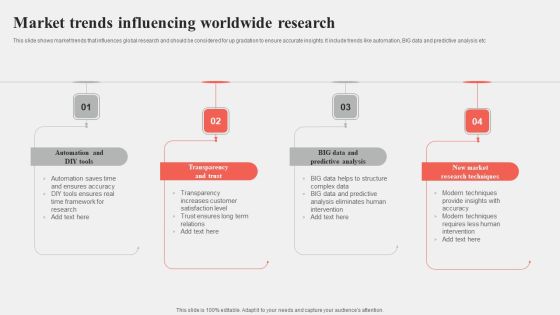
Market Trends Influencing Worldwide Research Themes PDF
This slide shows market trends that influences global research and should be considered for up gradation to ensure accurate insights. It include trends like automation, BIG data and predictive analysis etc Persuade your audience using this Market Trends Influencing Worldwide Research Themes PDF. This PPT design covers four stages, thus making it a great tool to use. It also caters to a variety of topics including Transparency, Predictive Analysis, Research Techniques. Download this PPT design now to present a convincing pitch that not only emphasizes the topic but also showcases your presentation skills.

Qualitative Data Process Sample Diagram Example
This is a qualitative data process sample diagram example. This is a three stage process. The stages in this process are data collection, process data, analysis data, listen, observe, interview, audio recording, visual recording, jotted notes, field notes, sort and classify, open coding, axial coding, selective coding, processed data.
Three Months Data Analysis Procedure Roadmap Icons
We present our three months data analysis procedure roadmap icons. This PowerPoint layout is easy to edit so you can change the font size, font type, color, and shape conveniently. In addition to this, the PowerPoint layout is Google Slides compatible, so you can share it with your audience and give them access to edit it. Therefore, download and save this well researched three months data analysis procedure roadmap icons in different formats like PDF, PNG, and JPG to smoothly execute your business plan.

Flowchart For Quantitative Data Analysis Collection And Analysis Professional PDF
This slide presents a flowchart for qualitative and quantitative data collection and analysis to examine certain findings in the process. It includes stages such as qualitative and quantitative data collection, analyzation and interpretation. Presenting Flowchart For Quantitative Data Analysis Collection And Analysis Professional PDF to dispense important information. This template comprises one stages. It also presents valuable insights into the topics including Interpretation Results, Analyze Qualitative Data, Collect Qualitative Data. This is a completely customizable PowerPoint theme that can be put to use immediately. So, download it and address the topic impactfully.
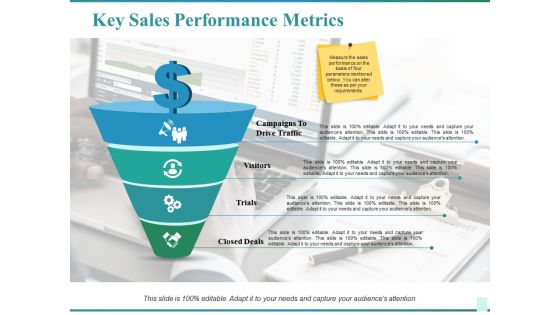
Key Sales Performance Metrics Ppt PowerPoint Presentation Infographics Show
This is a key sales performance metrics ppt powerpoint presentation infographics show. This is a four stage process. The stages in this process are campaigns to drive traffic, visitors, trials, closed deals, business, icons.
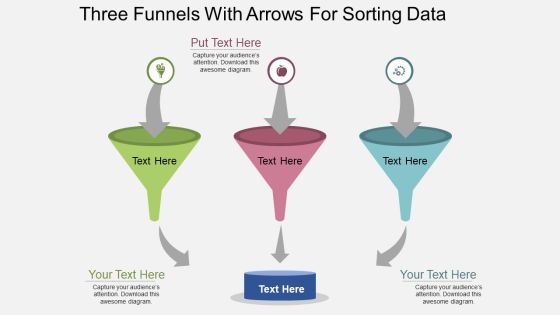
Three Funnels With Arrows For Sorting Data Powerpoint Template
Communicate with your group through this slide of three funnels. Download this PowerPoint template to exhibit management tools. This PPT slide design will facilitate understanding of your views.

Business Intelligence Framework For Effective Firm Data Collection Ideas PDF
Presenting business intelligence framework for effective firm data collection ideas pdf to dispense important information. This template comprises four stages. It also presents valuable insights into the topics including operational systems, data acquisition, data storage, analytics. This is a completely customizable PowerPoint theme that can be put to use immediately. So, download it and address the topic impactfully.

Business Data Analysis Target Icons PDF
Presenting business data analysis target icons pdf to provide visual cues and insights. Share and navigate important information on four stages that need your due attention. This template can be used to pitch topics like target. In addtion, this PPT design contains high resolution images, graphics, etc, that are easily editable and available for immediate download.

Business Data Analysis Timeline Portrait PDF
This is a business data analysis timeline portrait pdf template with various stages. Focus and dispense information on four stages using this creative set, that comes with editable features. It contains large content boxes to add your information on topics like timeline 2017 to 2021. You can also showcase facts, figures, and other relevant content using this PPT layout. Grab it now.

Business Data Analysis Cloud Topics PDF
This is a business data analysis cloud topics pdf template with various stages. Focus and dispense information on six stages using this creative set, that comes with editable features. It contains large content boxes to add your information on topics like Technology. You can also showcase facts, figures, and other relevant content using this PPT layout. Grab it now.

Business Data Analysis Clustered Column Template PDF
Deliver an awe inspiring pitch with this creative business data analysis clustered column template pdf bundle. Topics like clustered column can be discussed with this completely editable template. It is available for immediate download depending on the needs and requirements of the user.

Business Data Analysis Roadmap Graphics PDF
This is a business data analysis roadmap graphics pdf template with various stages. Focus and dispense information on four stages using this creative set, that comes with editable features. It contains large content boxes to add your information on topics like roadmap. You can also showcase facts, figures, and other relevant content using this PPT layout. Grab it now.
Maintenance Of Computer Server With Control Panel And Gears Icon Ppt PowerPoint Presentation File Ideas PDF
Persuade your audience using this maintenance of computer server with control panel and gears icon ppt powerpoint presentation file ideas pdf. This PPT design covers three stages, thus making it a great tool to use. It also caters to a variety of topics including maintenance of computer server with control panel and gears icon. Download this PPT design now to present a convincing pitch that not only emphasizes the topic but also showcases your presentation skills.

Social Networks Marketing To Improve Youtube Advertising Audience Overview Report Microsoft PDF
This slide represents statistical data representing the usage of YouTube by audience worldwide. It includes details related to potential reach of ads on YouTube, YouTube ad reach vs total population etc. Do you have an important presentation coming up Are you looking for something that will make your presentation stand out from the rest Look no further than Social Networks Marketing To Improve Youtube Advertising Audience Overview Report Microsoft PDF. With our professional designs, you can trust that your presentation will pop and make delivering it a smooth process. And with Slidegeeks, you can trust that your presentation will be unique and memorable. So why wait Grab Social Networks Marketing To Improve Youtube Advertising Audience Overview Report Microsoft PDF today and make your presentation stand out from the rest.

Business Diagram Big Data Big Insight From Data Feeds To Explain The Benefits Ppt Slide
Explain the benefits of big data analysis and data feeds with this technology diagram. This slide contains the graphic of scale with big data and big insight. Use this slide your data information and measurement related presentations.

1 Cloud Service Models Cloud Networking Iaas Paas Saas As A Service Models Ppt Slide
This image slide displays cloud computing three fundamental service model. This image slide has been designed with graphic of textboxes to display various layers of networking in infrastructure, platform and software service model. Use this image slide, in your presentations to express views on cloud computing, networking and technology. This image slide will impart professional appearance to your presentations.
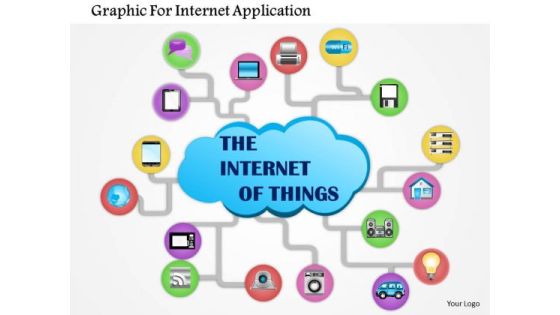
Business Diagram Graphic For Internet Application Presentation Template
This business diagram has been designed with icons of internet applications. It contains network of internet icons. This diagram can be used to depict internet options. Use this slide for your internet and technology based presentations.
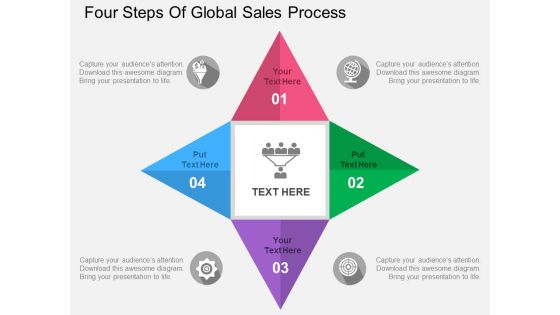
Four Steps Of Global Sales Process Powerpoint Templates
The above PPT slide contains four steps infographic layout. This PPT slide helps to portray steps of global sales process. Download this slide to make professional presentations.
Four Tags With Medical And Healthcare Icons Powerpoint Templates
This PowerPoint template has been designed with graphics of four tags. Download this slide to exhibit medical and healthcare concepts. This slide is innovatively designed to highlight your worthy views.

Magnifier For Search Engine Optimization Techniques Powerpoint Template
Visually support your presentation with our above template showing magnifier with SEO text and icons. This slide has been professionally designed to present SEO techniques. This template offers an excellent background to build impressive presentation.
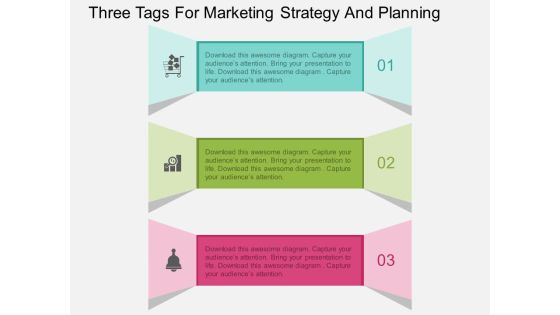
Three Tags For Marketing Strategy And Planning Powerpoint Template
Our compelling template consists with diagram of three text tags and icons. This slide has been professionally designed to display marketing strategy and planning. This template offers an excellent background to build impressive presentation.
Funnel Diagram With Technology Icons Powerpoint Template
Our above business slide has been designed with layout of funnel diagram with technology icons. This PPT diagram helps to portray digital marketing concept You can present your opinions using this impressive slide.
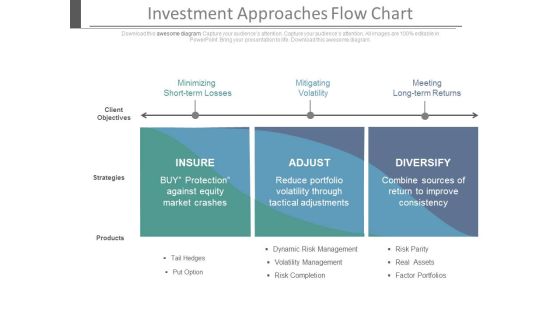
Investment Approaches Flow Chart Ppt Slides
This is an investment approached flow chart ppt slides. This is a three stage process. The stages in this process are marketing, business, success.

Social Media Content Portfolio Resources Presentation Visuals Ppt Slides
This is a social media content portfolio resources presentation visuals ppt slide. This is a five stage process. The stages in this process are business, marketing.
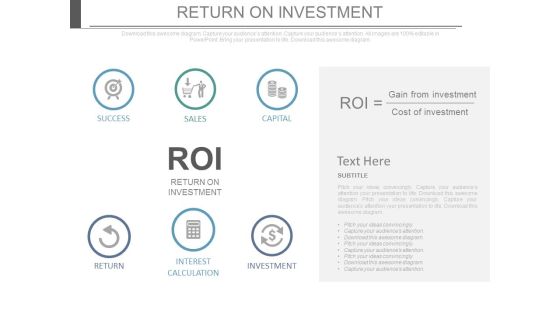
Return On Investment Business Ppt Slides
This is a return on investment business ppt slides. This is a six stage process. The stages in this process are finance, business, marketing.

Channel Management And Sales Process Ppt Presentation
This is a channel management and sales process ppt presentation. This is a eight stage process. The stages in this process are marketing, business, process and flows.

Product Development Test Marketing Ppt Slides
This is a product development test marketing ppt slides. This is a three stage process. The stages in this process are arrows, business, marketing, shapes.

Social Media Influencers Abandoned Carts Timeline Ppt Slides Styles
This is a social media influencers abandoned carts timeline ppt slides styles. This is a five stage process. The stages in this process are time planning, success, business.

Whole Product Powerpoint Slide Designs Download
This is a whole product powerpoint slide designs download. This is a five stage process. The stages in this process are customer requirements, whole product, expected product, ideal product, purchase from manufacturer.

Comprehending Site Crawling Indexing Sitemaps In Google Search Console Training Ppt
Presenting Comprehending Site Crawling, Indexing, Sitemaps in Google Search Console. This slide is well crafted and designed by our PowerPoint specialists. This PPT presentation is thoroughly researched by the experts, and every slide consists of appropriate content. You can add or delete the content as per your need.

Header Tags In On Page SEO Training Ppt
Presenting Header Tags in On-Page SEO. These slides are well crafted and designed by our PowerPoint specialists. The PPT presentation is thoroughly researched by the experts, and every slide consists of appropriate content. You can add or delete the content as per your need.
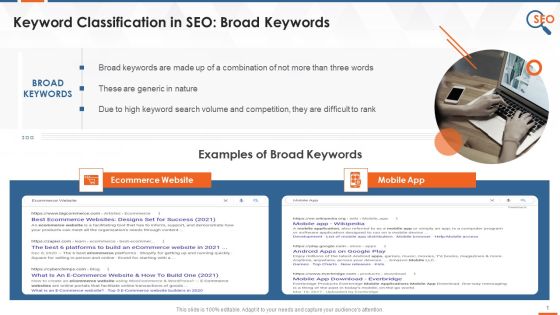
Keyword Classification For Search Engine Optimization Training Ppt
Presenting Keyword Classification for Search Engine Optimization. This set of slides is well crafted and designed by our PowerPoint specialists. These PPT presentations are thoroughly researched by the experts, and every slide consists of appropriate content. All slides are customizable. You can add or delete the content as per your need. Download this professionally designed business presentation, add your content, and present it confidently.

Mcqs On Google Search Console Training Ppt
Presenting MCQs on Google Search Console. These slides are well crafted and designed by our PowerPoint specialists. The PPT presentation is thoroughly researched by the experts, and every slide consists of appropriate content. You can add or delete the content as per your need.

Mcqs On SEO Keyword Research Training Ppt
Presenting MCQs on SEO Keyword Research. These slides are 100 percentage made in PowerPoint and are compatible with all screen types and monitors. They also support Google Slides. Premium Customer Support is available. Suitable for use by managers, employees, and organizations. These slides are easily customizable. Our PowerPoint experts have included all the necessary templates, designs, icons, graphs, and other essential material in the PPT deck.

Meta And Title Tags In On Page SEO Training Ppt
Presenting Meta and Title Tags in On-Page SEO. This slide is well crafted and designed by our PowerPoint specialists. This PPT presentation is thoroughly researched by the experts, and every slide consists of appropriate content. You can add or delete the content as per your need.
