Dashboard
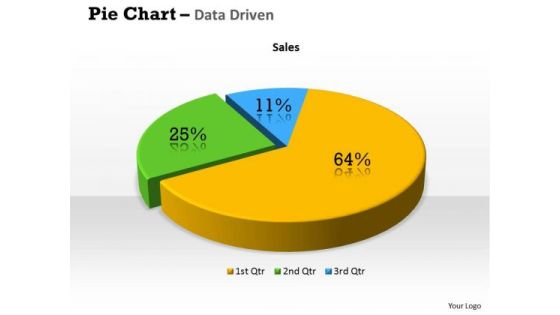
Quantitative Data Analysis 3d Percentage Ratio Pie Chart PowerPoint Templates
Plan Your Storyboard With Our quantitative data analysis 3d percentage ratio pie chart Powerpoint Templates . Give An Outline To The Solutions You Have.

Quantitative Data Analysis Bar Chart For Different Categories PowerPoint Templates
Make Some Dough With Our quantitative data analysis bar chart for different categories Powerpoint Templates . Your Assets Will Rise Significantly.
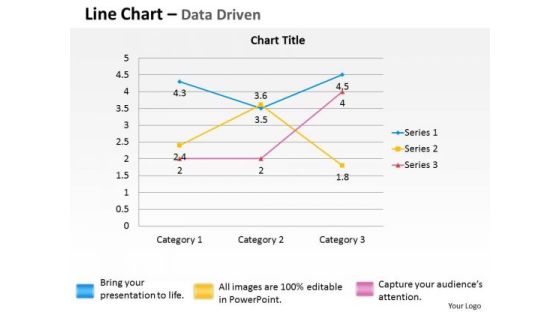
Quantitative Data Analysis Driven Economic Line Chart PowerPoint Slides Templates
Break The Deadlock With Our quantitative data analysis driven economic line chart powerpoint slides Templates . Let The Words Start To Flow.

Data Lake Architecture Future Of Data Analysis How To Implement Data Lake In Azure Architecture Slides PDF
This slide describes the data lakes on Azure architecture by covering details of data gathering, ingestion layer, stage and optimization of data and expose information.Deliver an awe inspiring pitch with this creative Data Lake Architecture Future Of Data Analysis How To Implement Data Lake In Azure Architecture Slides PDF bundle. Topics like Data Processing, Storage And Analytics, Governance And Security can be discussed with this completely editable template. It is available for immediate download depending on the needs and requirements of the user.

Business Data Analysis Chart Comparing Multiple Entities PowerPoint Templates
Analyze Ailments On Our business data analysis chart comparing multiple entities Powerpoint Templates. Bring Out The Thinking Doctor In You. Dock Your Thoughts With Our Financial Analysis . They Will Launch Them Into Orbit.
Employee Key Performance Indicators Performance Indicators Report Icon Structure PDF
Showcasing this set of slides titled Employee Key Performance Indicators Performance Indicators Report Icon Structure PDF The topics addressed in these templates are Employee Key, Performance, Indicators Performance All the content presented in this PPT design is completely editable. Download it and make adjustments in color, background, font etc. as per your unique business setting.

Toolkit For Data Science And Analytics Transition Data Analytics Value Stream Chain Pictures PDF
This slide illustrates the series of activities required for analyzing the data. It contains information such as data preparation, exploratory analysis, and predictive analytics etc. If you are looking for a format to display your unique thoughts, then the professionally designed Toolkit For Data Science And Analytics Transition Data Analytics Value Stream Chain Pictures PDF is the one for you. You can use it as a Google Slides template or a PowerPoint template. Incorporate impressive visuals, symbols, images, and other charts. Modify or reorganize the text boxes as you desire. Experiment with shade schemes and font pairings. Alter, share or cooperate with other people on your work. Download Toolkit For Data Science And Analytics Transition Data Analytics Value Stream Chain Pictures PDF and find out how to give a successful presentation. Present a perfect display to your team and make your presentation unforgettable.

Data Warehousing IT Data Warehouse Architecture With Staging Area Ppt Styles Objects PDF
This slide describes a data warehouse architecture with a staging area and how staging helps clean and process the information before entering it into the data warehouse. Presenting data warehousing it data warehouse architecture with staging area ppt styles objects pdf to provide visual cues and insights. Share and navigate important information on three stages that need your due attention. This template can be used to pitch topics like operational system, analysis, reporting, mining, flat files. In addtion, this PPT design contains high resolution images, graphics, etc, that are easily editable and available for immediate download.

Key Steps To Develop Effective Data Analytics Infrastructure Inspiration PDF
This slide includes key steps for developing a data analytics ecosystem aimed at improving innovation and customer experience. These steps include understand data ecosystem, collect data, store data, process data, and utilise data. Presenting Key Steps To Develop Effective Data Analytics Infrastructure Inspiration PDF to dispense important information. This template comprises five stages. It also presents valuable insights into the topics including Understand Data Ecosystem, Collect Data, Store Data, Process Data, Utilise Data. This is a completely customizable PowerPoint theme that can be put to use immediately. So, download it and address the topic impactfully.

Predictive Analytics In The Age Of Big Data Predictive Analytics In Align Sales And Marketing Better Topics PDF
This slide describes how predictive analytics can help align sales and marketing better. Predictive analytics can help get insights from sales and marketing teams that can help to improve several factors, including handing off leads, communication of promotions, and so on. This modern and well arranged Predictive Analytics In The Age Of Big Data Predictive Analytics In Align Sales And Marketing Better Topics PDF provides lots of creative possibilities. It is very simple to customize and edit with the Powerpoint Software. Just drag and drop your pictures into the shapes. All facets of this template can be edited with Powerpoint no extra software is necessary. Add your own material, put your images in the places assigned for them, adjust the colors, and then you can show your slides to the world, with an animated slide included.
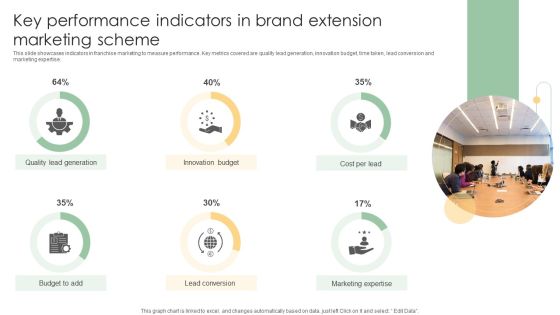
Key Performance Indicators In Brand Extension Marketing Scheme Ideas PDF
This slide showcases indicators in franchise marketing to measure performance. Key metrics covered are quality lead generation, innovation budget, time taken, lead conversion and marketing expertise.Pitch your topic with ease and precision using this Key Performance Indicators In Brand Extension Marketing Scheme Ideas PDF. This layout presents information on Quality Lead Generation, Innovation Budget, Lead Conversion. It is also available for immediate download and adjustment. So, changes can be made in the color, design, graphics or any other component to create a unique layout.

Crm Sales Leads With Marketing Ppt PowerPoint Presentation Picture
This is a crm sales leads with marketing ppt powerpoint presentation picture. This is a five stage process. The stages in this process are inquiry, marketing qualified lead, sales accepted lead, sales qualified lead, close.

Market Competitiveness Template 1 Ppt PowerPoint Presentation Slides Template
This is a market competitiveness template 1 ppt powerpoint presentation slides template. This is a three stage process. The stages in this process are financial position, advertising, market share, brand image, customer loyalty.
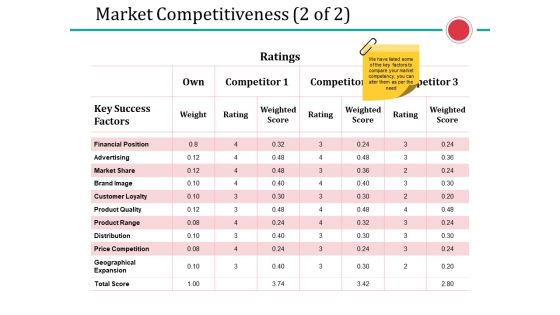
Market Competitiveness Template 2 Ppt PowerPoint Presentation Portfolio Graphic Tips
This is a market competitiveness template 2 ppt powerpoint presentation portfolio graphic tips. This is a three stage process. The stages in this process are financial position, advertising, market share, brand image, customer loyalty.

Digital Marketing Data Expansion Trends Icon Sample PDF
Presenting Digital Marketing Data Expansion Trends Icon Sample PDF to dispense important information. This template comprises three stages. It also presents valuable insights into the topics including Digital Marketing, Data Expansion, Trends Icon. This is a completely customizable PowerPoint theme that can be put to use immediately. So, download it and address the topic impactfully.
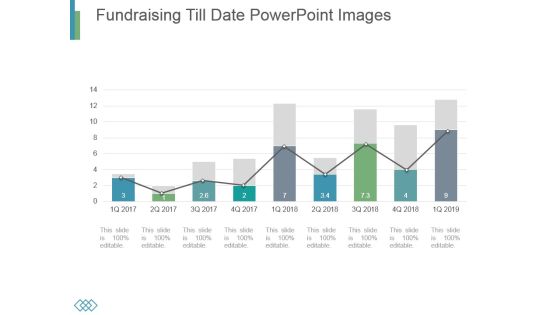
Fundraising Till Date Powerpoint Images
This is a fundraising till date powerpoint images. This is a nine stage process. The stages in this process are business, marketing, growth, timeline, management.
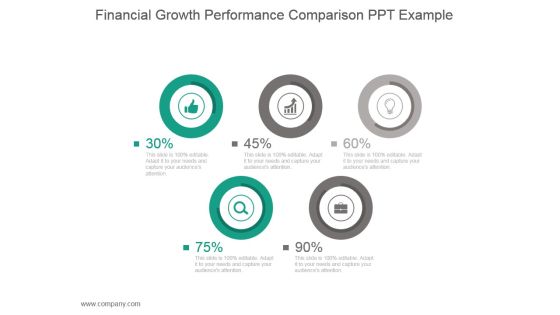
Financial Growth Performance Comparison Ppt Example
This is a financial growth performance comparison ppt example. This is a five stage process. The stages in this process are business, strategy, marketing, finance, icons.

Financial Growth Ppt PowerPoint Presentation Layout
This is a financial growth ppt powerpoint presentation layout. This is a three stage process. The stages in this process are business, marketing, finance, percentage, growth.
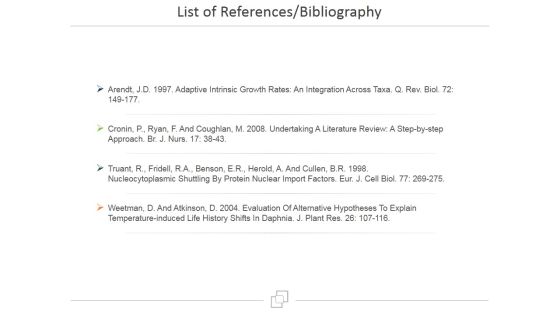
List Of References Bibliography Ppt PowerPoint Presentation Themes
This is a list of references bibliography ppt powerpoint presentation themes. This is a four stage process. The stages in this process are business, list, marketing, knowledge, information.

Corporate Workforce Management Marketing And Sales Ppt PowerPoint Presentation Information
This is a corporate workforce management marketing and sales ppt powerpoint presentation information. This is a two stage process. The stages in this process are women, executive, finance, human resource, marketing, operation, sales, median salary for, people, part time staff, full time equivalent staff.
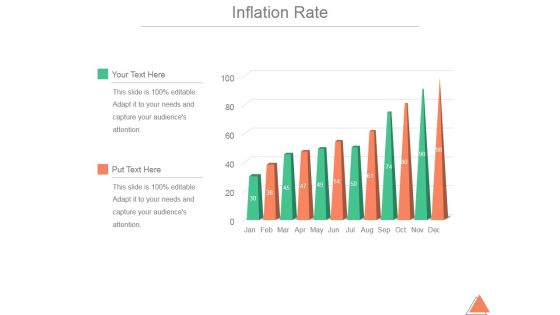
Inflation Rate Template 1 Ppt PowerPoint Presentation Influencers
This is a inflation rate template 1 ppt powerpoint presentation influencers. This is a twelve stage process. The stages in this process are business, marketing, growth, management, inflation rate.
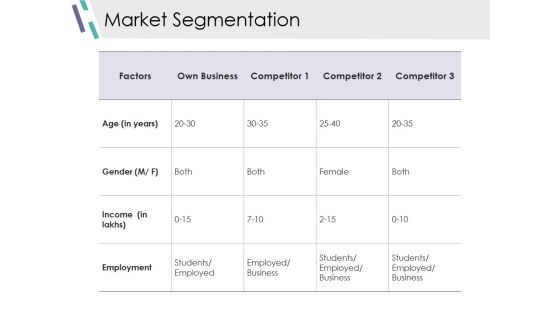
Market Segmentation Ppt PowerPoint Presentation Infographics Background Image
This is a market segmentation ppt powerpoint presentation infographics background image. This is a four stage process. The stages in this process are factors, own business, age, gender, employment.
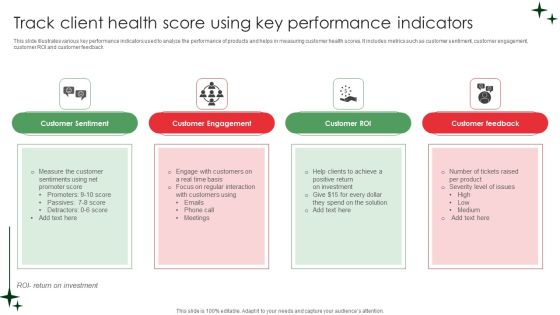
Track Client Health Score Using Key Performance Indicators Summary PDF
This slide illustrates various key performance indicators used to analyze the performance of products and helps in measuring customer health scores. It includes metrics such as customer sentiment, customer engagement, customer ROI and customer feedback. Persuade your audience using this Track Client Health Score Using Key Performance Indicators Summary PDF. This PPT design covers four stages, thus making it a great tool to use. It also caters to a variety of topics including Customer Sentiment, Customer Engagement, Customer ROI. Download this PPT design now to present a convincing pitch that not only emphasizes the topic but also showcases your presentation skills.

Data Analytics Process Ppt PowerPoint Presentation Background Designs
This is a data analytics process ppt powerpoint presentation background designs. This is a four stage process. The stages in this process are data, decision, insight, info.

Business Diagram Map Shuffle Reduce Phases Shown In Big Data Analytic Processing Ppt Slide
This technology slide has been designed with graphic of map and data text. This diagram helps to depict concept of data analysis and processing. Use this diagram slide for computer technology related presentations.

Checklist For Big Data Analytics Procedure Graphics PDF
This slide showcase checklist for development of big data analysis process for various phases. It includes phases such as business understanding, data understanding, data preparation, modeling, evaluation and deployment Presenting Checklist For Big Data Analytics Procedure Graphics PDF to dispense important information. This template comprises three stages. It also presents valuable insights into the topics including Procedure, Big Data, Checklist. This is a completely customizable PowerPoint theme that can be put to use immediately. So, download it and address the topic impactfully.
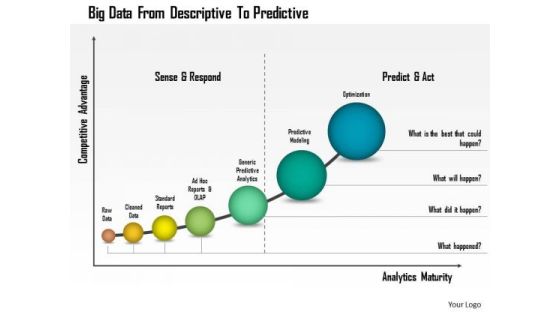
Business Diagram Big Data From Descriptive To Predictive Presentation Template
This business diagram has been designed with graphic of linear bar graph. This growing bar graph depicts the concept of big data analysis. Use this professional diagram for your financial and business analysis.
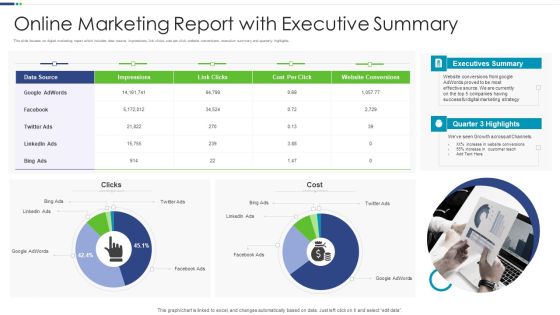
Online Marketing Report With Executive Summary Designs PDF
This slide focuses on digital marketing report which includes data source, impressions, link clicks, cost per click, website conversions, executive summary and quarterly highlights.Pitch your topic with ease and precision using this Online Marketing Report With Executive Summary Designs PDF This layout presents information on Executives Summary, Digital Marketing, Conversions It is also available for immediate download and adjustment. So, changes can be made in the color, design, graphics or any other component to create a unique layout.
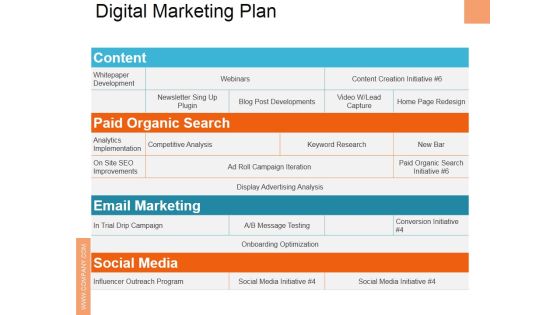
Digital Marketing Plan Ppt PowerPoint Presentation Ideas Graphics Download
This is a digital marketing plan ppt powerpoint presentation ideas graphics download. This is a four stage process. The stages in this process are content, paid organic search, email marketing, social media.

Digital Marketing Plan Ppt PowerPoint Presentation Slides Gallery
This is a digital marketing plan ppt powerpoint presentation slides gallery. This is a four stage process. The stages in this process are content, paid organic search, email marketing, social media, whitepaper development, webinars.

Digital Marketing Plan Ppt PowerPoint Presentation Portfolio Slides
This is a digital marketing plan ppt powerpoint presentation portfolio slides. This is a three stage process. The stages in this process are content, paid organic search, email marketing, social media.
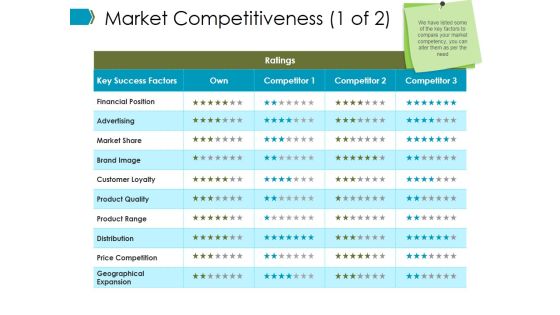
Market Competitiveness Template Ppt PowerPoint Presentation Summary Ideas
This is a market competitiveness template ppt powerpoint presentation summary ideas. This is a three stage process. The stages in this process are financial position, advertising, market share, brand image, customer loyalty.

Product Launch Marketing Budget Template Ppt PowerPoint Presentation Pictures Objects
This is a product launch marketing budget template ppt powerpoint presentation pictures objects. This is a four stage process. The stages in this process are public relations, web marketing, advertising, collateral.

Digital Marketing Plan Ppt PowerPoint Presentation Infographic Template Gallery
This is a digital marketing plan ppt powerpoint presentation infographic template gallery. This is a four stage process. The stages in this process are paid organic search, content, email marketing, social media.

Critical Surveys For Market Research Example Ppt Image
This is a critical surveys for market research example ppt image. This is a seven stage process. The stages in this process are determine research design, data collection, visualization and analysis, define research objective, instrument development, data quality check, reporting.

Data And Customer Analysis Company Outline Competitor Analysis Topics PDF
This slide highlights the competitive analysis of Nielsen, international data group, Kantar, GFK and Gartner on the basis of locations, employees, valuation, revenue and net income. Are you in need of a template that can accommodate all of your creative concepts This one is crafted professionally and can be altered to fit any style. Use it with Google Slides or PowerPoint. Include striking photographs, symbols, depictions, and other visuals. Fill, move around, or remove text boxes as desired. Test out color palettes and font mixtures. Edit and save your work, or work with colleagues. Download Data And Customer Analysis Company Outline Competitor Analysis Topics PDF and observe how to make your presentation outstanding. Give an impeccable presentation to your group and make your presentation unforgettable.

Industry Report Of Packaged Food Products Part 1 Ready To Eat Industry Snapshot United States Elements PDF
Are you searching for a Industry Report Of Packaged Food Products Part 1 Ready To Eat Industry Snapshot United States Elements PDF that is uncluttered, straightforward, and original Its easy to edit, and you can change the colors to suit your personal or business branding. For a presentation that expresses how much effort you have put in, this template is ideal. With all of its features, including tables, diagrams, statistics, and lists, its perfect for a business plan presentation. Make your ideas more appealing with these professional slides. Download Industry Report Of Packaged Food Products Part 1 Ready To Eat Industry Snapshot United States Elements PDF from Slidegeeks today.

Best Practices For Data Optimization To Improvement Capability Structure PDF
This slide showcases various best practices for increase business capabilities by optimizing data to achieve targets. It includes key components such as develop archiving and reporting strategy, choose data management tool, remove unnecessary data manually, etc. Persuade your audience using this Best Practices For Data Optimization To Improvement Capability Structure PDF. This PPT design covers Five stages, thus making it a great tool to use. It also caters to a variety of topics including Choose Data, Management Tool, Remove Unnecessary, Data Manually. Download this PPT design now to present a convincing pitch that not only emphasizes the topic but also showcases your presentation skills.

Key Company Financial Operation Performance Metrics Ppt Infographic Template Example Introduction PDF
This slide showcases key performance indicators for every business. Key metrics covered are return on assets and equity, working capital ratio, debt and equity ratio. Showcasing this set of slides titled Key Company Financial Operation Performance Metrics Ppt Infographic Template Example Introduction PDF. The topics addressed in these templates are Return on Assets, Working Capital Ratio, Return on Equity. All the content presented in this PPT design is completely editable. Download it and make adjustments in color, background, font etc. as per your unique business setting.

Deliverables From Marketing Ppt PowerPoint Presentation Layouts Information
This is a deliverables from marketing ppt powerpoint presentation layouts information. This is a seven stage process. The stages in this process are datasheet, product brief, white papers, case studies.

Market Competitiveness Template 1 Ppt PowerPoint Presentation Infographics Vector
This is a market competitiveness template 1 ppt powerpoint presentation infographics vector. This is a three stage process. The stages in this process are key success factors, weight, rating, weighted score.

Data Interpretation And Analysis Playbook Data Science Depends On Six Critical Elements Diagrams PDF
This template depicts that data science depends on six critical elements, including analytic opportunities, data, analytic techniques, people, technology, and culture, also known as ADAPT pluse C. Presenting data interpretation and analysis playbook data science depends on six critical elements diagrams pdf to provide visual cues and insights. Share and navigate important information on six stages that need your due attention. This template can be used to pitch topics like analytic opportunities, data, analytic techniques, people, technology, culture. In addtion, this PPT design contains high resolution images, graphics, etc, that are easily editable and available for immediate download.

Market Leader In A Segment Ppt PowerPoint Presentation Layouts Demonstration
This is a market leader in a segment ppt powerpoint presentation layouts demonstration. This is a two stage process. The stages in this process are parameters, company xx capabilities, high quality standards, past experience, list of all approvals required by customers.

Key Monitoring Strategies To Counter Insider Threat In Cyber Security Demonstration PDF
This slide shows vital monitoring strategies for countering insider threat. It provides information about monitoring, protecting sensitive data, ascertaining user access, implementing least privilege model, applying security analytics and training employees. Persuade your audience using this Key Monitoring Strategies To Counter Insider Threat In Cyber Security Demonstration PDF. This PPT design covers six stages, thus making it a great tool to use. It also caters to a variety of topics including Monitoring User Data, Protecting Sensitive Data, Protecting Sensitive Data. Download this PPT design now to present a convincing pitch that not only emphasizes the topic but also showcases your presentation skills.
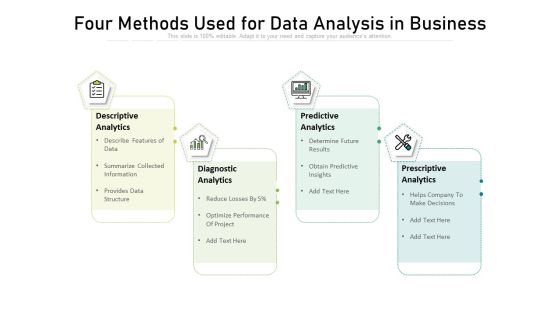
Four Methods Used For Data Analysis In Business Portrait PDF
Persuade your audience using this four methods used for data analysis in business portrait pdf.This PPT design covers four stages, thus making it a great tool to use. It also caters to a variety of topics including descriptive analytics, diagnostic analytics, predictive analytics, prescriptive analytics. Download this PPT design now to present a convincing pitch that not only emphasizes the topic but also showcases your presentation skills.

Data Evaluation And Processing Toolkit Key Considerations In Implementing Data Summary PDF
This slide represents the key challenges of identifying and implementing data analytics for the purpose of decision making. It contains considerations like lack of data analysis tools, resource availability etc. Presenting this PowerPoint presentation, titled Data Evaluation And Processing Toolkit Key Considerations In Implementing Data Summary PDF, with topics curated by our researchers after extensive research. This editable presentation is available for immediate download and provides attractive features when used. Download now and captivate your audience. Presenting this Data Evaluation And Processing Toolkit Key Considerations In Implementing Data Summary PDF. Our researchers have carefully researched and created these slides with all aspects taken into consideration. This is a completely customizable Data Evaluation And Processing Toolkit Key Considerations In Implementing Data Summary PDF that is available for immediate downloading. Download now and make an impact on your audience. Highlight the attractive features available with our PPTs.
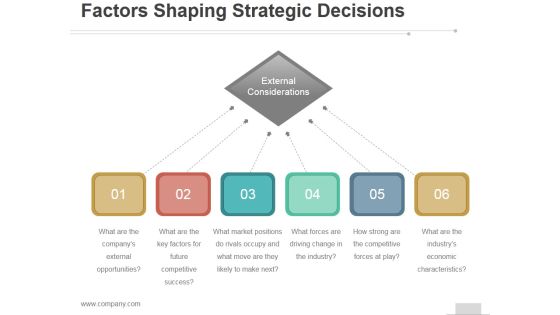
Factors Shaping Strategic Decisions Ppt PowerPoint Presentation Background Images
This is a factors shaping strategic decisions ppt powerpoint presentation background images. This is a six stage process. The stages in this process are external, considerations, business, marketing, strategy.

Characteristics Of Employee Key Performance Indicators Performance Indicators Guidelines PDF
The following slide highlights the characteristics of staff key performance Indicators illustrating key headlines which includes simple, aligned, relevant, measurable, achievable, timely and visible. It helps organisation to develop a set of KPI to monitor staff performance Presenting Characteristics Of Employee Key Performance Indicators Performance Indicators Guidelines PDF to dispense important information. This template comprises seven stages. It also presents valuable insights into the topics including Measurable, Achievable, Timely, Visible, Simple This is a completely customizable PowerPoint theme that can be put to use immediately. So, download it and address the topic impactfully.

Data Interpretation And Analysis Playbook Business Intelligence And Predictive Analytics Challenges Template PDF
This template covers the problems while implementing BI and predictive analytics in the organization. The challenges are undefined KPIs and metrics, and unable to hire right data science talent. Presenting data interpretation and analysis playbook business intelligence and predictive analytics challenges template pdf to provide visual cues and insights. Share and navigate important information on two stages that need your due attention. This template can be used to pitch topics like security vulnerabilities, operationalizing, perform analysis, deployed. In addtion, this PPT design contains high resolution images, graphics, etc, that are easily editable and available for immediate download.

Organisational Level Employee Key Performance Indicators Performance Indicators Rules PDF
The following slide highlights the organisational level staff key performance Indicators illustrating key headings KPI, description, benchmark and value. It also depicts revenue per employee, profit per FTE, human capital ROI, absenteeism rate and overtime per employee Showcasing this set of slides titled Organisational Level Employee Key Performance Indicators Performance Indicators Rules PDF The topics addressed in these templates are Revenue Compensation, Overtime Employee, Benchmark All the content presented in this PPT design is completely editable. Download it and make adjustments in color, background, font etc. as per your unique business setting.

Data Analytics IT Phases Of Data Science Discovery Ppt Portfolio Skills PDF
This slide represents the first phase of data science that is understanding business problems and the facts that come under this phase. Presenting data analytics it phases of data science discovery ppt portfolio skills pdf to provide visual cues and insights. Share and navigate important information on four stages that need your due attention. This template can be used to pitch topics like resources, technology, organization, goals, business. In addtion, this PPT design contains high resolution images, graphics, etc, that are easily editable and available for immediate download.

Data Analytics IT Tools For Data Science Tableau Ppt Slides Graphics PDF
This slide represents the Tableau tool used in data science and its features such as licensing views, subscription of others, mobile device management, JavaScript API advancements, and document API. Presenting data analytics it tools for data science tableau ppt slides graphics pdf to provide visual cues and insights. Share and navigate important information on seven stages that need your due attention. This template can be used to pitch topics like licensing views, subscribe others, mobile device mgmt, site saml, document api. In addtion, this PPT design contains high resolution images, graphics, etc, that are easily editable and available for immediate download.

Telecom Technology Industry Report With Growth Drivers Pictures PDF
The following slide highlights telecommunication technology industry report with growth drivers such as application services, BPO, digital operations, cybersecurity, data analytics, automation, robotics, business technology and consulting etc. Showcasing this set of slides titled Telecom Technology Industry Report With Growth Drivers Pictures PDF. The topics addressed in these templates are Application Services, Cybersecurity Data, Other Market Drivers. All the content presented in this PPT design is completely editable. Download it and make adjustments in color, background, font etc. as per your unique business setting.
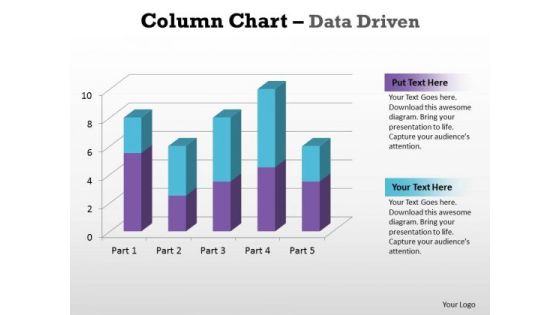
Business Graphic PowerPoint Templates Business Column Chart Data Driven Ppt Slides
Business Graphic PowerPoint Templates Business column chart data driven PPT Slides-With help of visual aids like this template you can capture the attention of the audience and make the presentation very interactive and lively.-Business Graphic PowerPoint Templates Business column chart data driven PPT Slides-This ppt can be used for concepts relating to-chart,, graph, growth, investment, , market, percentage, , presentation report, results, statistics, stock, success and business.

Data Collection Methods And Tools With Icons Ppt PowerPoint Presentation Pictures Structure
Presenting this set of slides with name data collection methods and tools with icons ppt powerpoint presentation pictures structure. This is a six stage process. The stages in this process are data sources, database management, marketing. This is a completely editable PowerPoint presentation and is available for immediate download. Download now and impress your audience.

Internal And External Sources Of Data Generation Ppt PowerPoint Presentation Gallery Information
Presenting this set of slides with name internal and external sources of data generation ppt powerpoint presentation gallery information. This is a three stage process. The stages in this process are data sources, database management, marketing. This is a completely editable PowerPoint presentation and is available for immediate download. Download now and impress your audience.
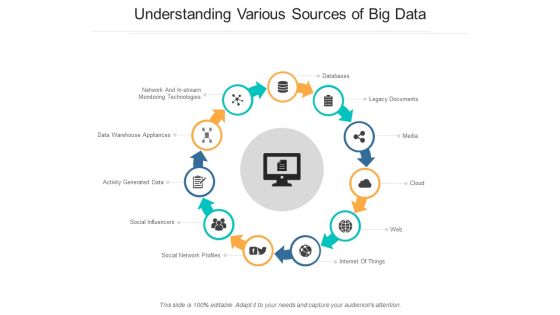
Understanding Various Sources Of Big Data Ppt PowerPoint Presentation Model Slide Download
Presenting this set of slides with name understanding various sources of big data ppt powerpoint presentation model slide download. This is a eleven stage process. The stages in this process are data sources, database management, marketing. This is a completely editable PowerPoint presentation and is available for immediate download. Download now and impress your audience.

Toolkit For Data Science And Analytics Transition Value Stream Information Data Analytics Structure Sample PDF
The slides shows the stages of data analytics with reactive and proactive approach. In includes four steps collection, analysis, predictive and actions. Retrieve professionally designed Toolkit For Data Science And Analytics Transition Value Stream Information Data Analytics Structure Sample PDF to effectively convey your message and captivate your listeners. Save time by selecting pre made slideshows that are appropriate for various topics, from business to educational purposes. These themes come in many different styles, from creative to corporate, and all of them are easily adjustable and can be edited quickly. Access them as PowerPoint templates or as Google Slides themes. You do not have to go on a hunt for the perfect presentation because Slidegeeks got you covered from everywhere.
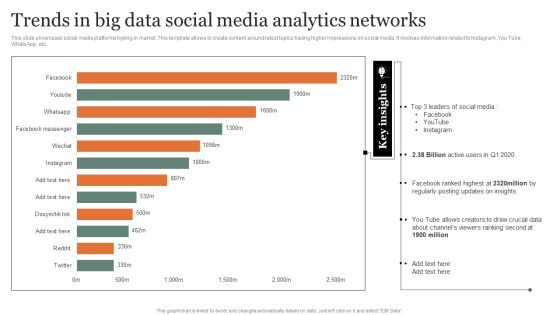
Trends In Big Data Social Media Analytics Networks Guidelines PDF
This slide showcases social media platforms hyping in market. This template allows to create content around latest topics having higher impressions on social media. It involves information related to Instagram, You Tube, WhatsApp, etc. Showcasing this set of slides titled Trends In Big Data Social Media Analytics Networks Guidelines PDF Topics. The topics addressed in these templates are Analytics Networks, Posting Updates, Ranking Second. All the content presented in this PPT design is completely editable. Download it and make adjustments in color, background, font etc. as per your unique business setting.
Environmental Scanning Icon For Data Analysis Graphics PDF
Persuade your audience using this Environmental Scanning Icon For Data Analysis Graphics PDF. This PPT design covers four stages, thus making it a great tool to use. It also caters to a variety of topics including Environmental Scanning Icon For Data Analysis. Download this PPT design now to present a convincing pitch that not only emphasizes the topic but also showcases your presentation skills.
 Home
Home