AI PPT Maker
Templates
PPT Bundles
Design Services
Business PPTs
Business Plan
Management
Strategy
Introduction PPT
Roadmap
Self Introduction
Timelines
Process
Marketing
Agenda
Technology
Medical
Startup Business Plan
Cyber Security
Dashboards
SWOT
Proposals
Education
Pitch Deck
Digital Marketing
KPIs
Project Management
Product Management
Artificial Intelligence
Target Market
Communication
Supply Chain
Google Slides
Research Services
 One Pagers
All Categories
-
Home
- Customer Favorites
- Dashboard Stock
Dashboard Stock
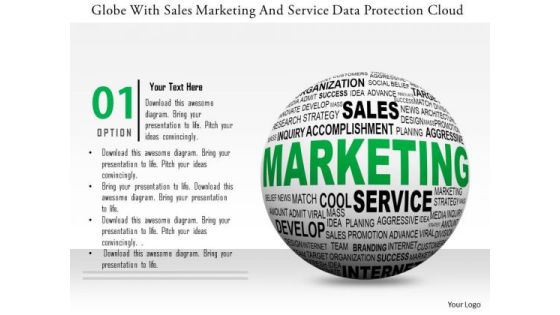
Stock Photo Globe With Sales Marketing And Service Data Protection Cloud PowerPoint Slide
This power point template has been designed with graphic of globe and cloud. This image template contains the concept of global sales and marketing service with cloud technology. Use this image template for global business related presentations.
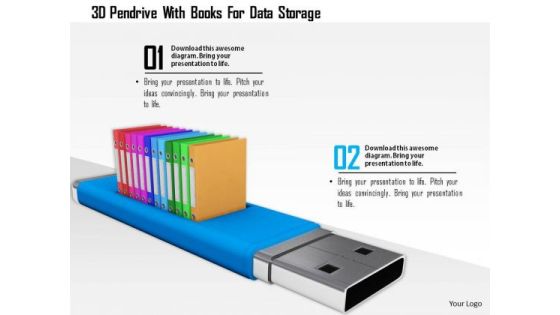
Stock Photo 3d Pendrive With Books For Data Storage PowerPoint Slide
This power point image template has been crafted with graphic of 3d pen drive and books. This PPT contains the concept of data storage. Use this image for your business data storage related topics in any presentations.

Stock Photo Blue Colored Pen Drive With Combination Lock PowerPoint Slide
Graphic of blue colored pen drive and combination lock has been used to design this power point template. This PPT contains the concept of data security and data technology. Use this PPT for your business and marketing related presentations.

Stock Market Research Report Ppt PowerPoint Presentation Complete Deck With Slides
Induce strategic thinking by presenting this complete deck. Enthrall your audience by deploying this thought-provoking PPT deck. It can be downloaded in both standard and widescreen aspect ratios, thus making it a complete package to use and deploy. Convey your thoughts and actions using the fifty seven slides presented in this complete deck. Additionally, feel free to alter its components like color, graphics, design, etc, to create a great first impression. Grab it now by clicking on the download button below.
Stock Photo Red Upload Arrow On Blue Cloud Icon PowerPoint Slide
This technical image slide has been designed with graphic of red upload arrow on cloud. This image slide explains the concept of data upload techniques with in the cloud service. Use this image slide for cloud computing related presentations.

Stock Photo Yellow Data Folder In Lifesaver PowerPoint Slide PowerPoint Slide
This exclusive image slide has been crafted with graphic of data folder in lifesaver. This image explains the concept of safety and security of data. Use this image for technology related presentations where you have to focus on data storage.

Stock Photo Small And Big Cubes For Text Representation PowerPoint Slide
This Power Point template has been crafted with graphic of cubes. This image slide contains the concept data representations. Use this editable image slide for your business and marketing related topics and to impress your viewers.

Stock Photo 3d Lifesaving Ring And Data Folder For Safety PowerPoint Slide
This PowerPoint template has been designed with graphic of 3d folder in life saving rings. This image slide contains the concept of data safety. Use this slide for your data storage and safety related topics.
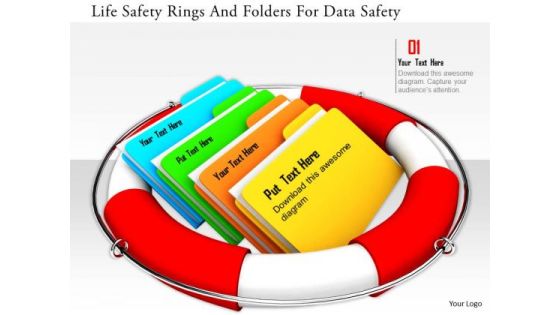
Stock Photo Life Safety Rings And Folders For Data Safety PowerPoint Slide
This PowerPoint template has been designed with graphic of 3d folder in life saving rings. This image slide contains the concept of data safety. Use this slide for your data storage and safety related topics.
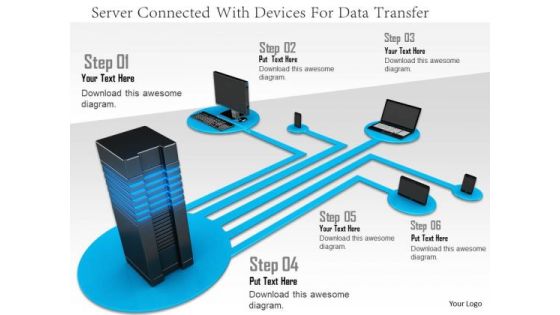
Stock Photo Server Connected With Devices For Data Transfer PowerPoint Slide
In this Power Point template server is connected with devices. This image template contains the concept of data sharing and transfer. Use this PPT in your data technology related presentations.

Stock Photo Earth Globe With Pen Drive For Data Transfer PowerPoint Slide
This power point image template has been designed with graphic of earth globe and pen drive. This image template contains the concept of data transfer. This image template can be used for data and global technology related presentations.

Stock Photo Three Servers For Data Transfer And Safety Image Graphics For PowerPoint Slide
Servers with laptops have been used to design this image. Concepts of networking and data transfer may be explained using this image. This image slide will help you express your views to target audience.
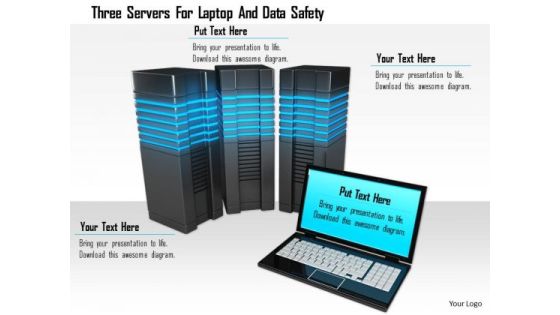
Stock Photo Three Servers For Laptop And Data Safety Image Graphics For PowerPoint Slide
Servers with laptop have been used to design this image. Concepts of networking and data transfer may be explained using this image. This image slide will help you express your views to target audience.

Stock Photo Three Clouds And Laptop For Data Technology PowerPoint Slide
This Power Point template has been designed with graphic of three clouds and laptop. Display the concept of cloud computing with this image slide. Use this professional image for your cloud technology and data transfer related topics.
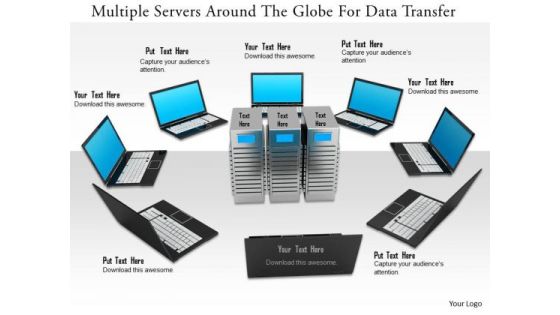
Stock Photo Multiple Servers Around The Globe For Data Transfer PowerPoint Slide
Multiple laptops around the servers has been used to design this power point template. This image slide contains the concept of networking and data transfer. Use this slide for your technology and communication related presentations.
Stock Photo 3d Mouse Cursor For Data Indication Image Graphics For PowerPoint
This Power Point image template has been crafted with graphic of 3d mouse cursor. This image template contains the concept of data indication on computer. Use this image template for your computer technology related presentations.

Stock Photo 3d Blue Folder With Lock For Data Security PowerPoint Slide
This power point image template has been crafted with graphic of 3d blue folder and lock. This image contains the concept of data security. Use this image PPT for your technology and security related presentations.

Stock Photo World Map On Bar Graph For Data Growth Image Graphics For PowerPoint Slide
This image is designed with blue graph with world map printed on it. This conceptual image portrays the concepts of global business and global economy. This image slide will help you express your views to target audience.

Stock Photo Globe And Server For Global Data Storage PowerPoint Slide
Graphic of globe and server has been used to design this PowerPoint template. This image slide contains the concept of technology and internet. Use this professional slide for technology related topics.
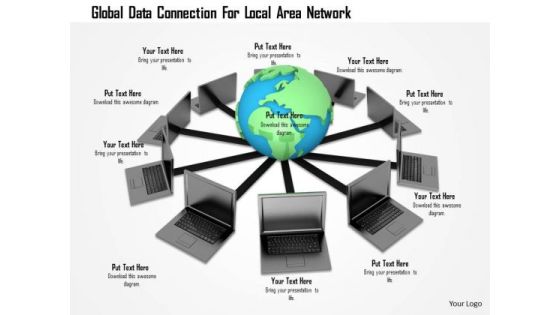
Stock Photo Global Data Connection For Local Area Network PowerPoint Slide
This Power point template has been designed with graphic of globe connected with laptops. This image slide contains the concept of global networking. Use this slide for your business network and communication related topics in any presentation.
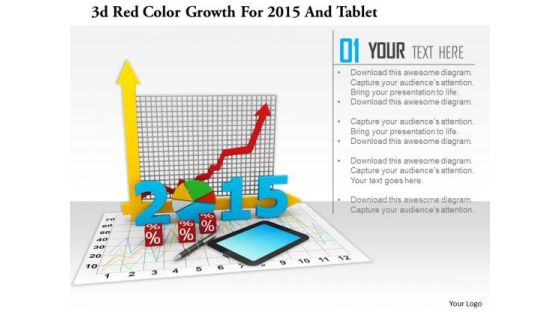
Stock Photo 3d Red Color Growth For 2015 And Tablet PowerPoint Slide
This image slide has graphics of financial charts and reports. This contains bar graph and pie chart to present business reports. Build an innovative presentation using this professional image slide.
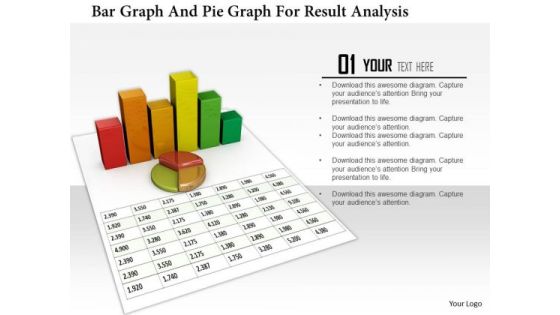
Stock Photo Bar Graph And Pie Graph For Result Analysis PowerPoint Slide
3D business graphs have been used to design this PowerPoint template. This Image slide is suitable to make business reports and charts. This slide can be used for business and marketing presentations.

Stock Photo 3d Us Map With Growth Arrow And Us Map PowerPoint Slide
This image displays American map with business graph in background. This image slide contains the concept of American economy, business growth and reports. Use this amazing slide to make professional presentations.

Stock Photo Bar Graph And Us Map With Financial Growth PowerPoint Slide
This image displays American map with business graph in background. This image slide contains the concept of American economy, business growth and reports. Use this amazing slide to make professional presentations.
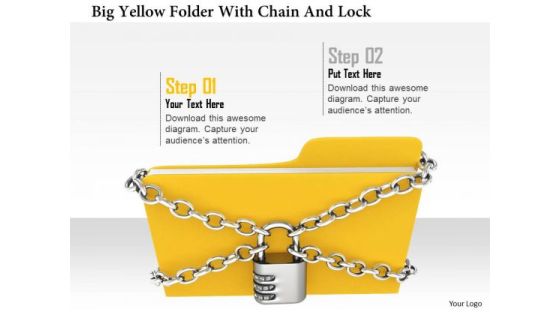
Stock Photo Big Yellow Folder With Chian And Lock PowerPoint Slide
A big yellow folder has been used to design this image slide. This yellow folder has been covered with chain and lock. This slide depicts the concept of data safety and security. Keep safe your data and display this massage in your presentation with this unique design
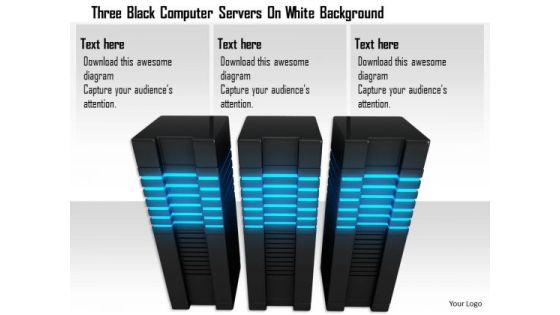
Stock Photo Three Black Computer Servers On White Background PowerPoint Slide
This image slide displays 3d black computer servers. This image has been designed with graphic of black computer servers with blue lights on white background. Use this image to express views on client server, data storage and backup. This image will enhance the quality of your presentations.

Dashboard Indicating Online Store Accounts Overview Introduction PDF
The following slide showcases ecommerce accounts management dashboard. It provides information about income, expenses, cash collected, cash spent, tax collected, tax claim, stock sold, invoice, etc. Presenting this PowerPoint presentation, titled Dashboard Indicating Online Store Accounts Overview Introduction PDF, with topics curated by our researchers after extensive research. This editable presentation is available for immediate download and provides attractive features when used. Download now and captivate your audience. Presenting this Dashboard Indicating Online Store Accounts Overview Introduction PDF. Our researchers have carefully researched and created these slides with all aspects taken into consideration. This is a completely customizable Dashboard Indicating Online Store Accounts Overview Introduction PDF that is available for immediate downloading. Download now and make an impact on your audience. Highlight the attractive features available with our PPTs.

ADC Cosmetics Company Dashboard With Variables Introduction PDF
This slide shows a cosmetics and skin care sales dashboard with KPIs such as Profit Margin in 2021, Cross Selling Rate, Market Size, Stock Turnover Rate, Social Media Usage, Revenue etc. Presenting adc cosmetics company dashboard with variables introduction pdf to provide visual cues and insights. Share and navigate important information on eight stages that need your due attention. This template can be used to pitch topics like profit margin, revenue, market size, social media, promotor score. In addition, this PPT design contains high-resolution images, graphics, etc, that are easily editable and available for immediate download.

ADC Cosmetics Company Dashboard With Variables Ppt Backgrounds PDF
This slide shows a cosmetics and skin care sales dashboard with KPIs such as Profit Margin in 2019, Cross Selling Rate , Market Size , Stock Turnover Rate , Social Media Usage, Revenue etc.Presenting adc cosmetics company dashboard with variables ppt backgrounds pdf. to provide visual cues and insights. Share and navigate important information on eight stages that need your due attention. This template can be used to pitch topics like stock turnover rate 2021, social media usage 2021, net promotor score 2021. In addtion, this PPT design contains high resolution images, graphics, etc, that are easily editable and available for immediate download.

ADC Cosmetics Company Dashboard With Variables Summary PDF
This slide shows a cosmetics and skin care sales dashboard with KPIs such as Profit Margin in 2021, Cross Selling Rate , Market Size , Stock Turnover Rate , Social Media Usage, Revenue etc. Presenting adc cosmetics company dashboard with variables summary pdf to provide visual cues and insights. Share and navigate important information on eight stages that need your due attention. This template can be used to pitch topics like profit margin, cross selling rate, market size, revenue, stock turnover rate. In addtion, this PPT design contains high resolution images, graphics, etc, that are easily editable and available for immediate download.

Logistics Dashboard For XYZ Logistic Company Cost Ppt Example PDF
The slide shows the logistic measurement dashboard for measuring inventory turnover ratio, inventory carrying cost, inventory accuracy, percentage of out of stock items etc.Deliver an awe-inspiring pitch with this creative logistics dashboard for XYZ logistic company cost ppt example pdf. bundle. Topics like inventory to sales, carrying cost of inventory, inventory accuracy, 2017 to 2021 can be discussed with this completely editable template. It is available for immediate download depending on the needs and requirements of the user.
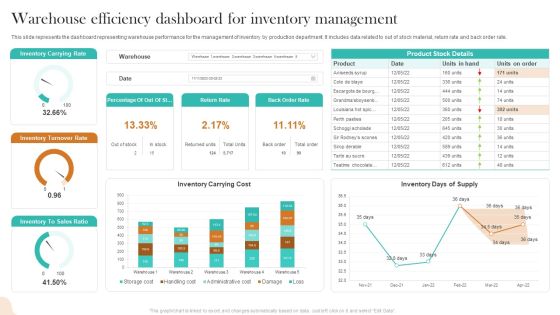
Warehouse Efficiency Dashboard For Inventory Management Infographics PDF
This slide represents the dashboard representing warehouse performance for the management of inventory by production department. It includes data related to out of stock material, return rate and back order rate. Showcasing this set of slides titled Warehouse Efficiency Dashboard For Inventory Management Infographics PDF. The topics addressed in these templates are Inventory Carrying Rate, Inventory Turnover Rate, Inventory Carrying Cost. All the content presented in this PPT design is completely editable. Download it and make adjustments in color, background, font etc. as per your unique business setting.
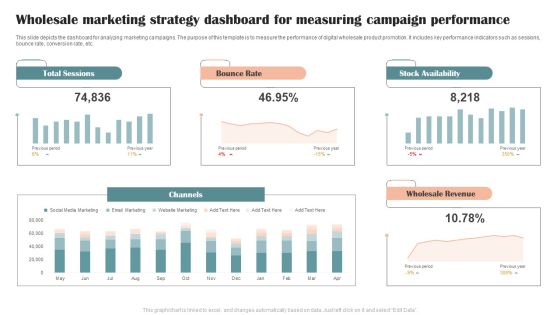
Wholesale Marketing Strategy Dashboard For Measuring Campaign Performance Graphics PDF
This slide depicts the dashboard for analyzing marketing campaigns. The purpose of this template is to measure the performance of digital wholesale product promotion. It includes key performance indicators such as sessions, bounce rate, conversion rate, etc. Showcasing this set of slides titled Wholesale Marketing Strategy Dashboard For Measuring Campaign Performance Graphics PDF. The topics addressed in these templates are Total Sessions, Bounce Rate, Stock Availability. All the content presented in this PPT design is completely editable. Download it and make adjustments in color, background, font etc. as per your unique business setting.

ADC Cosmetics Company Dashboard With Variables Formats PDF
This slide shows a cosmetics and skin care sales dashboard with KPIs such as Profit Margin in 2021, Cross Selling Rate , Market Size, Stock Turnover Rate , Social Media Usage, Revenue etc. Deliver an awe-inspiring pitch with this creative adc cosmetics company dashboard with variables formats pdf bundle. Topics like profit margin, cross selling rate, market size, revenue, social media can be discussed with this completely editable template. It is available for immediate download depending on the needs and requirements of the user.

Sales Measurement Dashboard For ABC Carbonated Drink Company Template PDF
The slide shows the sales measurement dashboard for measuring sales effectiveness, Inventory Turnover rate, Average Time to Sell in days, Freshness duration of Products sold etc. Deliver an awe-inspiring pitch with this creative sales measurement dashboard for abc carbonated drink company template pdf. bundle. Topics like out of stock rate, inventory turnover, inventory turnover, average time to sell, average time to sell can be discussed with this completely editable template. It is available for immediate download depending on the needs and requirements of the user.

Dashboard Depicting Sales And Customer Analytics Professional PDF
This slide focuses on dashboard that depicts sales and customer analytics which covers sales revenue, average transaction rate, out of stock items, sales by division, monthly visitors, etc. Make sure to capture your audiences attention in your business displays with our gratis customizable Dashboard Depicting Sales And Customer Analytics Professional PDF. These are great for business strategies, office conferences, capital raising or task suggestions. If you desire to acquire more customers for your tech business and ensure they stay satisfied, create your own sales presentation with these plain slides.

Supply Chain Management Service Delivery And Management Dashboard Guidelines PDF
This slide shows an overview of the supply chain management delivery service to track the operationality of the overall process. It includes metrics such as on time deliveries, the average time to sell, and the out of stock rate. Pitch your topic with ease and precision using this Supply Chain Management Service Delivery And Management Dashboard Guidelines PDF. This layout presents information on Supply Chain Management, Service Delivery, Management Dashboard. It is also available for immediate download and adjustment. So, changes can be made in the color, design, graphics or any other component to create a unique layout.
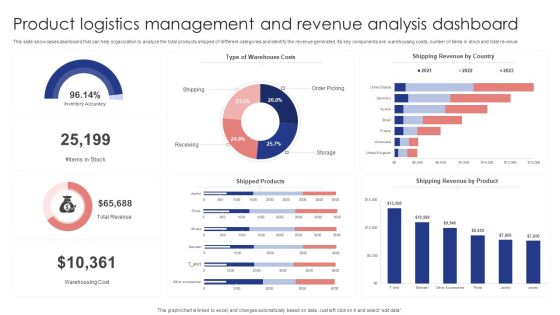
Product Logistics Management And Revenue Analysis Dashboard Demonstration PDF
This slide showcases dashboard that can help organization to analyze the total products shipped of different categories and identify the revenue generated. Its key components are warehousing costs, number of items in stock and total revenue. Pitch your topic with ease and precision using this Product Logistics Management And Revenue Analysis Dashboard Demonstration PDF. This layout presents information on Warehouse Costs, Shipping Revenue Country, Shipped Products . It is also available for immediate download and adjustment. So, changes can be made in the color, design, graphics or any other component to create a unique layout.

Dashboard Depicting Sales And Customer Analytics Infographics PDF
This slide focuses on dashboard that depicts sales and customer analytics which covers sales revenue, average transaction rate, out of stock items, sales by division, monthly visitors, etc. If you are looking for a format to display your unique thoughts, then the professionally designed Dashboard Depicting Sales And Customer Analytics Infographics PDF is the one for you. You can use it as a Google Slides template or a PowerPoint template. Incorporate impressive visuals, symbols, images, and other charts. Modify or reorganize the text boxes as you desire. Experiment with shade schemes and font pairings. Alter, share or cooperate with other people on your work. Download Dashboard Depicting Sales And Customer Analytics Infographics PDF and find out how to give a successful presentation. Present a perfect display to your team and make your presentation unforgettable.

Dashboard To Track Inventory Management Kpis Portrait PDF
This slide showcases KPIs that can help organization to evaluate the efficiency of inventory management process. Its key KPIs are out of stock rate, on time full deliveries, inventory turnover and average time to sell. Here you can discover an assortment of the finest PowerPoint and Google Slides templates. With these templates, you can create presentations for a variety of purposes while simultaneously providing your audience with an eye catching visual experience. Download Dashboard To Track Inventory Management Kpis Portrait PDF to deliver an impeccable presentation. These templates will make your job of preparing presentations much quicker, yet still, maintain a high level of quality. Slidegeeks has experienced researchers who prepare these templates and write high quality content for you. Later on, you can personalize the content by editing the Dashboard To Track Inventory Management Kpis Portrait PDF.

Dashboard To Track Inventory Management Kpis Professional PDF
This slide showcases KPIs that can help organization to evaluate the efficiency of inventory management process. Its key KPIs are out of stock rate, on time full deliveries, inventory turnover and average time to sell. This Dashboard To Track Inventory Management Kpis Professional PDF from Slidegeeks makes it easy to present information on your topic with precision. It provides customization options, so you can make changes to the colors, design, graphics, or any other component to create a unique layout. It is also available for immediate download, so you can begin using it right away. Slidegeeks has done good research to ensure that you have everything you need to make your presentation stand out. Make a name out there for a brilliant performance.
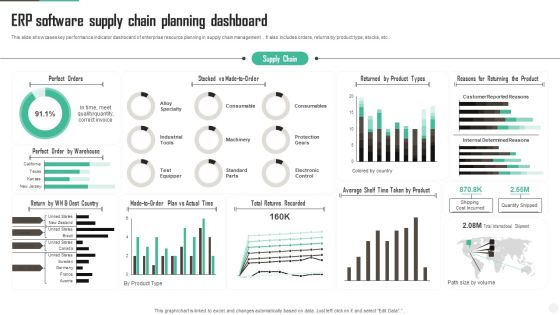
ERP Software Supply Chain Planning Dashboard Diagrams PDF
This slide showcases key performance indicator dashboard of enterprise resource planning in supply chain management . It also includes orders, returns by product type, stocks, etc. Showcasing this set of slides titled ERP Software Supply Chain Planning Dashboard Diagrams PDF Sample. The topics addressed in these templates are Perfect Orders, Dest Country, Actual Time. All the content presented in this PPT design is completely editable. Download it and make adjustments in color, background, font etc. as per your unique business setting.

Stock Market Upward Trends Graph With Dollar Sign And Arrow Up Ppt PowerPoint Presentation Professional Graphics Download
This is a stock market upward trends graph with dollar sign and arrow up ppt powerpoint presentation professional graphics download. This is a four stage process. The stages in this process are stock market, financial markets, bull market.
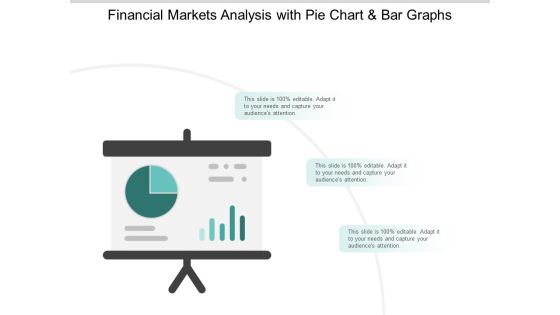
Stock Market Survey Reporting With Pie Chat And Bar Graph Ppt PowerPoint Presentation Infographic Template Example 2015
This is a stock market survey reporting with pie chat and bar graph ppt powerpoint presentation infographic template example 2015. This is a three stage process. The stages in this process are stock market, financial markets, bull market.

Continual Improvement Procedure In Supply Chain Dashboard To Track Inventory Management Status Designs PDF
This slide focuses on the dashboard to track inventory management status which covers annual stock conversion into sales, inventory turnover, inventory carrying cost and accuracy.Deliver an awe inspiring pitch with this creative Continual Improvement Procedure In Supply Chain Dashboard To Track Inventory Management Status Designs PDF bundle. Topics like Stock Conversion, Inventory Turnover, Inventory Accuracy can be discussed with this completely editable template. It is available for immediate download depending on the needs and requirements of the user.
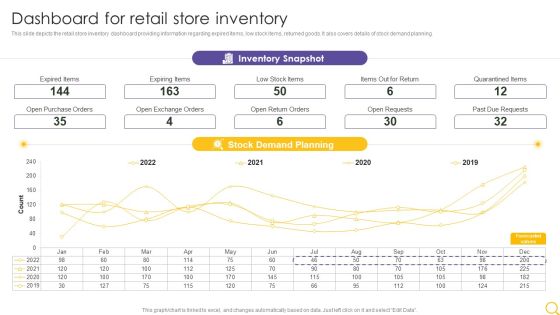
Retail Outlet Operational Efficiency Analytics Dashboard For Retail Store Inventory Summary PDF
This slide depicts the retail store inventory dashboard providing information regarding expired items, low stock items, returned goods. It also covers details of stock demand planning. Deliver and pitch your topic in the best possible manner with this Retail Outlet Operational Efficiency Analytics Dashboard For Retail Store Inventory Summary PDF. Use them to share invaluable insights on Inventory Snapshot, Stock Demand Planning, Expired Items and impress your audience. This template can be altered and modified as per your expectations. So, grab it now.

Ways Of Doing Stock Trading With Fundamental Data And Trading Ppt PowerPoint Presentation Infographic Template Templates PDF
Presenting this set of slides with name ways of doing stock trading with fundamental data and trading ppt powerpoint presentation infographic template templates pdf. This is a five stage process. The stages in this process are earnings announcements, fundamental data and trading, analysing upgrades and downgrades, acquisitions or takeovers, stock splits. This is a completely editable PowerPoint presentation and is available for immediate download. Download now and impress your audience.
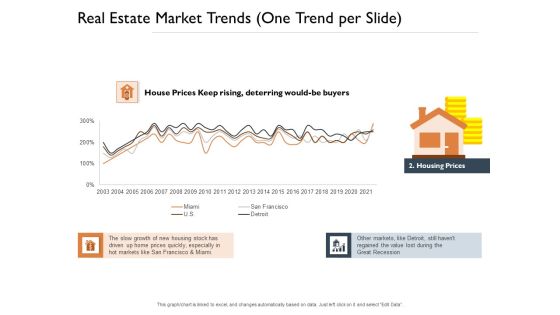
Freehold Property Business Plan Real Estate Market Trends One Trend Per Slide Stock Ppt PowerPoint Presentation Model Outline PDF
Presenting this set of slides with name freehold property business plan real estate market trends one trend per slide stock ppt powerpoint presentation model outline pdf. The topics discussed in these slides are growth, markets, prices. This is a completely editable PowerPoint presentation and is available for immediate download. Download now and impress your audience.
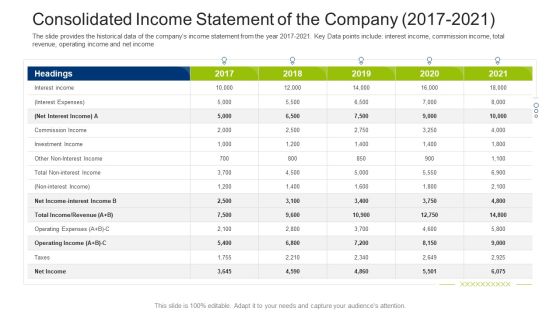
Investment Fundraising Pitch Deck From Stock Market Consolidated Income Statement Of The Company 2017 2021 Graphics PDF
The slide provides the historical data of the companys income statement from the year 2015-2021. Key Data points include interest income, commission income, total revenue, operating income and net income. Deliver an awe inspiring pitch with this creative investment fundraising pitch deck from stock market consolidated income statement of the company 2017 2021 graphics pdf bundle. Topics like interest income, operating income, investment income, commission income can be discussed with this completely editable template. It is available for immediate download depending on the needs and requirements of the user.

Adopting Multiple Tactics To Improve Inventory Optimization Red Flags To Identify Stock Theft In Warehouse Demonstration PDF
This slide showcases red flags that cn help organization in identification of warehouse theft. It can help organization to evaluate core reason for warehouse theft and preventing further loss. The Adopting Multiple Tactics To Improve Inventory Optimization Red Flags To Identify Stock Theft In Warehouse Demonstration PDF is a compilation of the most recent design trends as a series of slides. It is suitable for any subject or industry presentation, containing attractive visuals and photo spots for businesses to clearly express their messages. This template contains a variety of slides for the user to input data, such as structures to contrast two elements, bullet points, and slides for written information. Slidegeeks is prepared to create an impression.
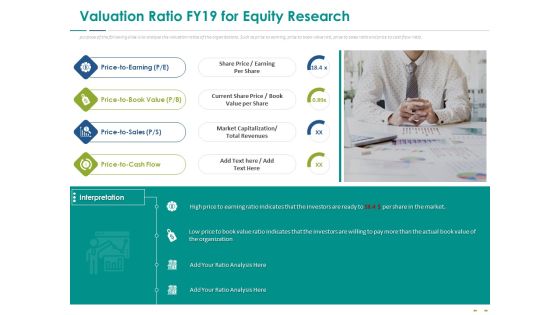
Stock Market Research Report Valuation Ratio FY19 For Equity Research Ppt PowerPoint Presentation Model Background Images PDF
The purpose of the following slide is to analyze the valuation ratios of the organizations. Such as price to earning, price to book value rati, price to sales ratio and price to cash flow ratio. Presenting stock market research report valuation ratio fy19 for equity research ppt powerpoint presentation model background images pdf to provide visual cues and insights. Share and navigate important information on four stages that need your due attention. This template can be used to pitch topics like rice to earning, price to book value, price to sale, price to cash flow. In addition, this PPT design contains high-resolution images, graphics, etc, that are easily editable and available for immediate download.

Dashboard For Retail Store Inventory Retail Outlet Performance Assessment Clipart PDF
This slide depicts the retail store inventory dashboard providing information regarding expired items, low stock items, returned goods. It also covers details of stock demand planning.Deliver an awe inspiring pitch with this creative Dashboard For Retail Store Inventory Retail Outlet Performance Assessment Clipart PDF bundle. Topics like Expired Items, Inventory Snapshot, Demand Planning can be discussed with this completely editable template. It is available for immediate download depending on the needs and requirements of the user.

Dashboard For Retail Store Inventory Retail Outlet Operations Performance Evaluation Pictures PDF
This slide depicts the retail store inventory dashboard providing information regarding expired items, low stock items, returned goods. It also covers details of stock demand planning.Deliver and pitch your topic in the best possible manner with this Dashboard For Retail Store Inventory Retail Outlet Operations Performance Evaluation Pictures PDF. Use them to share invaluable insights on Expired Items, Quarantined Items, Due Requests and impress your audience. This template can be altered and modified as per your expectations. So, grab it now.
Optimizing Logistics Management Process Dashboard To Track Inventory Management Status Icons PDF
This slide focuses on the dashboard to track inventory management status which covers annual stock conversion into sales, inventory turnover, inventory carrying cost and accuracy. Deliver an awe inspiring pitch with this creative optimizing logistics management process dashboard to track inventory management status icons pdf bundle. Topics like inventory carrying cost, inventory turnover, inventory accuracy, stock conversion into sales can be discussed with this completely editable template. It is available for immediate download depending on the needs and requirements of the user.
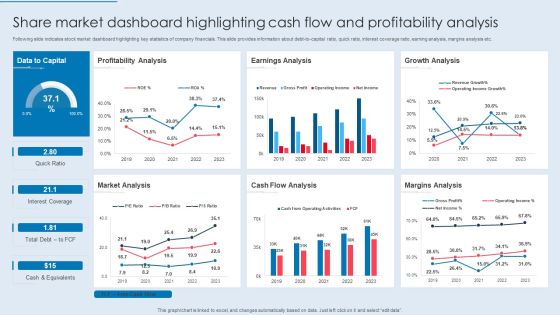
Share Market Dashboard Highlighting Cash Flow And Profitability Analysis Information PDF
Following slide indicates stock market dashboard highlighting key statistics of company financials. This slide provides information about debt-to-capital ratio, quick ratio, interest coverage ratio, earning analysis, margins analysis etc. Showcasing this set of slides titled Share Market Dashboard Highlighting Cash Flow And Profitability Analysis Information PDF. The topics addressed in these templates are Profitability Analysis, Earnings Analysis, Growth Analysis. All the content presented in this PPT design is completely editable. Download it and make adjustments in color, background, font etc. as per your unique business setting.

Administering Logistics Activities In SCM Dashboard To Track Inventory Management Status Background PDF
This slide focuses on the dashboard to track inventory management status which covers annual stock conversion into sales, inventory turnover, inventory carrying cost and accuracy. Deliver an awe inspiring pitch with this creative Administering Logistics Activities In SCM Dashboard To Track Inventory Management Status Background PDF bundle. Topics like Inventory Carrying, Inventory Accuracy, Inventory Turnover can be discussed with this completely editable template. It is available for immediate download depending on the needs and requirements of the user.

Developing Excellence In Logistics Operations Dashboard To Track Inventory Management Status Information PDF
This slide focuses on the dashboard to track inventory management status which covers annual stock conversion into sales, inventory turnover, inventory carrying cost and accuracy.Deliver and pitch your topic in the best possible manner with this Developing Excellence In Logistics Operations Dashboard To Track Inventory Management Status Information PDF Use them to share invaluable insights on Inventory Accuracy, Inventory Carrying, Inventory Turnover and impress your audience. This template can be altered and modified as per your expectations. So, grab it now.

Enhancing Logistics Customer Service Dashboard To Track Inventory Management Status Microsoft PDF
This slide focuses on the dashboard to track inventory management status which covers annual stock conversion into sales, inventory turnover, inventory carrying cost and accuracy. Deliver and pitch your topic in the best possible manner with this Enhancing Logistics Customer Service Dashboard To Track Inventory Management Status Microsoft PDF. Use them to share invaluable insights on Inventory Carrying Cost, Inventory Turnover Last, 5 Years Stock, Conversion Into Sales, and impress your audience. This template can be altered and modified as per your expectations. So, grab it now.

Retail Store Data Map Dashboard Ppt PowerPoint Presentation Gallery Display PDF
This slide shows retail store data inventory dashboard. It provides information such as units sold, on hand, stock availability, top selling items, average inventory value by product category, etc. Pitch your topic with ease and precision using this Retail Store Data Map Dashboard Ppt PowerPoint Presentation Gallery Display PDF. This layout presents information on Inventory Turn, Over Ratio, Gross Margin ROI. It is also available for immediate download and adjustment. So, changes can be made in the color, design, graphics or any other component to create a unique layout.
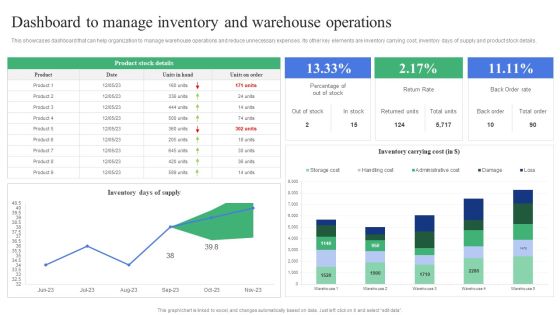
Strategic Guidelines To Administer Dashboard To Manage Inventory And Warehouse Introduction PDF
This showcases dashboard that can help organization to manage warehouse operations and reduce unnecessary expenses. Its other key elements are inventory carrying cost, inventory days of supply and product stock details. This Strategic Guidelines To Administer Dashboard To Manage Inventory And Warehouse Introduction PDF from Slidegeeks makes it easy to present information on your topic with precision. It provides customization options, so you can make changes to the colors, design, graphics, or any other component to create a unique layout. It is also available for immediate download, so you can begin using it right away. Slidegeeks has done good research to ensure that you have everything you need to make your presentation stand out. Make a name out there for a brilliant performance.
