Dashboard Stock
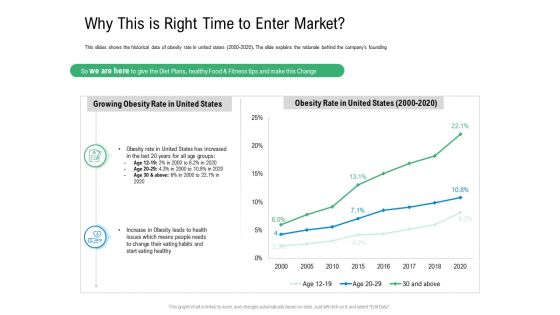
Convertible Preferred Stock Funding Pitch Deck Why This Is Right Time To Enter Market Elements PDF
This slides shows the historical data of obesity rate in united states 2000 2020. The slide explains the rationale behind the companys founding. Deliver and pitch your topic in the best possible manner with this convertible preferred stock funding pitch deck why this is right time to enter market elements pdf. Use them to share invaluable insights on growing obesity rate in united states, obesity rate in united states 2000 2020 and impress your audience. This template can be altered and modified as per your expectations. So, grab it now.
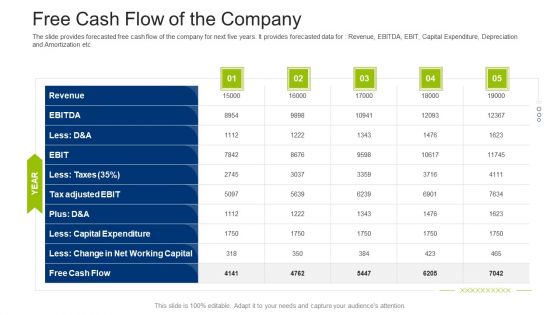
Investment Fundraising Pitch Deck From Stock Market Free Cash Flow Of The Company Brochure PDF
The slide provides forecasted free cash flow of the company for next five years. It provides forecasted data for Revenue, EBITDA, EBIT, Capital Expenditure, Depreciation and Amortization etc. Deliver and pitch your topic in the best possible manner with this investment fundraising pitch deck from stock market free cash flow of the company brochure pdf. Use them to share invaluable insights on capital expenditure, revenue, change in net working capital, cash flow and impress your audience. This template can be altered and modified as per your expectations. So, grab it now.

Investment Fundraising Pitch Deck From Stock Market Total Revenue Forecast For Next Five Years Ideas PDF
The slide provides the revenue projections of the company for next five years. Key Data points include Interest income, investment income, commission income, non-interest income etc. Deliver an awe inspiring pitch with this creative investment fundraising pitch deck from stock market total revenue forecast for next five years ideas pdf bundle. Topics like revenue, commission income, investment income, average interest rate can be discussed with this completely editable template. It is available for immediate download depending on the needs and requirements of the user.
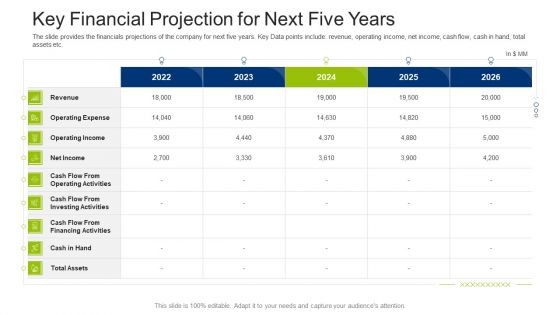
Investment Fundraising Pitch Deck From Stock Market Key Financial Projection For Next Five Years Graphics PDF
The slide provides the financials projections of the company for next five years. Key Data points include revenue, operating income, net income, cash flow, cash in hand, total assets etc. Deliver an awe inspiring pitch with this creative investment fundraising pitch deck from stock market key financial projection for next five years graphics pdf bundle. Topics like financing, cash flow, revenue, operating expense, operating income can be discussed with this completely editable template. It is available for immediate download depending on the needs and requirements of the user.

Stock Market Research Report Balance Sheet FY19 Tabular Form Investments Designs PDF
The purpose of the following slide is to display a tabular representation of the key performance indicators of the balance sheet for four quarters of FY 2019. These KPIs can be Current assets, Current Liability , Total Assets and Total Liabilities. This is a stock market research report balance sheet fy19 tabular form investments designs pdf template with various stages. Focus and dispense information on one stages using this creative set, that comes with editable features. It contains large content boxes to add your information on topics like non current investments, long term loans and advances, current investments, inventories, trade receivables. You can also showcase facts, figures, and other relevant content using this PPT layout. Grab it now.

Procurement Strategies For Reducing Stock Wastage Kpis To Monitor Inventory Template PDF
This slide showcases KPIs that can help organization to measure the effectiveness of inventory management system in organization. KPIs include perfect order rate, inventory shrinkage percentage, inventory carrying cost, fill rate, inventory accuracy rate and picking accuracy. Coming up with a presentation necessitates that the majority of the effort goes into the content and the message you intend to convey. The visuals of a PowerPoint presentation can only be effective if it supplements and supports the story that is being told. Keeping this in mind our experts created Procurement Strategies For Reducing Stock Wastage Kpis To Monitor Inventory Template PDF to reduce the time that goes into designing the presentation. This way, you can concentrate on the message while our designers take care of providing you with the right template for the situation.
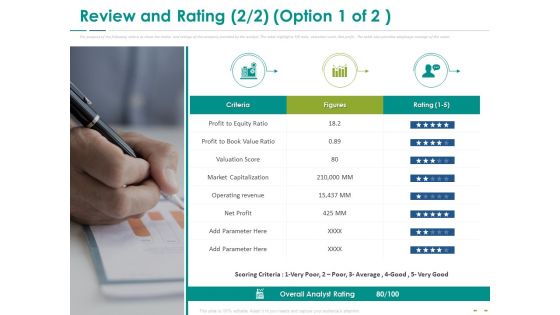
Stock Market Research Report Review And Rating Market Capitalization Elements PDF
The purpose of the following slide is to show the review and ratings of the company provided by the analyst. The table highlights P or E ratio, valuation score, Net profit. The table also provides weightage average of the same. This is a stock market research report review and rating market capitalization elements pdf template with various stages. Focus and dispense information on one stages using this creative set, that comes with editable features. It contains large content boxes to add your information on topics like profit to equity ratio, profit to book value ratio, valuation score, market capitalization, operating revenue. You can also showcase facts, figures, and other relevant content using this PPT layout. Grab it now.
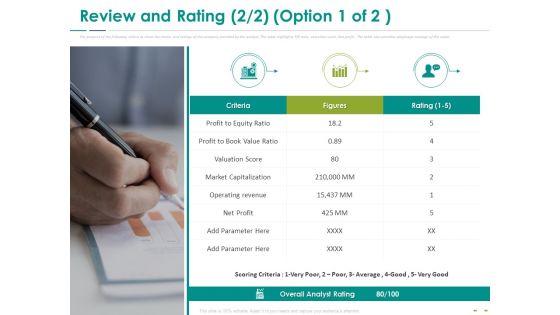
Stock Market Research Report Review And Rating Equity Ratio Ppt PowerPoint Presentation File Inspiration PDF
The purpose of the following slide is to show the review and ratings of the company provided by the analyst. The table highlights P or E ratio, valuation score, Net profit. The table also provides weightage average of the same. This is a stock market research report review and rating equity ratio ppt powerpoint presentation file inspiration pdf template with various stages. Focus and dispense information on one stages using this creative set, that comes with editable features. It contains large content boxes to add your information on topics like profit to equity ratio, profit to book value ratio, valuation score, market capitalization. You can also showcase facts, figures, and other relevant content using this PPT layout. Grab it now.
Stock Market Research Report Asset Management Turnover Ratios FY 19 For Equity Research Icons PDF
The following slide displays the analysis of the companys asset management or turnover ratio of the financial year 19 as it analysis the account payable ratio, asset turnover ratio , fixed asset turnover ratio and inventory turnover ratio. This is a stock market research report asset management turnover ratios fy 19 for equity research icons pdf template with various stages. Focus and dispense information on five stages using this creative set, that comes with editable features. It contains large content boxes to add your information on topics like account payable turnover ratio, asset turnover ratio, fixed asset turnover ratio, inventory turnover ratio, receivable turnover ratio. You can also showcase facts, figures, and other relevant content using this PPT layout. Grab it now.
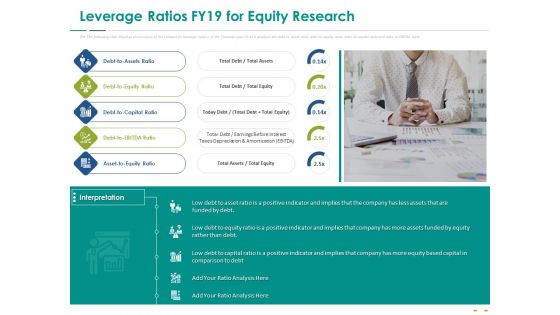
Stock Market Research Report Leverage Ratios FY19 For Equity Research Ppt Infographics Elements PDF
The following slide displays the analysis of the companys leverage ratio o of the financial year 19 as it analysis the debt to asset ratio, debt to equity ratio, debt to capital ratio and debt to EBITDA ratio. Presenting stock market research report leverage ratios fy19 for equity research ppt infographics elements pdf to provide visual cues and insights. Share and navigate important information on five stages that need your due attention. This template can be used to pitch topics like debt to assets ratio, debt to equity ratio, debt to capital ratio, debt to ebitda ratio, asset to equity ratio. In addition, this PPT design contains high-resolution images, graphics, etc, that are easily editable and available for immediate download.

Executing Techniques For Stock Administration And Control Ppt PowerPoint Presentation Complete Deck With Slides
With well-researched insights and carefully-constructed design, this Executing Techniques For Stock Administration And Control Ppt PowerPoint Presentation Complete Deck With Slides is all that you need for your next business meeting with clients and win them over. Add your data to graphs, charts, and tables that are already ready to display it with stunning visuals and help your audience recall your work. With this PPT Complete Deck, you will be able to display your knowledge of the subject as well as your skills as a communicator. Share your ideas and make an impact on the audience with this PowerPoint Layout and ensure that you are known as a presentation professional. Download this PPT Template Bundle to create the most interesting presentation anyone has ever seen.

Stock Market Research Report Review And Rating Ppt PowerPoint Presentation Model Graphics PDF
The purpose of the following slide is to show the review and ratings of the company provided by the analyst. The table highlights P or E ratio, valuation score, Net profit etc. This is a stock market research report review and rating ppt powerpoint presentation model graphics pdf template with various stages. Focus and dispense information on four stages using this creative set, that comes with editable features. It contains large content boxes to add your information on topics like price to book value, operating revenues qtr cr, net profit qtr cr, high in industry, durability score, valuation score, momentum score, market capitalization, avg broker target, p or e ratio. You can also showcase facts, figures, and other relevant content using this PPT layout. Grab it now.

Forecast Demand Using Inventory Administration Techniques For Enhanced Stock Accuracy Template Pdf
This slide showcases graph that can help organization to forecast the inventory requirement on the basis of sales data of previous financial years. It showcases data of last 3 years. Are you in need of a template that can accommodate all of your creative concepts This one is crafted professionally and can be altered to fit any style. Use it with Google Slides or PowerPoint. Include striking photographs, symbols, depictions, and other visuals. Fill, move around, or remove text boxes as desired. Test out color palettes and font mixtures. Edit and save your work, or work with colleagues. Download Forecast Demand Using Inventory Administration Techniques For Enhanced Stock Accuracy Template Pdf and observe how to make your presentation outstanding. Give an impeccable presentation to your group and make your presentation unforgettable.
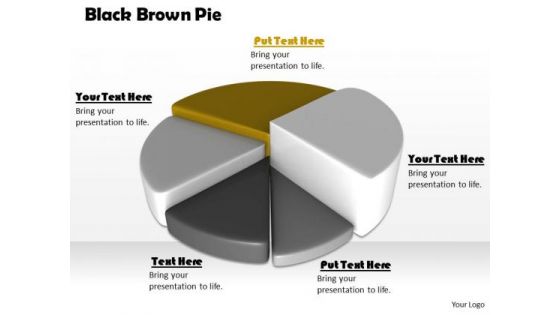
Stock Photo Black Brown Pie Chart For Business Result PowerPoint Slide
This high quality image is designed with pie chart. Use this image to make business reports. Use this outstanding image in presentations relating to data analysis and reports. Go ahead and add charm to your presentations.
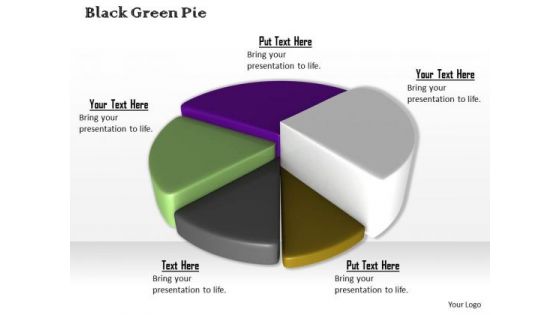
Stock Photo Colorful 3d Pie Chart For Business Result PowerPoint Slide
This high quality image is designed with pie chart. Use this image to make business reports. Use this outstanding image in presentations relating to data analysis and reports. Go ahead and add charm to your presentations.
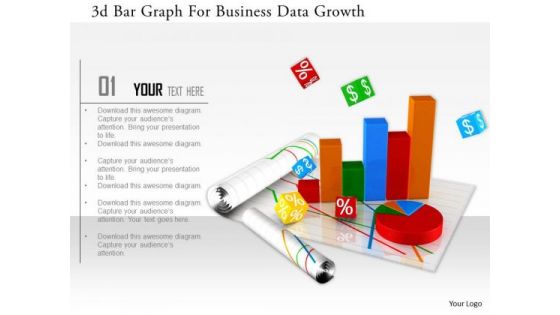
Stock Photo 3d Bar Graph For Business Data Growth Image Graphics For PowerPoint Slide
This image slide has graphics of financial charts and reports. This contains bar graph and pie chart to present business reports. Build an innovative presentations using this professional image slide.

Stock Photo Bar Graph With Cubes For Financial Data PowerPoint Slide
Graphic of bar graph and cubes are used to decorate this image template. This PPT contains the concept of financial data analysis. Use this PPT for finance and business related presentations.

Stock Photo 3d Pie Graph For Business Data Representation PowerPoint Slide
3D business graph has been used to design this PowerPoint template. This Image slide is suitable to make business reports and charts. This slide can be used for business and marketing presentations.
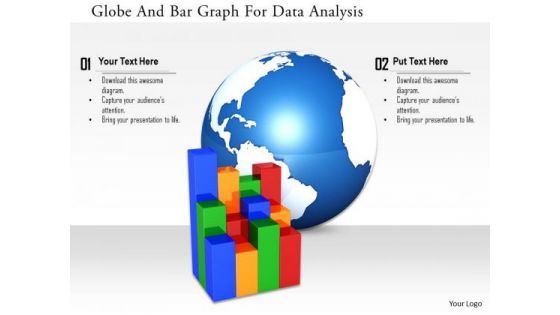
Stock Photo Globe And Bar Graph For Data Analysis Image Graphics For PowerPoint Slide
This image slide has been designed with business graph with globe in background. This image slide represents topics like global business, economic growth. This image will enhance the quality of your presentations.

Stock Photo Ball With Big Data Text For Data Protection Concept PowerPoint Slide
Graphic of ball with big data text has been used to craft this power point template. This image template contains the concept of data protection. Use this image for data security related topics in any presentation.
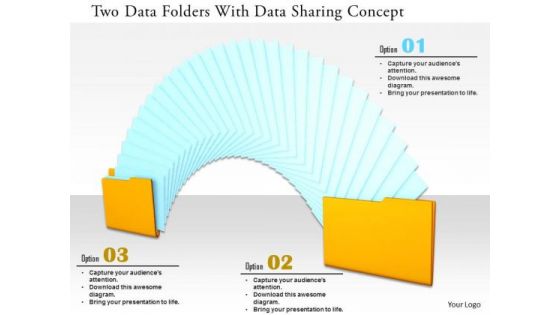
Stock Photo Two Data Folders With Data Sharing Concept PowerPoint Slide
This power point image template has been designed with graphic of two data folders. This PPT contains the concept of data sharing. This PPT can be used for data and technology related presentations.
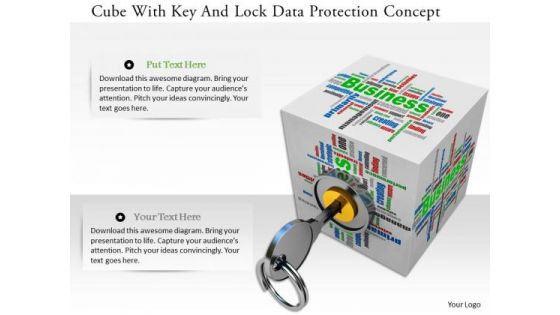
Stock Photo Cube With Key And Lock Data Protection Concept PowerPoint Slide
Graphic of cube with lock and key has been used to design this power point image template. This image template contains the concept of data protection. This image template can e used for data related presentations.

Stock Photo 3d Globe With Social Web For Data Protection Concept PowerPoint Slide
Graphic of 3d globe and web has been used to craft this power point image template. This PPT contains the concept of data protection and social network. Use this PPT and build quality presentation for your viewers.
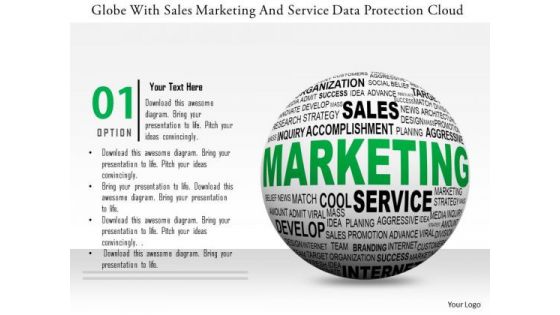
Stock Photo Globe With Sales Marketing And Service Data Protection Cloud PowerPoint Slide
This power point template has been designed with graphic of globe and cloud. This image template contains the concept of global sales and marketing service with cloud technology. Use this image template for global business related presentations.

Stock Photo 3d Pendrive With Books For Data Storage PowerPoint Slide
This power point image template has been crafted with graphic of 3d pen drive and books. This PPT contains the concept of data storage. Use this image for your business data storage related topics in any presentations.
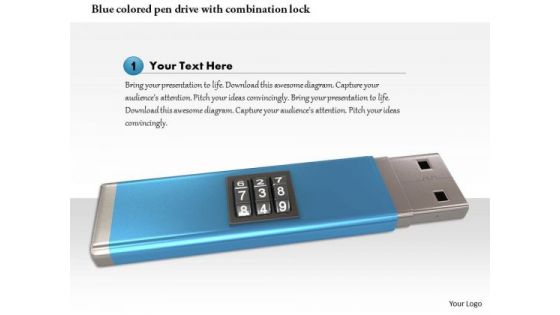
Stock Photo Blue Colored Pen Drive With Combination Lock PowerPoint Slide
Graphic of blue colored pen drive and combination lock has been used to design this power point template. This PPT contains the concept of data security and data technology. Use this PPT for your business and marketing related presentations.
Stock Market Research Report Ppt PowerPoint Presentation Complete Deck With Slides
Stock Photo Red Upload Arrow On Blue Cloud Icon PowerPoint Slide
This technical image slide has been designed with graphic of red upload arrow on cloud. This image slide explains the concept of data upload techniques with in the cloud service. Use this image slide for cloud computing related presentations.

Stock Photo Yellow Data Folder In Lifesaver PowerPoint Slide PowerPoint Slide
This exclusive image slide has been crafted with graphic of data folder in lifesaver. This image explains the concept of safety and security of data. Use this image for technology related presentations where you have to focus on data storage.
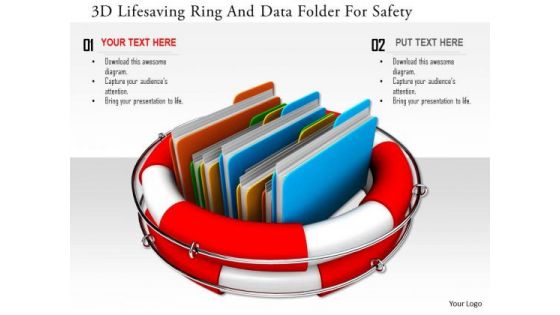
Stock Photo 3d Lifesaving Ring And Data Folder For Safety PowerPoint Slide
This PowerPoint template has been designed with graphic of 3d folder in life saving rings. This image slide contains the concept of data safety. Use this slide for your data storage and safety related topics.
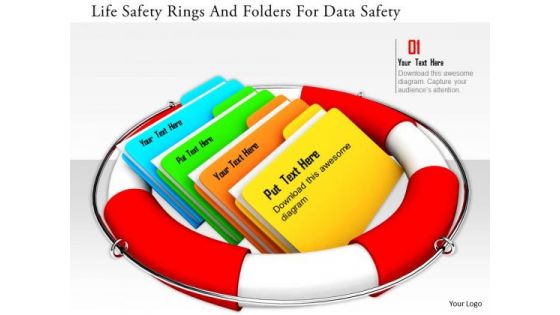
Stock Photo Life Safety Rings And Folders For Data Safety PowerPoint Slide
This PowerPoint template has been designed with graphic of 3d folder in life saving rings. This image slide contains the concept of data safety. Use this slide for your data storage and safety related topics.

Stock Photo Server Connected With Devices For Data Transfer PowerPoint Slide
In this Power Point template server is connected with devices. This image template contains the concept of data sharing and transfer. Use this PPT in your data technology related presentations.

Stock Photo Earth Globe With Pen Drive For Data Transfer PowerPoint Slide
This power point image template has been designed with graphic of earth globe and pen drive. This image template contains the concept of data transfer. This image template can be used for data and global technology related presentations.
Stock Photo Small And Big Cubes For Text Representation PowerPoint Slide
This Power Point template has been crafted with graphic of cubes. This image slide contains the concept data representations. Use this editable image slide for your business and marketing related topics and to impress your viewers.
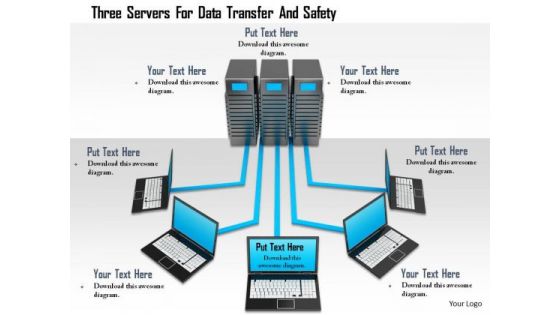
Stock Photo Three Servers For Data Transfer And Safety Image Graphics For PowerPoint Slide
Servers with laptops have been used to design this image. Concepts of networking and data transfer may be explained using this image. This image slide will help you express your views to target audience.
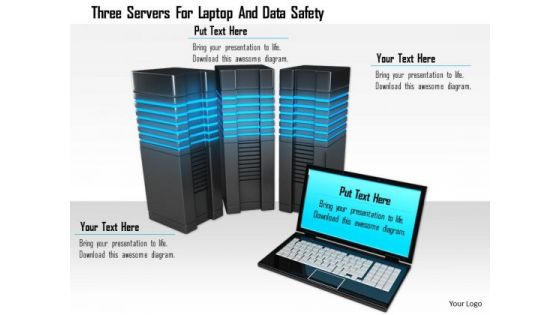
Stock Photo Three Servers For Laptop And Data Safety Image Graphics For PowerPoint Slide
Servers with laptop have been used to design this image. Concepts of networking and data transfer may be explained using this image. This image slide will help you express your views to target audience.
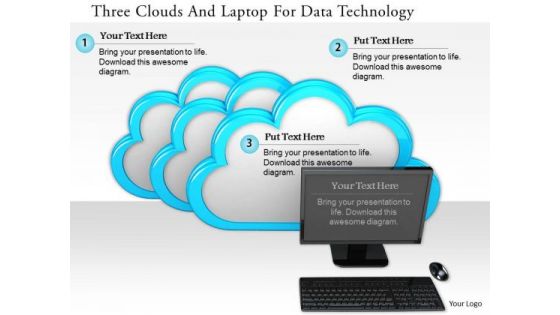
Stock Photo Three Clouds And Laptop For Data Technology PowerPoint Slide
This Power Point template has been designed with graphic of three clouds and laptop. Display the concept of cloud computing with this image slide. Use this professional image for your cloud technology and data transfer related topics.
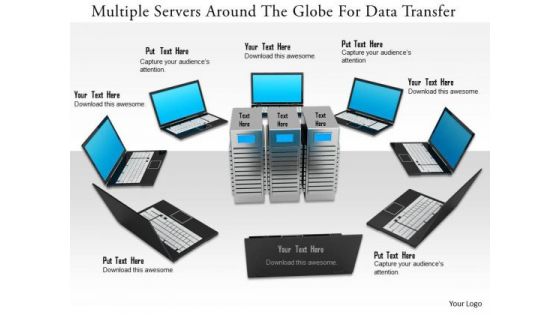
Stock Photo Multiple Servers Around The Globe For Data Transfer PowerPoint Slide
Multiple laptops around the servers has been used to design this power point template. This image slide contains the concept of networking and data transfer. Use this slide for your technology and communication related presentations.

Stock Photo 3d Mouse Cursor For Data Indication Image Graphics For PowerPoint
This Power Point image template has been crafted with graphic of 3d mouse cursor. This image template contains the concept of data indication on computer. Use this image template for your computer technology related presentations.

Stock Photo 3d Blue Folder With Lock For Data Security PowerPoint Slide
This power point image template has been crafted with graphic of 3d blue folder and lock. This image contains the concept of data security. Use this image PPT for your technology and security related presentations.

Stock Photo World Map On Bar Graph For Data Growth Image Graphics For PowerPoint Slide
This image is designed with blue graph with world map printed on it. This conceptual image portrays the concepts of global business and global economy. This image slide will help you express your views to target audience.
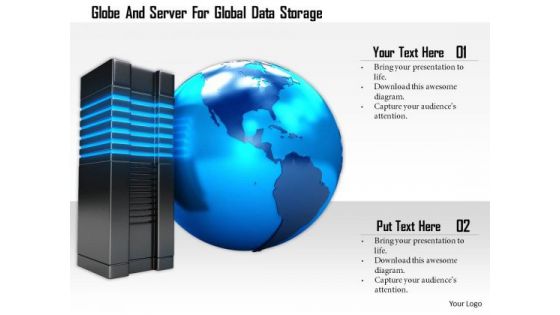
Stock Photo Globe And Server For Global Data Storage PowerPoint Slide
Graphic of globe and server has been used to design this PowerPoint template. This image slide contains the concept of technology and internet. Use this professional slide for technology related topics.
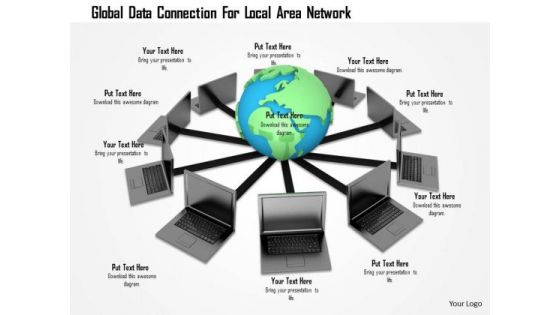
Stock Photo Global Data Connection For Local Area Network PowerPoint Slide
This Power point template has been designed with graphic of globe connected with laptops. This image slide contains the concept of global networking. Use this slide for your business network and communication related topics in any presentation.
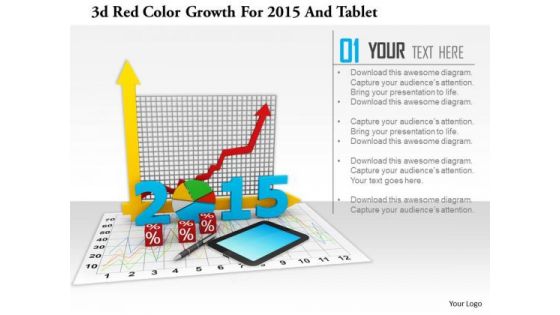
Stock Photo 3d Red Color Growth For 2015 And Tablet PowerPoint Slide
This image slide has graphics of financial charts and reports. This contains bar graph and pie chart to present business reports. Build an innovative presentation using this professional image slide.

Boosting Efficiency In ABC Inventory Management Dashboard Analysis
This slide illustrates ABC inventory management dashboard analysis includes elements such as product name, stock keeping unit, grade etc. Boost your pitch with our creative Boosting Efficiency In ABC Inventory Management Dashboard Analysis. Deliver an awe-inspiring pitch that will mesmerize everyone. Using these presentation templates you will surely catch everyones attention. You can browse the ppts collection on our website. We have researchers who are experts at creating the right content for the templates. So you do not have to invest time in any additional work. Just grab the template now and use them.
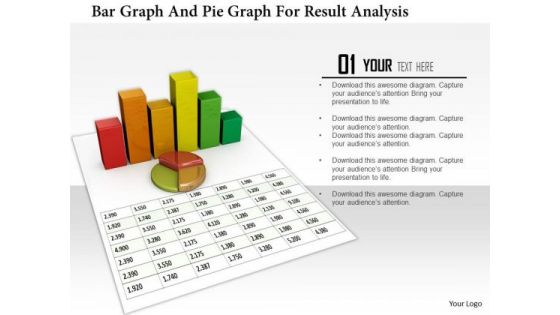
Stock Photo Bar Graph And Pie Graph For Result Analysis PowerPoint Slide
3D business graphs have been used to design this PowerPoint template. This Image slide is suitable to make business reports and charts. This slide can be used for business and marketing presentations.
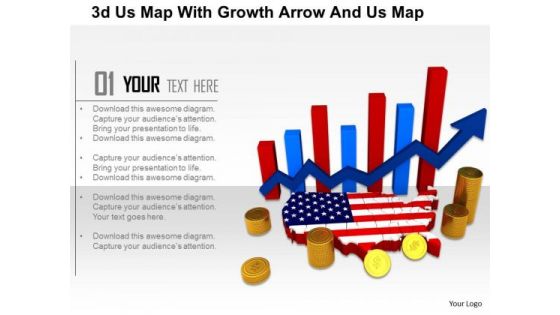
Stock Photo 3d Us Map With Growth Arrow And Us Map PowerPoint Slide
This image displays American map with business graph in background. This image slide contains the concept of American economy, business growth and reports. Use this amazing slide to make professional presentations.
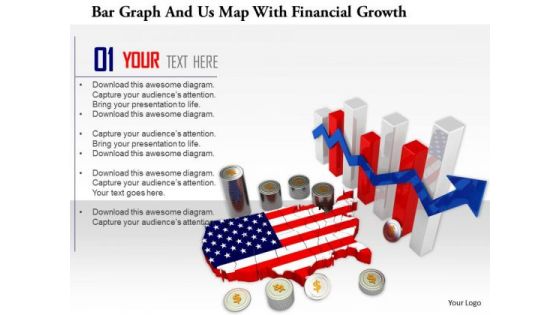
Stock Photo Bar Graph And Us Map With Financial Growth PowerPoint Slide
This image displays American map with business graph in background. This image slide contains the concept of American economy, business growth and reports. Use this amazing slide to make professional presentations.
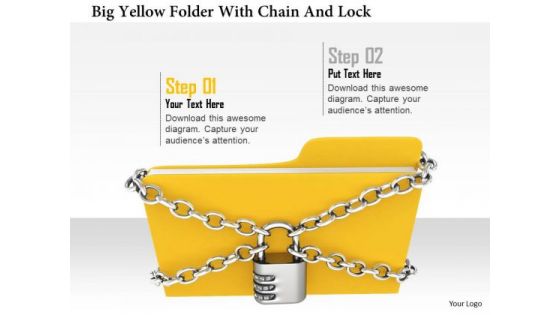
Stock Photo Big Yellow Folder With Chian And Lock PowerPoint Slide
A big yellow folder has been used to design this image slide. This yellow folder has been covered with chain and lock. This slide depicts the concept of data safety and security. Keep safe your data and display this massage in your presentation with this unique design

Stock Photo Three Black Computer Servers On White Background PowerPoint Slide
This image slide displays 3d black computer servers. This image has been designed with graphic of black computer servers with blue lights on white background. Use this image to express views on client server, data storage and backup. This image will enhance the quality of your presentations.
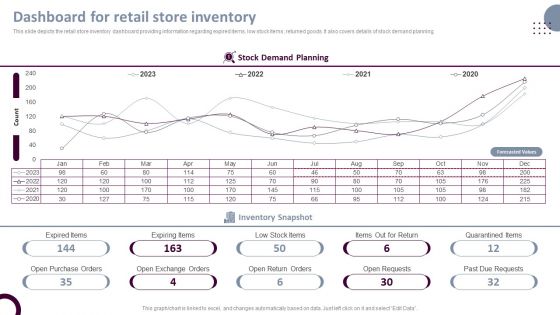
Retail Store Operations Dashboard For Retail Store Inventory Demonstration PDF
This slide depicts the retail store inventory dashboard providing information regarding expired items, low stock items, returned goods. It also covers details of stock demand planning. Are you in need of a template that can accommodate all of your creative concepts This one is crafted professionally and can be altered to fit any style. Use it with Google Slides or PowerPoint. Include striking photographs, symbols, depictions, and other visuals. Fill, move around, or remove text boxes as desired. Test out color palettes and font mixtures. Edit and save your work, or work with colleagues. Download Retail Store Operations Dashboard For Retail Store Inventory Demonstration PDF and observe how to make your presentation outstanding. Give an impeccable presentation to your group and make your presentation unforgettable.
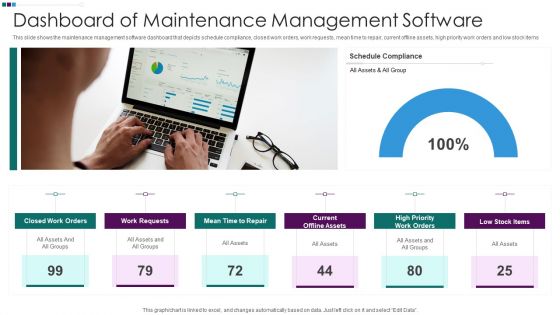
Dashboard Of Maintenance Management Software Ppt Slides Slideshow PDF
This slide shows the maintenance management software dashboard that depicts schedule compliance, closed work orders, work requests, mean time to repair, current offline assets, high priority work orders and low stock items. Showcasing this set of slides titled Dashboard Of Maintenance Management Software Ppt Slides Slideshow PDF. The topics addressed in these templates are Closed Work Orders, Work Requests Mean, Time To Repair, Current Offline Assets. All the content presented in this PPT design is completely editable. Download it and make adjustments in color, background, font etc. as per your unique business setting.
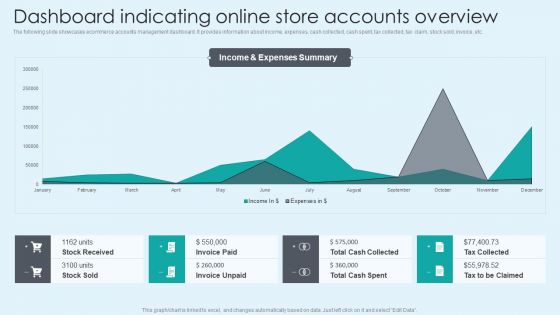
Dashboard Indicating Online Store Accounts Overview Introduction PDF
The following slide showcases ecommerce accounts management dashboard. It provides information about income, expenses, cash collected, cash spent, tax collected, tax claim, stock sold, invoice, etc. Presenting this PowerPoint presentation, titled Dashboard Indicating Online Store Accounts Overview Introduction PDF, with topics curated by our researchers after extensive research. This editable presentation is available for immediate download and provides attractive features when used. Download now and captivate your audience. Presenting this Dashboard Indicating Online Store Accounts Overview Introduction PDF. Our researchers have carefully researched and created these slides with all aspects taken into consideration. This is a completely customizable Dashboard Indicating Online Store Accounts Overview Introduction PDF that is available for immediate downloading. Download now and make an impact on your audience. Highlight the attractive features available with our PPTs.
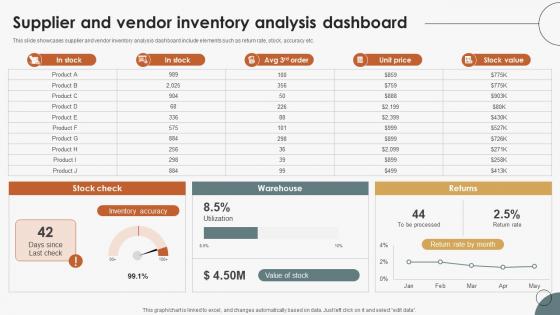
Boosting Efficiency In Inventory Supplier And Vendor Inventory Analysis Dashboard
This slide showcases supplier and vendor inventory analysis dashboard include elements such as return rate, stock, accuracy etc. The best PPT templates are a great way to save time, energy, and resources. Slidegeeks have 100 percent editable powerpoint slides making them incredibly versatile. With these quality presentation templates, you can create a captivating and memorable presentation by combining visually appealing slides and effectively communicating your message. Download Boosting Efficiency In Inventory Supplier And Vendor Inventory Analysis Dashboard from Slidegeeks and deliver a wonderful presentation.

ADC Cosmetics Company Dashboard With Variables Introduction PDF
This slide shows a cosmetics and skin care sales dashboard with KPIs such as Profit Margin in 2021, Cross Selling Rate, Market Size, Stock Turnover Rate, Social Media Usage, Revenue etc. Presenting adc cosmetics company dashboard with variables introduction pdf to provide visual cues and insights. Share and navigate important information on eight stages that need your due attention. This template can be used to pitch topics like profit margin, revenue, market size, social media, promotor score. In addition, this PPT design contains high-resolution images, graphics, etc, that are easily editable and available for immediate download.

ADC Cosmetics Company Dashboard With Variables Ppt Backgrounds PDF
This slide shows a cosmetics and skin care sales dashboard with KPIs such as Profit Margin in 2019, Cross Selling Rate , Market Size , Stock Turnover Rate , Social Media Usage, Revenue etc.Presenting adc cosmetics company dashboard with variables ppt backgrounds pdf. to provide visual cues and insights. Share and navigate important information on eight stages that need your due attention. This template can be used to pitch topics like stock turnover rate 2021, social media usage 2021, net promotor score 2021. In addtion, this PPT design contains high resolution images, graphics, etc, that are easily editable and available for immediate download.
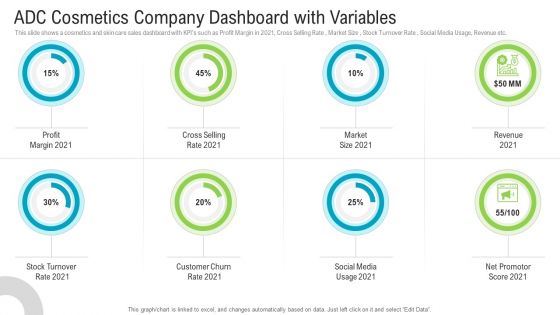
ADC Cosmetics Company Dashboard With Variables Summary PDF
This slide shows a cosmetics and skin care sales dashboard with KPIs such as Profit Margin in 2021, Cross Selling Rate , Market Size , Stock Turnover Rate , Social Media Usage, Revenue etc. Presenting adc cosmetics company dashboard with variables summary pdf to provide visual cues and insights. Share and navigate important information on eight stages that need your due attention. This template can be used to pitch topics like profit margin, cross selling rate, market size, revenue, stock turnover rate. In addtion, this PPT design contains high resolution images, graphics, etc, that are easily editable and available for immediate download.
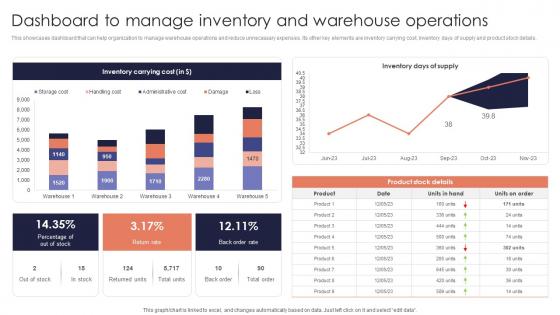
Dashboard Manage Inventory Minimizing Inventory Wastage Through Warehouse Microsoft Pdf
This showcases dashboard that can help organization to manage warehouse operations and reduce unnecessary expenses. Its other key elements are inventory carrying cost, inventory days of supply and product stock details. There are so many reasons you need a Dashboard Manage Inventory Minimizing Inventory Wastage Through Warehouse Microsoft Pdf. The first reason is you can not spend time making everything from scratch, Thus, Slidegeeks has made presentation templates for you too. You can easily download these templates from our website easily.
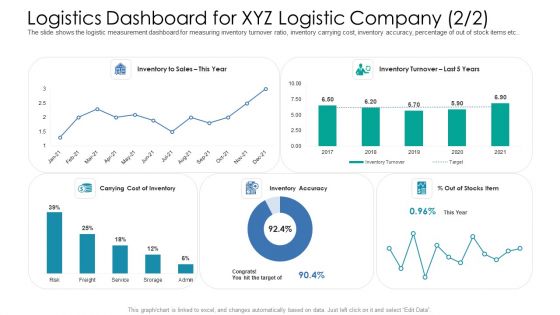
Logistics Dashboard For XYZ Logistic Company Cost Ppt Example PDF
The slide shows the logistic measurement dashboard for measuring inventory turnover ratio, inventory carrying cost, inventory accuracy, percentage of out of stock items etc.Deliver an awe-inspiring pitch with this creative logistics dashboard for XYZ logistic company cost ppt example pdf. bundle. Topics like inventory to sales, carrying cost of inventory, inventory accuracy, 2017 to 2021 can be discussed with this completely editable template. It is available for immediate download depending on the needs and requirements of the user.

 Home
Home