AI PPT Maker
Templates
PPT Bundles
Design Services
Business PPTs
Business Plan
Management
Strategy
Introduction PPT
Roadmap
Self Introduction
Timelines
Process
Marketing
Agenda
Technology
Medical
Startup Business Plan
Cyber Security
Dashboards
SWOT
Proposals
Education
Pitch Deck
Digital Marketing
KPIs
Project Management
Product Management
Artificial Intelligence
Target Market
Communication
Supply Chain
Google Slides
Research Services
 One Pagers
All Categories
-
Home
- Customer Favorites
- Dashboard Stock
Dashboard Stock
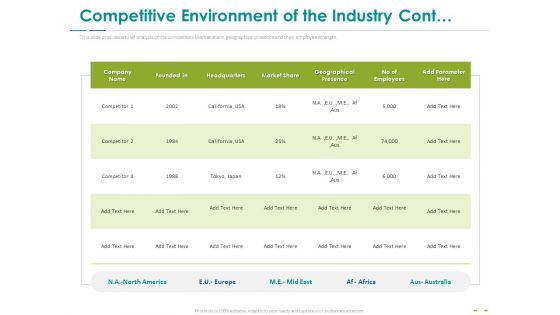
Stock Market Research Report Competitive Environment Of The Industry Cont Template PDF
This slide provides a brief analysis of the competitors Market share, geographical presence and their employee strength. Deliver an awe-inspiring pitch with this creative stock market research report competitive environment of the industry cont template pdf bundle. Topics like market share, headquarters, geographical presence, employees can be discussed with this completely editable template. It is available for immediate download depending on the needs and requirements of the user.
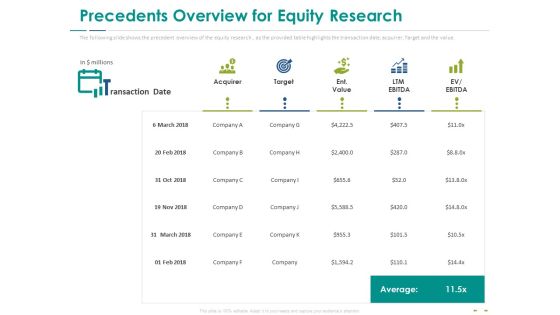
Stock Market Research Report Precedents Overview For Equity Research Inspiration PDF
The following slide shows the precedent overview of the equity research, as the provided table highlights the transaction date, acquirer, Target and the value. Deliver and pitch your topic in the best possible manner with this stock market research report precedents overview for equity research inspiration pdf. Use them to share invaluable insights on acquirer, target ent value, ltm ebitda and impress your audience. This template can be altered and modified as per your expectations. So, grab it now.
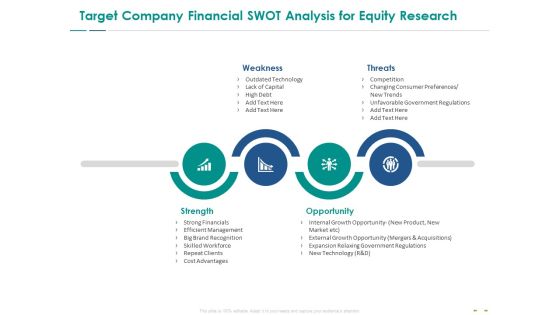
Stock Market Research Report Target Company Financial SWOT Analysis For Equity Research Guidelines PDF
Presenting stock market research report target company financial swot analysis for equity research guidelines pdf to provide visual cues and insights. Share and navigate important information on four stages that need your due attention. This template can be used to pitch topics like weakness, threats, strength, opportunity. In addition, this PPT design contains high-resolution images, graphics, etc, that are easily editable and available for immediate download.
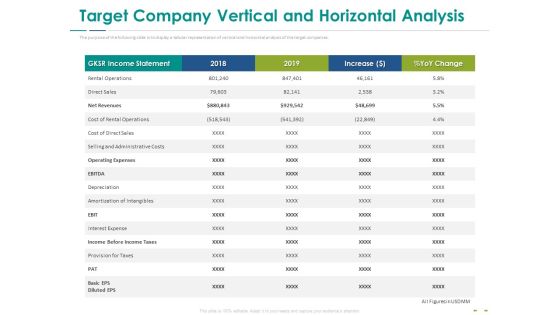
Stock Market Research Report Target Company Vertical And Horizontal Analysis Information PDF
The purpose of the following slide is to display a tabular representation of vertical and horizontal analysis of the target companies. Deliver and pitch your topic in the best possible manner with this stock market research report target company vertical and horizontal analysis information pdf. Use them to share invaluable insights on rental operations, direct sales, net revenues, provision for taxes, operating expenses and impress your audience. This template can be altered and modified as per your expectations. So, grab it now.

Stock Market Research Report Risk Rating Ppt PowerPoint Presentation Infographic Template Diagrams PDF
The purpose of the following slide is to provide rating to the multiple risk based on their impact and probability. Deliver an awe-inspiring pitch with this creative stock market research report risk rating ppt powerpoint presentation infographic template diagrams pdf bundle. Topics like risk elements, risk rating key, risk category, high, low, medium can be discussed with this completely editable template. It is available for immediate download depending on the needs and requirements of the user.
Stock Market Research Report Equity Research Team Members Ppt PowerPoint Presentation File Graphic Tips PDF
Presenting stock market research report equity research team members ppt powerpoint presentation file graphic tips pdf to provide visual cues and insights. Share and navigate important information on two stages that need your due attention. This template can be used to pitch topics like equity research team. In addition, this PPT design contains high-resolution images, graphics, etc, that are easily editable and available for immediate download.
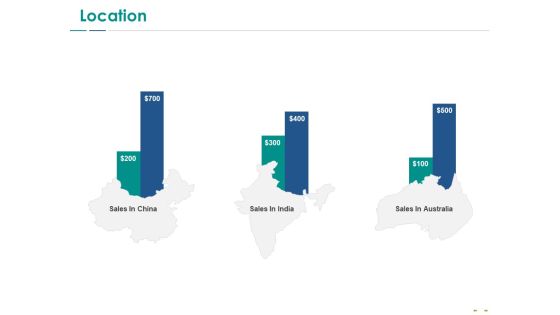
Stock Market Research Report Location Ppt PowerPoint Presentation File Clipart Images PDF
This is a stock market research report location ppt powerpoint presentation file clipart images pdf template with various stages. Focus and dispense information on three stages using this creative set, that comes with editable features. It contains large content boxes to add your information on topics like location, sales. You can also showcase facts, figures, and other relevant content using this PPT layout. Grab it now.

Investment Fundraising Pitch Deck From Stock Market Competitive Analysis Financial And Operational Data Template PDF
The slide provides the Competitive landscape of the company on the basis of financial data sales and profit and operational data employee count, locations, number of branches, year of existence, interest rate etc. Deliver and pitch your topic in the best possible manner with this investment fundraising pitch deck from stock market competitive analysis financial and operational data template pdf. Use them to share invaluable insights on competitive factor, performing, revenue, interest rate, employee count and impress your audience. This template can be altered and modified as per your expectations. So, grab it now.
Ways Artificial Intelligence Is Transforming Finance Sector Generalized Model For Stock Market Prediction Icons PDF
This slide showcases model that can help institutional investors to predict and make investments in market. Its key elements are technical indicators, data preprocessing, feature extraction, AI ML models and model evaluation. Get a simple yet stunning designed Ways Artificial Intelligence Is Transforming Finance Sector Generalized Model For Stock Market Prediction Icons PDF. It is the best one to establish the tone in your meetings. It is an excellent way to make your presentations highly effective. So, download this PPT today from Slidegeeks and see the positive impacts. Our easy to edit Ways Artificial Intelligence Is Transforming Finance Sector Generalized Model For Stock Market Prediction Icons PDF can be your go to option for all upcoming conferences and meetings. So, what are you waiting for Grab this template today.

Stock Performance Metrics For Operation Management Ppt Ideas Format Ideas PDF
This slide shows the operation management inventory KPIs. It includes variables such as activity, measure, UOM, best-in-class, median and worst. Pitch your topic with ease and precision using this Stock Performance Metrics For Operation Management Ppt Ideas Format Ideas PDF. This layout presents information on Operations Mgmt, Shipping, Overall. It is also available for immediate download and adjustment. So, changes can be made in the color, design, graphics or any other component to create a unique layout.

Stock Market Research Report Key Industry Trends For Equity Research Mockup PDF
The following slide to enlists various Industry trends that will influence the market and will influence the company. This is a stock market research report key industry trends for equity research mockup pdf template with various stages. Focus and dispense information on five stages using this creative set, that comes with editable features. It contains large content boxes to add your information on topics like new byod technology, increase crypto currency, coud computing, increase use ai. You can also showcase facts, figures, and other relevant content using this PPT layout. Grab it now.
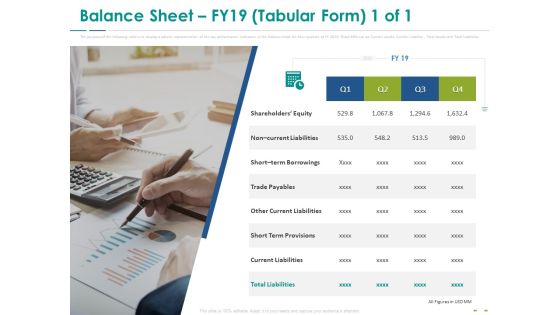
Stock Market Research Report Balance Sheet FY19 Tabular Form Equity Information PDF
The purpose of the following slide is to display the key performance indicators of the balance sheet for four quarters of FY 2019. These KPIs can be Current assets, Current Liability , Total Assets and Total Liabilities. Presenting stock market research report balance sheet fy19 tabular form equity information pdf to provide visual cues and insights. Share and navigate important information on one stages that need your due attention. This template can be used to pitch topics like non current liabilities, short term borrowings, trade payables, other current liabilities, short term provisions. In addition, this PPT design contains high-resolution images, graphics, etc, that are easily editable and available for immediate download.

Kpis To Measure Supply Chain Stock Management System Effectiveness Introduction PDF
This slide presents various metrics to analyze effectiveness of supply chain inventory control system. It includes key components such as KPI, actual performance, benchmark performance and strategies to improve. Showcasing this set of slides titled Kpis To Measure Supply Chain Stock Management System Effectiveness Introduction PDF. The topics addressed in these templates are Actual, Benchmark, Strategies To Improve. All the content presented in this PPT design is completely editable. Download it and make adjustments in color, background, font etc. as per your unique business setting.

Stock Market Research Report Income Statement Of Target Company Background PDF
The purpose of the following slide is to display the organizations profit and loss statements Key Performance Indicators such as Net Sales, Expenses, EBITDA and Profit before and after tax. Deliver and pitch your topic in the best possible manner with this stock market research report income statement of target company background pdf. Use them to share invaluable insights on revenue, gross profit, operating expenses, research and development, sales and marketing and impress your audience. This template can be altered and modified as per your expectations. So, grab it now.
Stock Market Trading Flowchart To Identify Market Position Trends Icons PDF
Following slide highlights trading flowchart which benefits investors to understand market opening positions, determine current situation and plan for better returns. This slide includes information about trend analysis, types of trend such as bullish, bearish, sideways and exercise positions. Presenting Stock Market Trading Flowchart To Identify Market Position Trends Icons PDF to dispense important information. This template comprises three stages. It also presents valuable insights into the topics including Sideways Trend, Trend Analyses, Trade Planning. This is a completely customizable PowerPoint theme that can be put to use immediately. So, download it and address the topic impactfully.
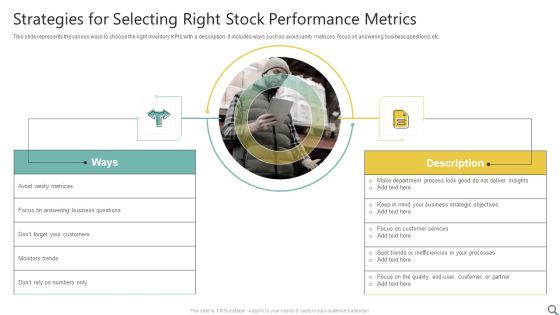
Strategies For Selecting Right Stock Performance Metrics Ppt Infographics Visuals PDF
This slide represents the various ways to choose the right inventory KPIs with a description. It includes ways such as avoid vanity metrices, focus on answering business questions, etc. Persuade your audience using this Strategies For Selecting Right Stock Performance Metrics Ppt Infographics Visuals PDF. This PPT design covers two stages, thus making it a great tool to use. It also caters to a variety of topics including Avoid Vanity Metrices, Monitors Trends, Customer Services. Download this PPT design now to present a convincing pitch that not only emphasizes the topic but also showcases your presentation skills.
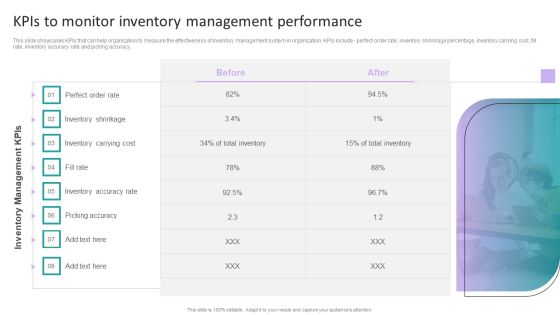
Stock Inventory Acquisition Kpis To Monitor Inventory Management Performance Template PDF
This slide showcases KPIs that can help organization to measure the effectiveness of inventory management system in organization. KPIs include - perfect order rate, inventory shrinkage percentage, inventory carrying cost, fill rate, inventory accuracy rate and picking accuracy. Want to ace your presentation in front of a live audience Our Stock Inventory Acquisition Kpis To Monitor Inventory Management Performance Template PDF can help you do that by engaging all the users towards you. Slidegeeks experts have put their efforts and expertise into creating these impeccable powerpoint presentations so that you can communicate your ideas clearly. Moreover, all the templates are customizable, and easy-to-edit and downloadable. Use these for both personal and commercial use.

Stock Market Research Report Target Company Overview For Equity Research Ppt PowerPoint Presentation Show Graphics PDF
The purpose of the following slide is to provide an overview of the company on which the equity research report is being made. This slide highlights the year in which the company was founded in, number of employees it has, multiple global locations etc. Deliver and pitch your topic in the best possible manner with this stock market research report target company overview for equity research ppt powerpoint presentation show graphics pdf. Use them to share invaluable insights on target, key highlights, headquartered, employees, net sales fiscal year 2019, research report. and impress your audience. This template can be altered and modified as per your expectations. So, grab it now.
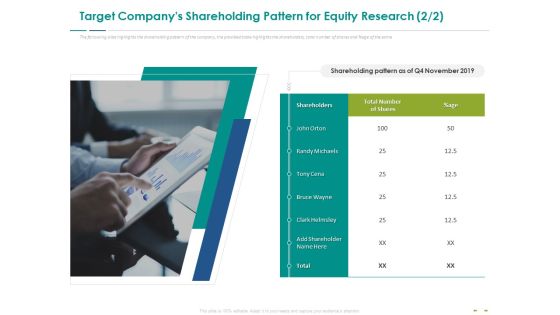
Stock Market Research Report Target Companys Shareholding Pattern For Equity Research Pattern Ideas PDF
The following slide highlights the shareholding pattern of the company, the provided table highlights the shareholders, total number of shares and percentage of the same. This is a stock market research report target companys shareholding pattern for equity research pattern ideas pdf template with various stages. Focus and dispense information on one stages using this creative set, that comes with editable features. It contains large content boxes to add your information on topics like shareholders, shareholding pattern, q4 november 2019. You can also showcase facts, figures, and other relevant content using this PPT layout. Grab it now.

Stock Market Research Report Liquidity Ratio FY 19 For Equity Research Diagrams PDF
The following slide displays the analysis of the companies liquidity ratio of the financial year 19 as its analysis the current ratio, quick ratio and the net working capital of the organization. This is a stock market research report liquidity ratio fy 19 for equity research diagrams pdf template with various stages. Focus and dispense information on one stages using this creative set, that comes with editable features. It contains large content boxes to add your information on topics like current ratio, quick ratio, current asset, current liability, current asset, inventory, current liability. You can also showcase facts, figures, and other relevant content using this PPT layout. Grab it now.
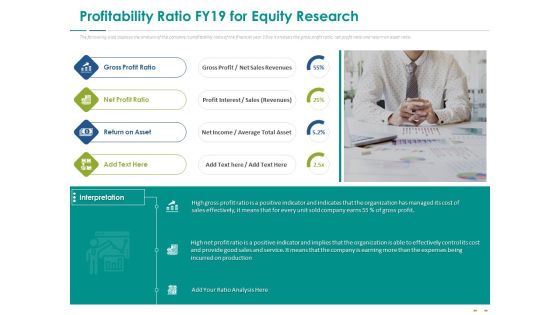
Stock Market Research Report Profitability Ratio FY19 For Equity Research Ideas PDF
The following slide displays the analysis of the companys profitability ratio of the financial year 19 as it analysis the gross profit ratio, net profit ratio and return on asset ratio. This is a stock market research report profitability ratio fy19 for equity research ideas pdf template with various stages. Focus and dispense information on four stages using this creative set, that comes with editable features. It contains large content boxes to add your information on topics like gross profit ratio, net profit ratio, return on asset, net income. You can also showcase facts, figures, and other relevant content using this PPT layout. Grab it now.

Stock Market Research Report Analyst Highlights Ppt PowerPoint Presentation Slides Background Designs PDF
The purpose of the following slide is to highlight the process of equity research which starts from Industry analysis and ends with recommendations from the analyst. This is a stock market research report analyst highlights ppt powerpoint presentation slides background designs pdf template with various stages. Focus and dispense information on one stages using this creative set, that comes with editable features. It contains large content boxes to add your information on topics like total revenue, operating income, net income, 2018, 2019. You can also showcase facts, figures, and other relevant content using this PPT layout. Grab it now.

Stock Market Research Report Discounted Cash Flow Method For Company Valuation Formats PDF
The purpose o the following slide is to provide target company valuation using discounted cash flow method , the provided table hoighlights the net operating losses , free cash flow and total enterprise valuation of the target company. Deliver and pitch your topic in the best possible manner with this stock market research report discounted cash flow method for company valuation formats pdf. Use them to share invaluable insights on net operating year, opening balance, current loss, closing balance and impress your audience. This template can be altered and modified as per your expectations. So, grab it now.
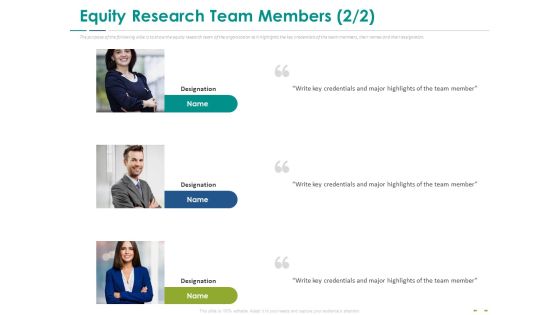
Stock Market Research Report Equity Research Team Members Planning Infographics PDF
The purpose of the following slide is to show the equity research team of the organization as it highlights the key credentials of the team members, their names and their designation. Presenting stock market research report equity research team members planning infographics pdf to provide visual cues and insights. Share and navigate important information on three stages that need your due attention. This template can be used to pitch topics like equity research team. In addition, this PPT design contains high-resolution images, graphics, etc, that are easily editable and available for immediate download.

Stock Market Research Report Target Companys Shareholding Pattern For Equity Research Structure PDF
The following slide displays the share holding pattern of the company, the graph provides percentage of shares that are held by promotor groups, domestic institutional investors, foreign Institutional investors, Private Corporate Bodies and General public. Deliver an awe-inspiring pitch with this creative stock market research report target companys shareholding pattern for equity research structure pdf bundle. Topics like general public, promoter group, domestic institutional investors, private corporate bodies, foreign institutional investors can be discussed with this completely editable template. It is available for immediate download depending on the needs and requirements of the user.

Stock Market Research Report Liquidity Analysis Of Company For Equity Research Designs PDF
The following slide displays the analysis of the companies liquidity ratio of the financial year 18 and 19 as its analysis the current ratio, quick ratio and the net working capital of the organization. Deliver an awe-inspiring pitch with this creative stock market research report liquidity analysis of company for equity research designs pdf bundle. Topics like current ratio, quick ratio, 2017 to 2020 can be discussed with this completely editable template. It is available for immediate download depending on the needs and requirements of the user.

Stock Market Research Report Methods Used For Valuation In Equity Research Guidelines PDF
The following slide displays the equity valuation methods such as balance sheet methods, earning multiple methods and discounted cash flow method. Presenting stock market research report methods used for valuation in equity research guidelines pdf to provide visual cues and insights. Share and navigate important information on seven stages that need your due attention. This template can be used to pitch topics like relative valuation approach, discounted cash flow, projections, discount rate, present value, sensitivity analysis, terminal value, adjustments. In addition, this PPT design contains high-resolution images, graphics, etc, that are easily editable and available for immediate download.
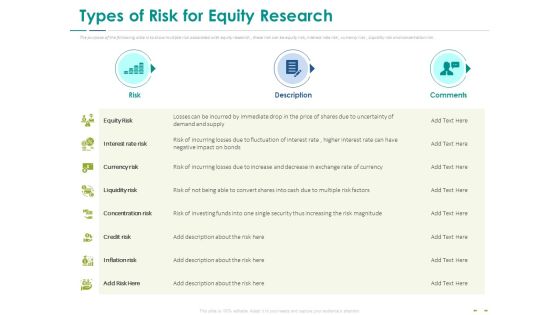
Stock Market Research Report Types Of Risk For Equity Research Ppt PowerPoint Presentation Slides Tips PDF
The purpose of the following slide is to show multiple risk associated with equity research , these risk can be equity risk, interest rate risk , currency risk , Liquidity risk and concertation risk. Deliver and pitch your topic in the best possible manner with this stock market research report types of risk for equity research ppt powerpoint presentation slides tips pdf. Use them to share invaluable insights on equity risk, interest rate risk, currency risk, liquidity risk, concentration risk and impress your audience. This template can be altered and modified as per your expectations. So, grab it now.
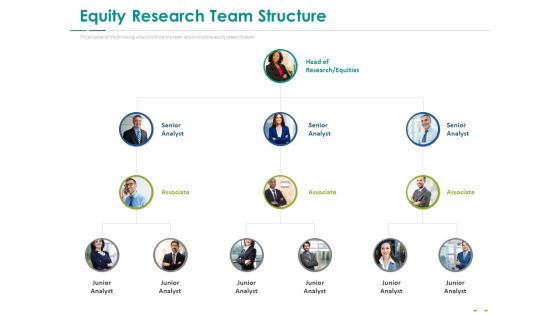
Stock Market Research Report Equity Research Team Structure Ppt PowerPoint Presentation Infographic Template Example PDF
The purpose of the following slide is to show the team structure of the equity research team. This is a stock market research report equity research team structure ppt powerpoint presentation infographic template example pdf template with various stages. Focus and dispense information on four stages using this creative set, that comes with editable features. It contains large content boxes to add your information on topics like senior analyst, associate, head research, equities. You can also showcase facts, figures, and other relevant content using this PPT layout. Grab it now.
Stock Market Research Report Table Of Content Ppt Icon Professional PDF
This is a stock market research report table of content ppt icon professional pdf template with various stages. Focus and dispense information on eight stages using this creative set, that comes with editable features. It contains large content boxes to add your information on topics like executive summary, industry overview, target company highlights, financial ratio analysis, valuation analysis, risk factors, about our company, review and rating . You can also showcase facts, figures, and other relevant content using this PPT layout. Grab it now.

Stock Market Trading Strategies For Various Types Of Investors Demonstration PDF
This slide represents different trading approaches for every trader which helps them to build plan, test new techniques for financial gains and improve existing position. Trading techniques included in this slide are new, end-of-day, swing, trend and position. Pitch your topic with ease and precision using this Stock Market Trading Strategies For Various Types Of Investors Demonstration PDF. This layout presents information on Market Expectations, Risk Management, Price. It is also available for immediate download and adjustment. So, changes can be made in the color, design, graphics or any other component to create a unique layout.

Investment Fundraising Pitch Deck From Stock Market Organization Chart Diagram Of The Company Board Graphics PDF
The slide provides the diagram which shows hierarchy structure relation or reporting of one official to another of the company from N Level to N-2 level. This is a investment fundraising pitch deck from stock market organization chart diagram of the company board graphics pdf template with various stages. Focus and dispense information on three stages using this creative set, that comes with editable features. It contains large content boxes to add your information on topics like executive, corporate, wholesale, investment, treasury operations. You can also showcase facts, figures, and other relevant content using this PPT layout. Grab it now.
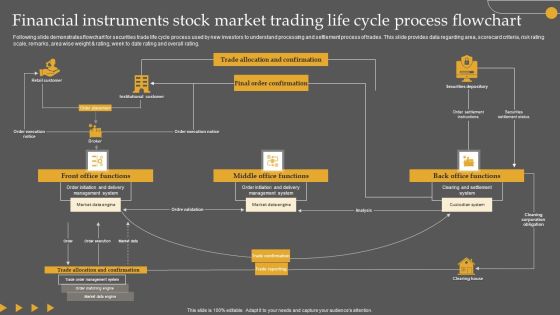
Financial Instruments Stock Market Trading Life Cycle Process Flowchart Designs PDF
Following slide demonstrates flowchart for securities trade life cycle process used by new investors to understand processing and settlement process of trades. This slide provides data regarding area, scorecard criteria, risk rating scale, remarks, area wise weight and rating, week to date rating and overall rating. Pitch your topic with ease and precision using this Financial Instruments Stock Market Trading Life Cycle Process Flowchart Designs PDF. This layout presents information on Management System, Market Data Engine, Execution. It is also available for immediate download and adjustment. So, changes can be made in the color, design, graphics or any other component to create a unique layout.

Investment Fundraising Pitch Deck From Stock Market Consolidated Balance Sheet 2017 2021 Summary PDF
The slide provides the historical data of the companys balance sheet from the year 2015-2021. Key Data points include total current assets, fixed assets, total assets, current and long-term labilities etc. Deliver and pitch your topic in the best possible manner with this investment fundraising pitch deck from stock market consolidated balance sheet 2017 2021 summary pdf. Use them to share invaluable insights on financial debt, liabilities, inventories, intangible assets and impress your audience. This template can be altered and modified as per your expectations. So, grab it now.
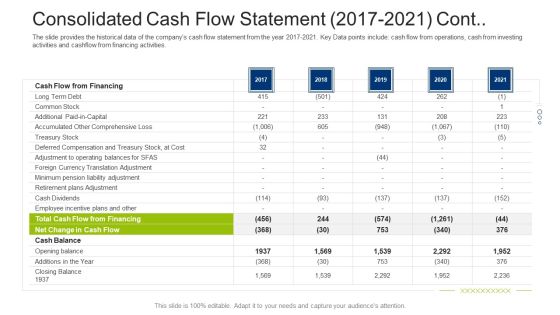
Investment Fundraising Pitch Deck From Stock Market Consolidated Cash Flow Statement 2017 2021 Cont Themes PDF
The slide provides the historical data of the companys cash flow statement from the year 2015-2019. Key Data points include cash flow from operations, cash from investing activities and cashflow from financing activities. Deliver an awe inspiring pitch with this creative investment fundraising pitch deck from stock market consolidated cash flow statement 2017 2021 cont themes pdf bundle. Topics like financing, treasury, incentive, plans, cash flow can be discussed with this completely editable template. It is available for immediate download depending on the needs and requirements of the user.

Investment Fundraising Pitch Deck From Stock Market Consolidated Cash Flow Statement 2017 2021 Rules PDF
The slide provides the historical data of the companys cash flow statement from the year 2017-2021. Key Data points include cash flow from operations, cash from investing activities and cashflow from financing activities. Deliver and pitch your topic in the best possible manner with this investment fundraising pitch deck from stock market consolidated cash flow statement 2017 2021 rules pdf. Use them to share invaluable insights on obligations, investing, liabilities, electronic equipment, facilities and impress your audience. This template can be altered and modified as per your expectations. So, grab it now.

Convertible Preferred Stock Funding Pitch Deck Why This Is Right Time To Enter Market Elements PDF
This slides shows the historical data of obesity rate in united states 2000 2020. The slide explains the rationale behind the companys founding. Deliver and pitch your topic in the best possible manner with this convertible preferred stock funding pitch deck why this is right time to enter market elements pdf. Use them to share invaluable insights on growing obesity rate in united states, obesity rate in united states 2000 2020 and impress your audience. This template can be altered and modified as per your expectations. So, grab it now.
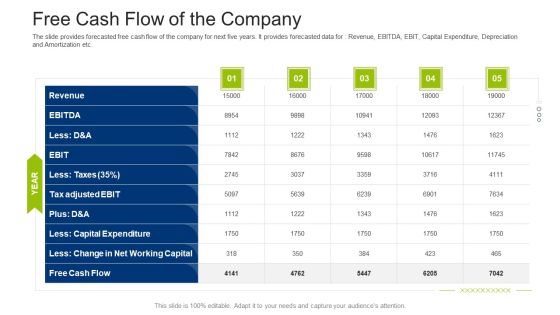
Investment Fundraising Pitch Deck From Stock Market Free Cash Flow Of The Company Brochure PDF
The slide provides forecasted free cash flow of the company for next five years. It provides forecasted data for Revenue, EBITDA, EBIT, Capital Expenditure, Depreciation and Amortization etc. Deliver and pitch your topic in the best possible manner with this investment fundraising pitch deck from stock market free cash flow of the company brochure pdf. Use them to share invaluable insights on capital expenditure, revenue, change in net working capital, cash flow and impress your audience. This template can be altered and modified as per your expectations. So, grab it now.

Investment Fundraising Pitch Deck From Stock Market Total Revenue Forecast For Next Five Years Ideas PDF
The slide provides the revenue projections of the company for next five years. Key Data points include Interest income, investment income, commission income, non-interest income etc. Deliver an awe inspiring pitch with this creative investment fundraising pitch deck from stock market total revenue forecast for next five years ideas pdf bundle. Topics like revenue, commission income, investment income, average interest rate can be discussed with this completely editable template. It is available for immediate download depending on the needs and requirements of the user.

Investment Fundraising Pitch Deck From Stock Market Key Financial Projection For Next Five Years Graphics PDF
The slide provides the financials projections of the company for next five years. Key Data points include revenue, operating income, net income, cash flow, cash in hand, total assets etc. Deliver an awe inspiring pitch with this creative investment fundraising pitch deck from stock market key financial projection for next five years graphics pdf bundle. Topics like financing, cash flow, revenue, operating expense, operating income can be discussed with this completely editable template. It is available for immediate download depending on the needs and requirements of the user.
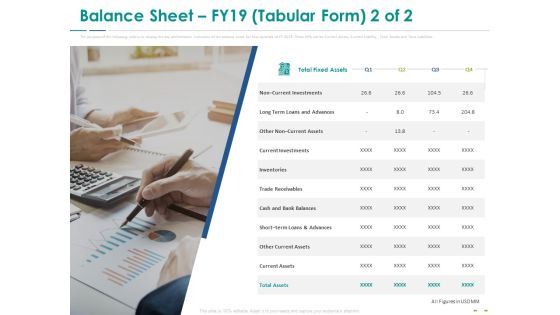
Stock Market Research Report Balance Sheet FY19 Tabular Form Investments Designs PDF
The purpose of the following slide is to display a tabular representation of the key performance indicators of the balance sheet for four quarters of FY 2019. These KPIs can be Current assets, Current Liability , Total Assets and Total Liabilities. This is a stock market research report balance sheet fy19 tabular form investments designs pdf template with various stages. Focus and dispense information on one stages using this creative set, that comes with editable features. It contains large content boxes to add your information on topics like non current investments, long term loans and advances, current investments, inventories, trade receivables. You can also showcase facts, figures, and other relevant content using this PPT layout. Grab it now.

Procurement Strategies For Reducing Stock Wastage Kpis To Monitor Inventory Template PDF
This slide showcases KPIs that can help organization to measure the effectiveness of inventory management system in organization. KPIs include perfect order rate, inventory shrinkage percentage, inventory carrying cost, fill rate, inventory accuracy rate and picking accuracy. Coming up with a presentation necessitates that the majority of the effort goes into the content and the message you intend to convey. The visuals of a PowerPoint presentation can only be effective if it supplements and supports the story that is being told. Keeping this in mind our experts created Procurement Strategies For Reducing Stock Wastage Kpis To Monitor Inventory Template PDF to reduce the time that goes into designing the presentation. This way, you can concentrate on the message while our designers take care of providing you with the right template for the situation.

Stock Market Research Report Review And Rating Market Capitalization Elements PDF
The purpose of the following slide is to show the review and ratings of the company provided by the analyst. The table highlights P or E ratio, valuation score, Net profit. The table also provides weightage average of the same. This is a stock market research report review and rating market capitalization elements pdf template with various stages. Focus and dispense information on one stages using this creative set, that comes with editable features. It contains large content boxes to add your information on topics like profit to equity ratio, profit to book value ratio, valuation score, market capitalization, operating revenue. You can also showcase facts, figures, and other relevant content using this PPT layout. Grab it now.

Executing Techniques For Stock Administration And Control Ppt PowerPoint Presentation Complete Deck With Slides
With well-researched insights and carefully-constructed design, this Executing Techniques For Stock Administration And Control Ppt PowerPoint Presentation Complete Deck With Slides is all that you need for your next business meeting with clients and win them over. Add your data to graphs, charts, and tables that are already ready to display it with stunning visuals and help your audience recall your work. With this PPT Complete Deck, you will be able to display your knowledge of the subject as well as your skills as a communicator. Share your ideas and make an impact on the audience with this PowerPoint Layout and ensure that you are known as a presentation professional. Download this PPT Template Bundle to create the most interesting presentation anyone has ever seen.
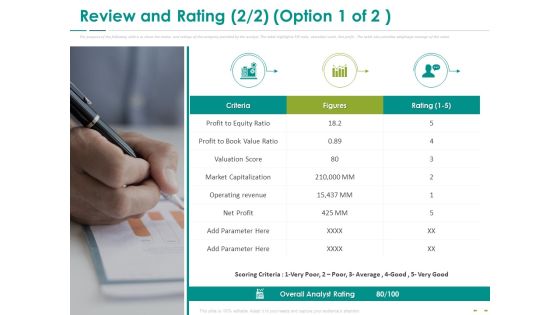
Stock Market Research Report Review And Rating Equity Ratio Ppt PowerPoint Presentation File Inspiration PDF
The purpose of the following slide is to show the review and ratings of the company provided by the analyst. The table highlights P or E ratio, valuation score, Net profit. The table also provides weightage average of the same. This is a stock market research report review and rating equity ratio ppt powerpoint presentation file inspiration pdf template with various stages. Focus and dispense information on one stages using this creative set, that comes with editable features. It contains large content boxes to add your information on topics like profit to equity ratio, profit to book value ratio, valuation score, market capitalization. You can also showcase facts, figures, and other relevant content using this PPT layout. Grab it now.
Stock Market Research Report Asset Management Turnover Ratios FY 19 For Equity Research Icons PDF
The following slide displays the analysis of the companys asset management or turnover ratio of the financial year 19 as it analysis the account payable ratio, asset turnover ratio , fixed asset turnover ratio and inventory turnover ratio. This is a stock market research report asset management turnover ratios fy 19 for equity research icons pdf template with various stages. Focus and dispense information on five stages using this creative set, that comes with editable features. It contains large content boxes to add your information on topics like account payable turnover ratio, asset turnover ratio, fixed asset turnover ratio, inventory turnover ratio, receivable turnover ratio. You can also showcase facts, figures, and other relevant content using this PPT layout. Grab it now.

Stock Market Research Report Leverage Ratios FY19 For Equity Research Ppt Infographics Elements PDF
The following slide displays the analysis of the companys leverage ratio o of the financial year 19 as it analysis the debt to asset ratio, debt to equity ratio, debt to capital ratio and debt to EBITDA ratio. Presenting stock market research report leverage ratios fy19 for equity research ppt infographics elements pdf to provide visual cues and insights. Share and navigate important information on five stages that need your due attention. This template can be used to pitch topics like debt to assets ratio, debt to equity ratio, debt to capital ratio, debt to ebitda ratio, asset to equity ratio. In addition, this PPT design contains high-resolution images, graphics, etc, that are easily editable and available for immediate download.
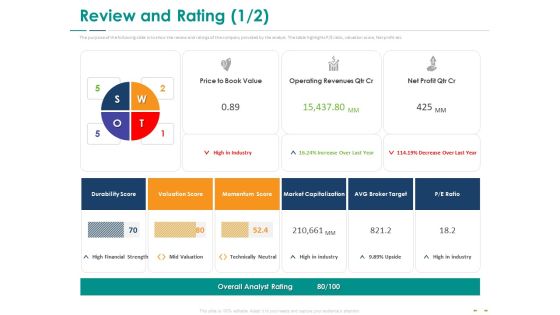
Stock Market Research Report Review And Rating Ppt PowerPoint Presentation Model Graphics PDF
The purpose of the following slide is to show the review and ratings of the company provided by the analyst. The table highlights P or E ratio, valuation score, Net profit etc. This is a stock market research report review and rating ppt powerpoint presentation model graphics pdf template with various stages. Focus and dispense information on four stages using this creative set, that comes with editable features. It contains large content boxes to add your information on topics like price to book value, operating revenues qtr cr, net profit qtr cr, high in industry, durability score, valuation score, momentum score, market capitalization, avg broker target, p or e ratio. You can also showcase facts, figures, and other relevant content using this PPT layout. Grab it now.

Dashboard Of Maintenance Management Software Ppt Slides Slideshow PDF
This slide shows the maintenance management software dashboard that depicts schedule compliance, closed work orders, work requests, mean time to repair, current offline assets, high priority work orders and low stock items. Showcasing this set of slides titled Dashboard Of Maintenance Management Software Ppt Slides Slideshow PDF. The topics addressed in these templates are Closed Work Orders, Work Requests Mean, Time To Repair, Current Offline Assets. All the content presented in this PPT design is completely editable. Download it and make adjustments in color, background, font etc. as per your unique business setting.

Stock Photo Black Brown Pie Chart For Business Result PowerPoint Slide
This high quality image is designed with pie chart. Use this image to make business reports. Use this outstanding image in presentations relating to data analysis and reports. Go ahead and add charm to your presentations.
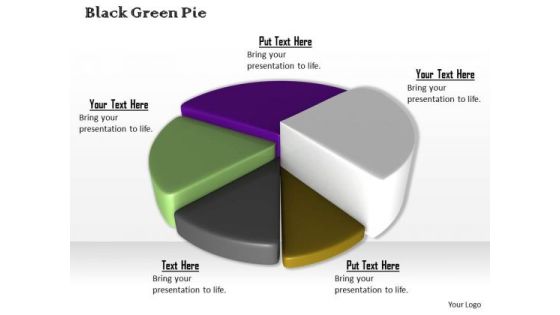
Stock Photo Colorful 3d Pie Chart For Business Result PowerPoint Slide
This high quality image is designed with pie chart. Use this image to make business reports. Use this outstanding image in presentations relating to data analysis and reports. Go ahead and add charm to your presentations.
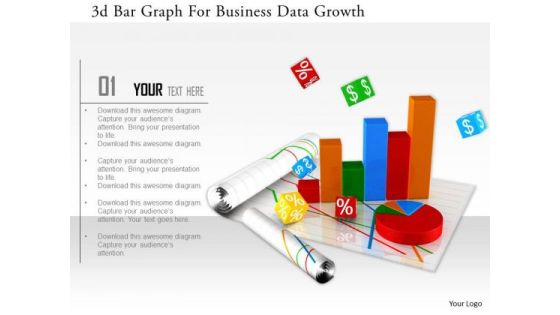
Stock Photo 3d Bar Graph For Business Data Growth Image Graphics For PowerPoint Slide
This image slide has graphics of financial charts and reports. This contains bar graph and pie chart to present business reports. Build an innovative presentations using this professional image slide.

Stock Photo Bar Graph With Cubes For Financial Data PowerPoint Slide
Graphic of bar graph and cubes are used to decorate this image template. This PPT contains the concept of financial data analysis. Use this PPT for finance and business related presentations.
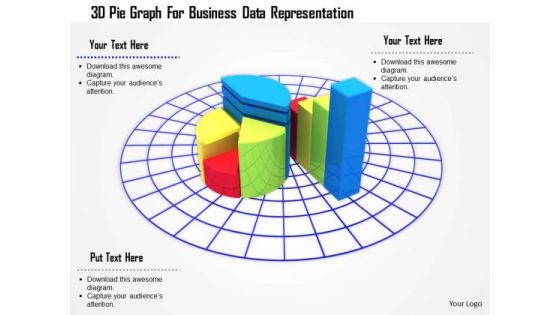
Stock Photo 3d Pie Graph For Business Data Representation PowerPoint Slide
3D business graph has been used to design this PowerPoint template. This Image slide is suitable to make business reports and charts. This slide can be used for business and marketing presentations.
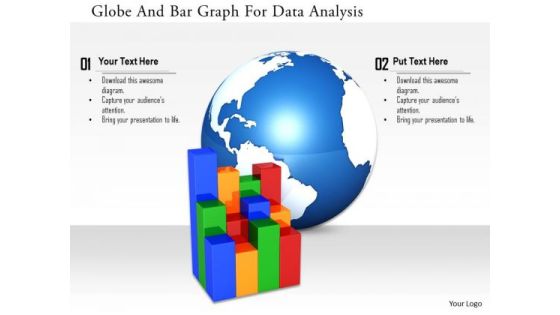
Stock Photo Globe And Bar Graph For Data Analysis Image Graphics For PowerPoint Slide
This image slide has been designed with business graph with globe in background. This image slide represents topics like global business, economic growth. This image will enhance the quality of your presentations.

Stock Photo Ball With Big Data Text For Data Protection Concept PowerPoint Slide
Graphic of ball with big data text has been used to craft this power point template. This image template contains the concept of data protection. Use this image for data security related topics in any presentation.
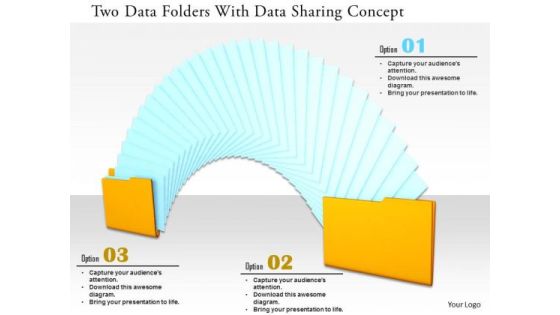
Stock Photo Two Data Folders With Data Sharing Concept PowerPoint Slide
This power point image template has been designed with graphic of two data folders. This PPT contains the concept of data sharing. This PPT can be used for data and technology related presentations.
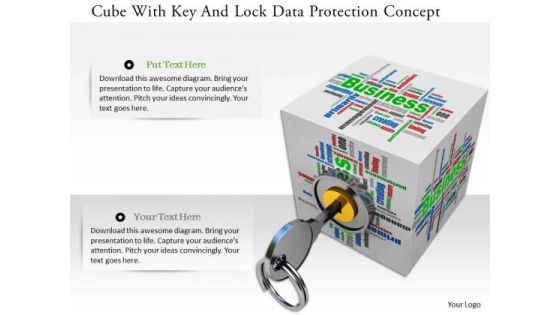
Stock Photo Cube With Key And Lock Data Protection Concept PowerPoint Slide
Graphic of cube with lock and key has been used to design this power point image template. This image template contains the concept of data protection. This image template can e used for data related presentations.

Stock Photo 3d Globe With Social Web For Data Protection Concept PowerPoint Slide
Graphic of 3d globe and web has been used to craft this power point image template. This PPT contains the concept of data protection and social network. Use this PPT and build quality presentation for your viewers.
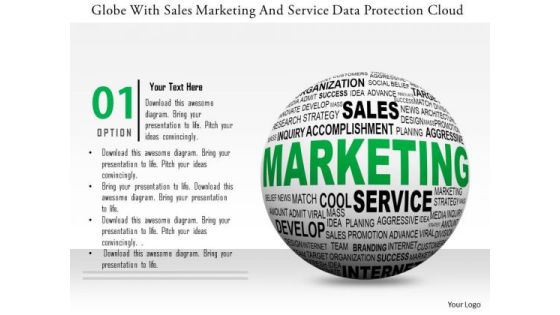
Stock Photo Globe With Sales Marketing And Service Data Protection Cloud PowerPoint Slide
This power point template has been designed with graphic of globe and cloud. This image template contains the concept of global sales and marketing service with cloud technology. Use this image template for global business related presentations.
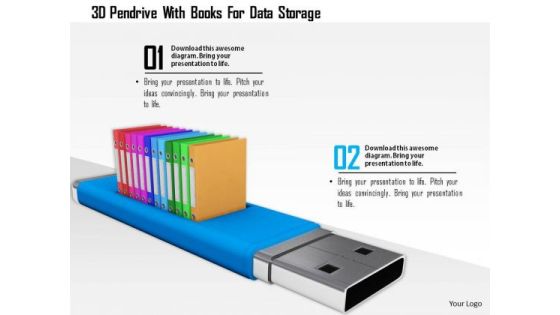
Stock Photo 3d Pendrive With Books For Data Storage PowerPoint Slide
This power point image template has been crafted with graphic of 3d pen drive and books. This PPT contains the concept of data storage. Use this image for your business data storage related topics in any presentations.

Stock Photo Blue Colored Pen Drive With Combination Lock PowerPoint Slide
Graphic of blue colored pen drive and combination lock has been used to design this power point template. This PPT contains the concept of data security and data technology. Use this PPT for your business and marketing related presentations.

Stock Market Research Report Ppt PowerPoint Presentation Complete Deck With Slides
Induce strategic thinking by presenting this complete deck. Enthrall your audience by deploying this thought-provoking PPT deck. It can be downloaded in both standard and widescreen aspect ratios, thus making it a complete package to use and deploy. Convey your thoughts and actions using the fifty seven slides presented in this complete deck. Additionally, feel free to alter its components like color, graphics, design, etc, to create a great first impression. Grab it now by clicking on the download button below.
Stock Photo Red Upload Arrow On Blue Cloud Icon PowerPoint Slide
This technical image slide has been designed with graphic of red upload arrow on cloud. This image slide explains the concept of data upload techniques with in the cloud service. Use this image slide for cloud computing related presentations.

Stock Photo Yellow Data Folder In Lifesaver PowerPoint Slide PowerPoint Slide
This exclusive image slide has been crafted with graphic of data folder in lifesaver. This image explains the concept of safety and security of data. Use this image for technology related presentations where you have to focus on data storage.

Stock Photo Small And Big Cubes For Text Representation PowerPoint Slide
This Power Point template has been crafted with graphic of cubes. This image slide contains the concept data representations. Use this editable image slide for your business and marketing related topics and to impress your viewers.

Stock Photo 3d Lifesaving Ring And Data Folder For Safety PowerPoint Slide
This PowerPoint template has been designed with graphic of 3d folder in life saving rings. This image slide contains the concept of data safety. Use this slide for your data storage and safety related topics.
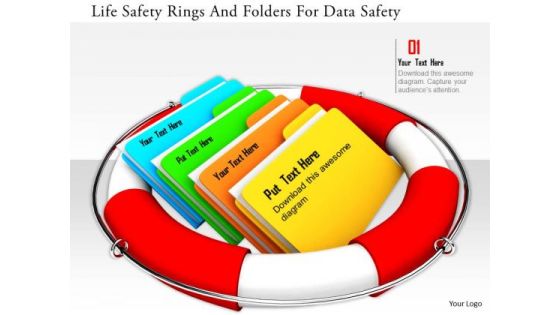
Stock Photo Life Safety Rings And Folders For Data Safety PowerPoint Slide
This PowerPoint template has been designed with graphic of 3d folder in life saving rings. This image slide contains the concept of data safety. Use this slide for your data storage and safety related topics.
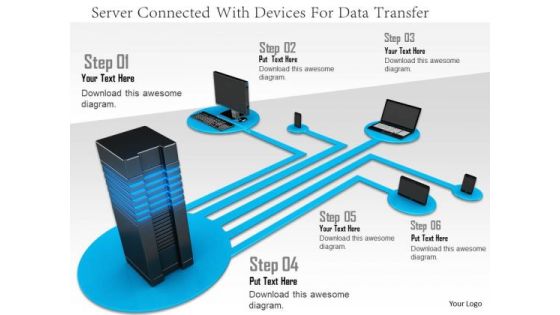
Stock Photo Server Connected With Devices For Data Transfer PowerPoint Slide
In this Power Point template server is connected with devices. This image template contains the concept of data sharing and transfer. Use this PPT in your data technology related presentations.

Stock Photo Earth Globe With Pen Drive For Data Transfer PowerPoint Slide
This power point image template has been designed with graphic of earth globe and pen drive. This image template contains the concept of data transfer. This image template can be used for data and global technology related presentations.

Stock Photo Three Servers For Data Transfer And Safety Image Graphics For PowerPoint Slide
Servers with laptops have been used to design this image. Concepts of networking and data transfer may be explained using this image. This image slide will help you express your views to target audience.
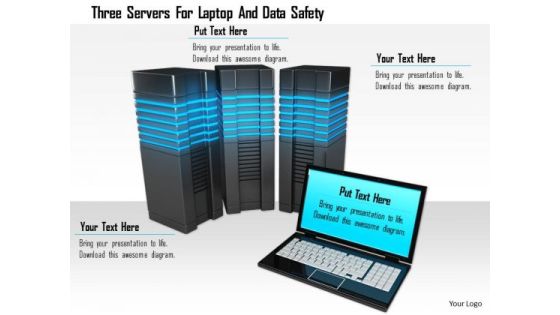
Stock Photo Three Servers For Laptop And Data Safety Image Graphics For PowerPoint Slide
Servers with laptop have been used to design this image. Concepts of networking and data transfer may be explained using this image. This image slide will help you express your views to target audience.

Stock Photo Three Clouds And Laptop For Data Technology PowerPoint Slide
This Power Point template has been designed with graphic of three clouds and laptop. Display the concept of cloud computing with this image slide. Use this professional image for your cloud technology and data transfer related topics.
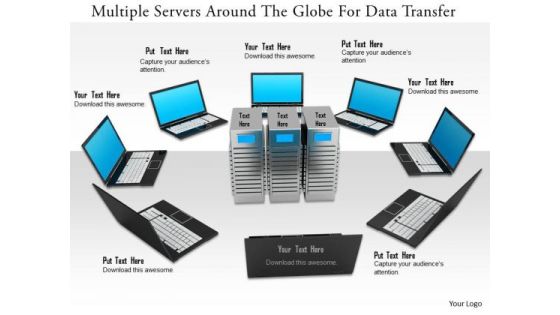
Stock Photo Multiple Servers Around The Globe For Data Transfer PowerPoint Slide
Multiple laptops around the servers has been used to design this power point template. This image slide contains the concept of networking and data transfer. Use this slide for your technology and communication related presentations.
Stock Photo 3d Mouse Cursor For Data Indication Image Graphics For PowerPoint
This Power Point image template has been crafted with graphic of 3d mouse cursor. This image template contains the concept of data indication on computer. Use this image template for your computer technology related presentations.

Stock Photo 3d Blue Folder With Lock For Data Security PowerPoint Slide
This power point image template has been crafted with graphic of 3d blue folder and lock. This image contains the concept of data security. Use this image PPT for your technology and security related presentations.

Stock Photo World Map On Bar Graph For Data Growth Image Graphics For PowerPoint Slide
This image is designed with blue graph with world map printed on it. This conceptual image portrays the concepts of global business and global economy. This image slide will help you express your views to target audience.

Stock Photo Globe And Server For Global Data Storage PowerPoint Slide
Graphic of globe and server has been used to design this PowerPoint template. This image slide contains the concept of technology and internet. Use this professional slide for technology related topics.
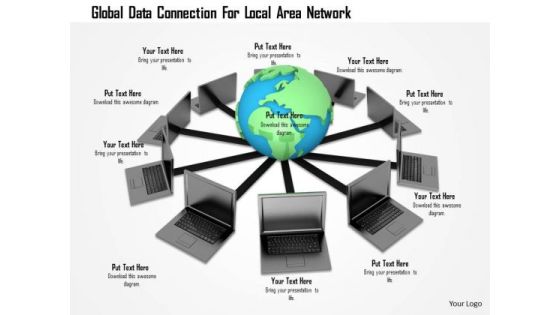
Stock Photo Global Data Connection For Local Area Network PowerPoint Slide
This Power point template has been designed with graphic of globe connected with laptops. This image slide contains the concept of global networking. Use this slide for your business network and communication related topics in any presentation.
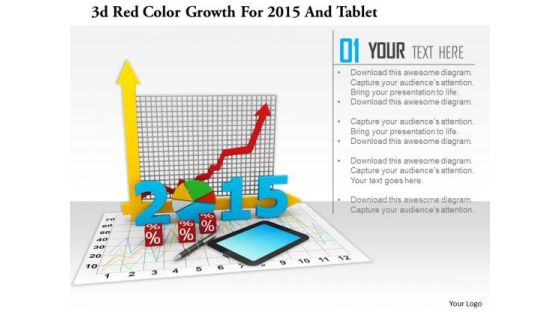
Stock Photo 3d Red Color Growth For 2015 And Tablet PowerPoint Slide
This image slide has graphics of financial charts and reports. This contains bar graph and pie chart to present business reports. Build an innovative presentation using this professional image slide.
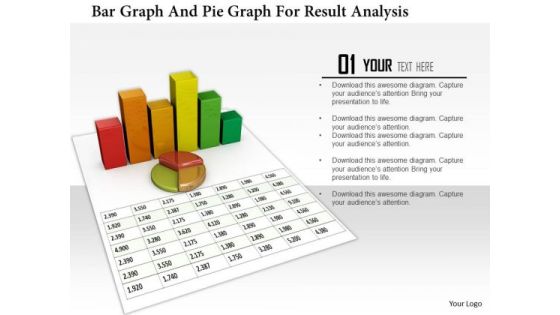
Stock Photo Bar Graph And Pie Graph For Result Analysis PowerPoint Slide
3D business graphs have been used to design this PowerPoint template. This Image slide is suitable to make business reports and charts. This slide can be used for business and marketing presentations.

Stock Photo 3d Us Map With Growth Arrow And Us Map PowerPoint Slide
This image displays American map with business graph in background. This image slide contains the concept of American economy, business growth and reports. Use this amazing slide to make professional presentations.

Stock Photo Bar Graph And Us Map With Financial Growth PowerPoint Slide
This image displays American map with business graph in background. This image slide contains the concept of American economy, business growth and reports. Use this amazing slide to make professional presentations.
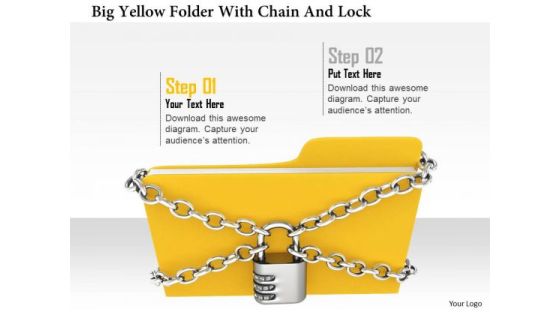
Stock Photo Big Yellow Folder With Chian And Lock PowerPoint Slide
A big yellow folder has been used to design this image slide. This yellow folder has been covered with chain and lock. This slide depicts the concept of data safety and security. Keep safe your data and display this massage in your presentation with this unique design
Stock Photo Three Black Computer Servers On White Background PowerPoint Slide
This image slide displays 3d black computer servers. This image has been designed with graphic of black computer servers with blue lights on white background. Use this image to express views on client server, data storage and backup. This image will enhance the quality of your presentations.

Dashboard Indicating Online Store Accounts Overview Introduction PDF
The following slide showcases ecommerce accounts management dashboard. It provides information about income, expenses, cash collected, cash spent, tax collected, tax claim, stock sold, invoice, etc. Presenting this PowerPoint presentation, titled Dashboard Indicating Online Store Accounts Overview Introduction PDF, with topics curated by our researchers after extensive research. This editable presentation is available for immediate download and provides attractive features when used. Download now and captivate your audience. Presenting this Dashboard Indicating Online Store Accounts Overview Introduction PDF. Our researchers have carefully researched and created these slides with all aspects taken into consideration. This is a completely customizable Dashboard Indicating Online Store Accounts Overview Introduction PDF that is available for immediate downloading. Download now and make an impact on your audience. Highlight the attractive features available with our PPTs.

ADC Cosmetics Company Dashboard With Variables Introduction PDF
This slide shows a cosmetics and skin care sales dashboard with KPIs such as Profit Margin in 2021, Cross Selling Rate, Market Size, Stock Turnover Rate, Social Media Usage, Revenue etc. Presenting adc cosmetics company dashboard with variables introduction pdf to provide visual cues and insights. Share and navigate important information on eight stages that need your due attention. This template can be used to pitch topics like profit margin, revenue, market size, social media, promotor score. In addition, this PPT design contains high-resolution images, graphics, etc, that are easily editable and available for immediate download.

ADC Cosmetics Company Dashboard With Variables Ppt Backgrounds PDF
This slide shows a cosmetics and skin care sales dashboard with KPIs such as Profit Margin in 2019, Cross Selling Rate , Market Size , Stock Turnover Rate , Social Media Usage, Revenue etc.Presenting adc cosmetics company dashboard with variables ppt backgrounds pdf. to provide visual cues and insights. Share and navigate important information on eight stages that need your due attention. This template can be used to pitch topics like stock turnover rate 2021, social media usage 2021, net promotor score 2021. In addtion, this PPT design contains high resolution images, graphics, etc, that are easily editable and available for immediate download.

ADC Cosmetics Company Dashboard With Variables Summary PDF
This slide shows a cosmetics and skin care sales dashboard with KPIs such as Profit Margin in 2021, Cross Selling Rate , Market Size , Stock Turnover Rate , Social Media Usage, Revenue etc. Presenting adc cosmetics company dashboard with variables summary pdf to provide visual cues and insights. Share and navigate important information on eight stages that need your due attention. This template can be used to pitch topics like profit margin, cross selling rate, market size, revenue, stock turnover rate. In addtion, this PPT design contains high resolution images, graphics, etc, that are easily editable and available for immediate download.

Logistics Dashboard For XYZ Logistic Company Cost Ppt Example PDF
The slide shows the logistic measurement dashboard for measuring inventory turnover ratio, inventory carrying cost, inventory accuracy, percentage of out of stock items etc.Deliver an awe-inspiring pitch with this creative logistics dashboard for XYZ logistic company cost ppt example pdf. bundle. Topics like inventory to sales, carrying cost of inventory, inventory accuracy, 2017 to 2021 can be discussed with this completely editable template. It is available for immediate download depending on the needs and requirements of the user.
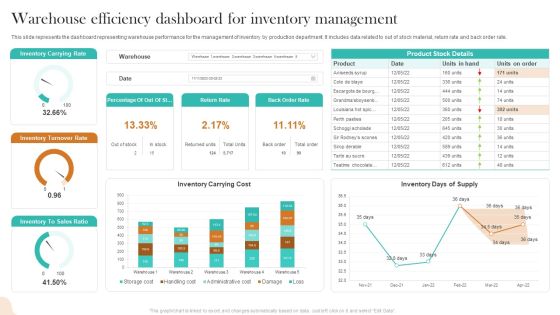
Warehouse Efficiency Dashboard For Inventory Management Infographics PDF
This slide represents the dashboard representing warehouse performance for the management of inventory by production department. It includes data related to out of stock material, return rate and back order rate. Showcasing this set of slides titled Warehouse Efficiency Dashboard For Inventory Management Infographics PDF. The topics addressed in these templates are Inventory Carrying Rate, Inventory Turnover Rate, Inventory Carrying Cost. All the content presented in this PPT design is completely editable. Download it and make adjustments in color, background, font etc. as per your unique business setting.
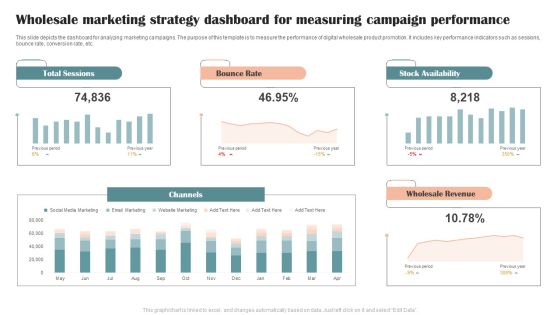
Wholesale Marketing Strategy Dashboard For Measuring Campaign Performance Graphics PDF
This slide depicts the dashboard for analyzing marketing campaigns. The purpose of this template is to measure the performance of digital wholesale product promotion. It includes key performance indicators such as sessions, bounce rate, conversion rate, etc. Showcasing this set of slides titled Wholesale Marketing Strategy Dashboard For Measuring Campaign Performance Graphics PDF. The topics addressed in these templates are Total Sessions, Bounce Rate, Stock Availability. All the content presented in this PPT design is completely editable. Download it and make adjustments in color, background, font etc. as per your unique business setting.

ADC Cosmetics Company Dashboard With Variables Formats PDF
This slide shows a cosmetics and skin care sales dashboard with KPIs such as Profit Margin in 2021, Cross Selling Rate , Market Size, Stock Turnover Rate , Social Media Usage, Revenue etc. Deliver an awe-inspiring pitch with this creative adc cosmetics company dashboard with variables formats pdf bundle. Topics like profit margin, cross selling rate, market size, revenue, social media can be discussed with this completely editable template. It is available for immediate download depending on the needs and requirements of the user.

Sales Measurement Dashboard For ABC Carbonated Drink Company Template PDF
The slide shows the sales measurement dashboard for measuring sales effectiveness, Inventory Turnover rate, Average Time to Sell in days, Freshness duration of Products sold etc. Deliver an awe-inspiring pitch with this creative sales measurement dashboard for abc carbonated drink company template pdf. bundle. Topics like out of stock rate, inventory turnover, inventory turnover, average time to sell, average time to sell can be discussed with this completely editable template. It is available for immediate download depending on the needs and requirements of the user.

Dashboard Depicting Sales And Customer Analytics Professional PDF
This slide focuses on dashboard that depicts sales and customer analytics which covers sales revenue, average transaction rate, out of stock items, sales by division, monthly visitors, etc. Make sure to capture your audiences attention in your business displays with our gratis customizable Dashboard Depicting Sales And Customer Analytics Professional PDF. These are great for business strategies, office conferences, capital raising or task suggestions. If you desire to acquire more customers for your tech business and ensure they stay satisfied, create your own sales presentation with these plain slides.

Supply Chain Management Service Delivery And Management Dashboard Guidelines PDF
This slide shows an overview of the supply chain management delivery service to track the operationality of the overall process. It includes metrics such as on time deliveries, the average time to sell, and the out of stock rate. Pitch your topic with ease and precision using this Supply Chain Management Service Delivery And Management Dashboard Guidelines PDF. This layout presents information on Supply Chain Management, Service Delivery, Management Dashboard. It is also available for immediate download and adjustment. So, changes can be made in the color, design, graphics or any other component to create a unique layout.
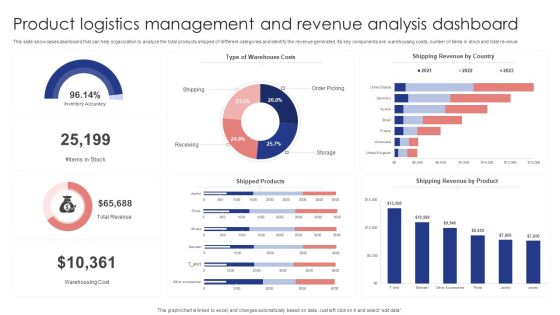
Product Logistics Management And Revenue Analysis Dashboard Demonstration PDF
This slide showcases dashboard that can help organization to analyze the total products shipped of different categories and identify the revenue generated. Its key components are warehousing costs, number of items in stock and total revenue. Pitch your topic with ease and precision using this Product Logistics Management And Revenue Analysis Dashboard Demonstration PDF. This layout presents information on Warehouse Costs, Shipping Revenue Country, Shipped Products . It is also available for immediate download and adjustment. So, changes can be made in the color, design, graphics or any other component to create a unique layout.

Dashboard Depicting Sales And Customer Analytics Infographics PDF
This slide focuses on dashboard that depicts sales and customer analytics which covers sales revenue, average transaction rate, out of stock items, sales by division, monthly visitors, etc. If you are looking for a format to display your unique thoughts, then the professionally designed Dashboard Depicting Sales And Customer Analytics Infographics PDF is the one for you. You can use it as a Google Slides template or a PowerPoint template. Incorporate impressive visuals, symbols, images, and other charts. Modify or reorganize the text boxes as you desire. Experiment with shade schemes and font pairings. Alter, share or cooperate with other people on your work. Download Dashboard Depicting Sales And Customer Analytics Infographics PDF and find out how to give a successful presentation. Present a perfect display to your team and make your presentation unforgettable.

Dashboard To Track Inventory Management Kpis Portrait PDF
This slide showcases KPIs that can help organization to evaluate the efficiency of inventory management process. Its key KPIs are out of stock rate, on time full deliveries, inventory turnover and average time to sell. Here you can discover an assortment of the finest PowerPoint and Google Slides templates. With these templates, you can create presentations for a variety of purposes while simultaneously providing your audience with an eye catching visual experience. Download Dashboard To Track Inventory Management Kpis Portrait PDF to deliver an impeccable presentation. These templates will make your job of preparing presentations much quicker, yet still, maintain a high level of quality. Slidegeeks has experienced researchers who prepare these templates and write high quality content for you. Later on, you can personalize the content by editing the Dashboard To Track Inventory Management Kpis Portrait PDF.

Dashboard To Track Inventory Management Kpis Professional PDF
This slide showcases KPIs that can help organization to evaluate the efficiency of inventory management process. Its key KPIs are out of stock rate, on time full deliveries, inventory turnover and average time to sell. This Dashboard To Track Inventory Management Kpis Professional PDF from Slidegeeks makes it easy to present information on your topic with precision. It provides customization options, so you can make changes to the colors, design, graphics, or any other component to create a unique layout. It is also available for immediate download, so you can begin using it right away. Slidegeeks has done good research to ensure that you have everything you need to make your presentation stand out. Make a name out there for a brilliant performance.
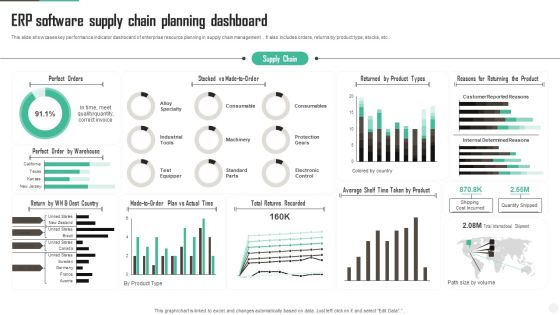
ERP Software Supply Chain Planning Dashboard Diagrams PDF
This slide showcases key performance indicator dashboard of enterprise resource planning in supply chain management . It also includes orders, returns by product type, stocks, etc. Showcasing this set of slides titled ERP Software Supply Chain Planning Dashboard Diagrams PDF Sample. The topics addressed in these templates are Perfect Orders, Dest Country, Actual Time. All the content presented in this PPT design is completely editable. Download it and make adjustments in color, background, font etc. as per your unique business setting.

Stock Market Upward Trends Graph With Dollar Sign And Arrow Up Ppt PowerPoint Presentation Professional Graphics Download
This is a stock market upward trends graph with dollar sign and arrow up ppt powerpoint presentation professional graphics download. This is a four stage process. The stages in this process are stock market, financial markets, bull market.
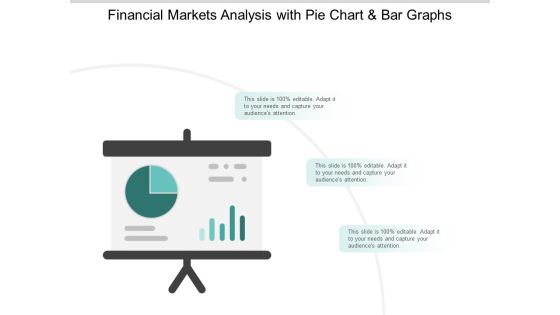
Stock Market Survey Reporting With Pie Chat And Bar Graph Ppt PowerPoint Presentation Infographic Template Example 2015
This is a stock market survey reporting with pie chat and bar graph ppt powerpoint presentation infographic template example 2015. This is a three stage process. The stages in this process are stock market, financial markets, bull market.

Continual Improvement Procedure In Supply Chain Dashboard To Track Inventory Management Status Designs PDF
This slide focuses on the dashboard to track inventory management status which covers annual stock conversion into sales, inventory turnover, inventory carrying cost and accuracy.Deliver an awe inspiring pitch with this creative Continual Improvement Procedure In Supply Chain Dashboard To Track Inventory Management Status Designs PDF bundle. Topics like Stock Conversion, Inventory Turnover, Inventory Accuracy can be discussed with this completely editable template. It is available for immediate download depending on the needs and requirements of the user.
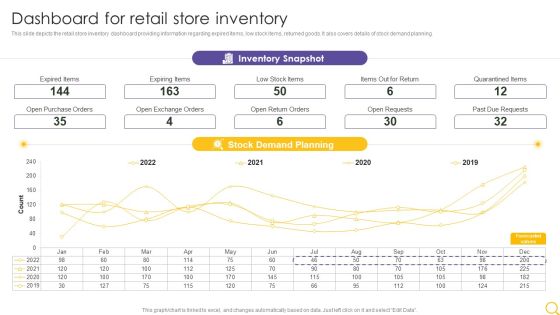
Retail Outlet Operational Efficiency Analytics Dashboard For Retail Store Inventory Summary PDF
This slide depicts the retail store inventory dashboard providing information regarding expired items, low stock items, returned goods. It also covers details of stock demand planning. Deliver and pitch your topic in the best possible manner with this Retail Outlet Operational Efficiency Analytics Dashboard For Retail Store Inventory Summary PDF. Use them to share invaluable insights on Inventory Snapshot, Stock Demand Planning, Expired Items and impress your audience. This template can be altered and modified as per your expectations. So, grab it now.

Ways Of Doing Stock Trading With Fundamental Data And Trading Ppt PowerPoint Presentation Infographic Template Templates PDF
Presenting this set of slides with name ways of doing stock trading with fundamental data and trading ppt powerpoint presentation infographic template templates pdf. This is a five stage process. The stages in this process are earnings announcements, fundamental data and trading, analysing upgrades and downgrades, acquisitions or takeovers, stock splits. This is a completely editable PowerPoint presentation and is available for immediate download. Download now and impress your audience.
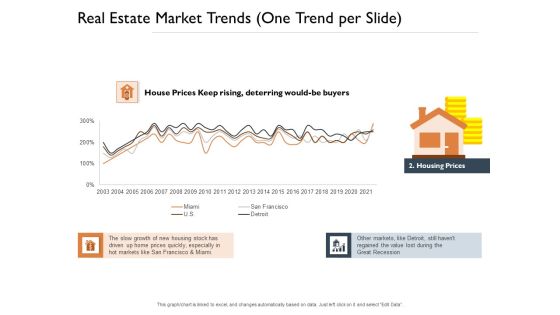
Freehold Property Business Plan Real Estate Market Trends One Trend Per Slide Stock Ppt PowerPoint Presentation Model Outline PDF
Presenting this set of slides with name freehold property business plan real estate market trends one trend per slide stock ppt powerpoint presentation model outline pdf. The topics discussed in these slides are growth, markets, prices. This is a completely editable PowerPoint presentation and is available for immediate download. Download now and impress your audience.
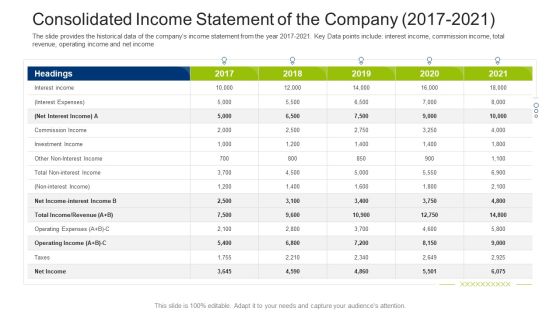
Investment Fundraising Pitch Deck From Stock Market Consolidated Income Statement Of The Company 2017 2021 Graphics PDF
The slide provides the historical data of the companys income statement from the year 2015-2021. Key Data points include interest income, commission income, total revenue, operating income and net income. Deliver an awe inspiring pitch with this creative investment fundraising pitch deck from stock market consolidated income statement of the company 2017 2021 graphics pdf bundle. Topics like interest income, operating income, investment income, commission income can be discussed with this completely editable template. It is available for immediate download depending on the needs and requirements of the user.

Adopting Multiple Tactics To Improve Inventory Optimization Red Flags To Identify Stock Theft In Warehouse Demonstration PDF
This slide showcases red flags that cn help organization in identification of warehouse theft. It can help organization to evaluate core reason for warehouse theft and preventing further loss. The Adopting Multiple Tactics To Improve Inventory Optimization Red Flags To Identify Stock Theft In Warehouse Demonstration PDF is a compilation of the most recent design trends as a series of slides. It is suitable for any subject or industry presentation, containing attractive visuals and photo spots for businesses to clearly express their messages. This template contains a variety of slides for the user to input data, such as structures to contrast two elements, bullet points, and slides for written information. Slidegeeks is prepared to create an impression.
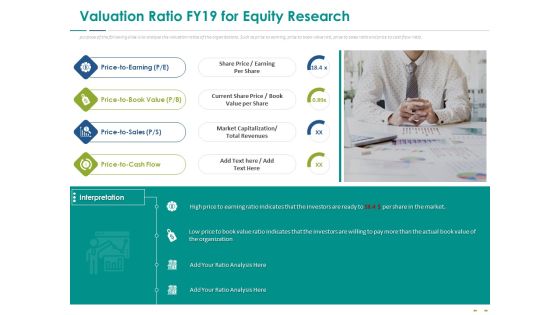
Stock Market Research Report Valuation Ratio FY19 For Equity Research Ppt PowerPoint Presentation Model Background Images PDF
The purpose of the following slide is to analyze the valuation ratios of the organizations. Such as price to earning, price to book value rati, price to sales ratio and price to cash flow ratio. Presenting stock market research report valuation ratio fy19 for equity research ppt powerpoint presentation model background images pdf to provide visual cues and insights. Share and navigate important information on four stages that need your due attention. This template can be used to pitch topics like rice to earning, price to book value, price to sale, price to cash flow. In addition, this PPT design contains high-resolution images, graphics, etc, that are easily editable and available for immediate download.

Dashboard For Retail Store Inventory Retail Outlet Performance Assessment Clipart PDF
This slide depicts the retail store inventory dashboard providing information regarding expired items, low stock items, returned goods. It also covers details of stock demand planning.Deliver an awe inspiring pitch with this creative Dashboard For Retail Store Inventory Retail Outlet Performance Assessment Clipart PDF bundle. Topics like Expired Items, Inventory Snapshot, Demand Planning can be discussed with this completely editable template. It is available for immediate download depending on the needs and requirements of the user.

Dashboard For Retail Store Inventory Retail Outlet Operations Performance Evaluation Pictures PDF
This slide depicts the retail store inventory dashboard providing information regarding expired items, low stock items, returned goods. It also covers details of stock demand planning.Deliver and pitch your topic in the best possible manner with this Dashboard For Retail Store Inventory Retail Outlet Operations Performance Evaluation Pictures PDF. Use them to share invaluable insights on Expired Items, Quarantined Items, Due Requests and impress your audience. This template can be altered and modified as per your expectations. So, grab it now.
Optimizing Logistics Management Process Dashboard To Track Inventory Management Status Icons PDF
This slide focuses on the dashboard to track inventory management status which covers annual stock conversion into sales, inventory turnover, inventory carrying cost and accuracy. Deliver an awe inspiring pitch with this creative optimizing logistics management process dashboard to track inventory management status icons pdf bundle. Topics like inventory carrying cost, inventory turnover, inventory accuracy, stock conversion into sales can be discussed with this completely editable template. It is available for immediate download depending on the needs and requirements of the user.
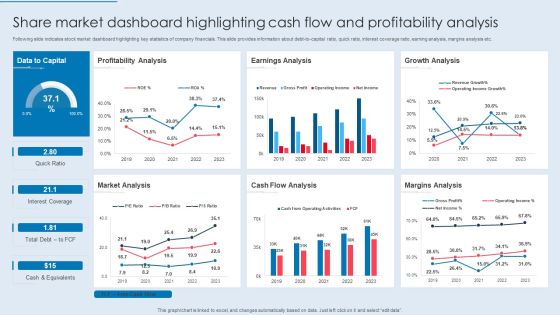
Share Market Dashboard Highlighting Cash Flow And Profitability Analysis Information PDF
Following slide indicates stock market dashboard highlighting key statistics of company financials. This slide provides information about debt-to-capital ratio, quick ratio, interest coverage ratio, earning analysis, margins analysis etc. Showcasing this set of slides titled Share Market Dashboard Highlighting Cash Flow And Profitability Analysis Information PDF. The topics addressed in these templates are Profitability Analysis, Earnings Analysis, Growth Analysis. All the content presented in this PPT design is completely editable. Download it and make adjustments in color, background, font etc. as per your unique business setting.

Administering Logistics Activities In SCM Dashboard To Track Inventory Management Status Background PDF
This slide focuses on the dashboard to track inventory management status which covers annual stock conversion into sales, inventory turnover, inventory carrying cost and accuracy. Deliver an awe inspiring pitch with this creative Administering Logistics Activities In SCM Dashboard To Track Inventory Management Status Background PDF bundle. Topics like Inventory Carrying, Inventory Accuracy, Inventory Turnover can be discussed with this completely editable template. It is available for immediate download depending on the needs and requirements of the user.

Developing Excellence In Logistics Operations Dashboard To Track Inventory Management Status Information PDF
This slide focuses on the dashboard to track inventory management status which covers annual stock conversion into sales, inventory turnover, inventory carrying cost and accuracy.Deliver and pitch your topic in the best possible manner with this Developing Excellence In Logistics Operations Dashboard To Track Inventory Management Status Information PDF Use them to share invaluable insights on Inventory Accuracy, Inventory Carrying, Inventory Turnover and impress your audience. This template can be altered and modified as per your expectations. So, grab it now.

Enhancing Logistics Customer Service Dashboard To Track Inventory Management Status Microsoft PDF
This slide focuses on the dashboard to track inventory management status which covers annual stock conversion into sales, inventory turnover, inventory carrying cost and accuracy. Deliver and pitch your topic in the best possible manner with this Enhancing Logistics Customer Service Dashboard To Track Inventory Management Status Microsoft PDF. Use them to share invaluable insights on Inventory Carrying Cost, Inventory Turnover Last, 5 Years Stock, Conversion Into Sales, and impress your audience. This template can be altered and modified as per your expectations. So, grab it now.

Retail Store Data Map Dashboard Ppt PowerPoint Presentation Gallery Display PDF
This slide shows retail store data inventory dashboard. It provides information such as units sold, on hand, stock availability, top selling items, average inventory value by product category, etc. Pitch your topic with ease and precision using this Retail Store Data Map Dashboard Ppt PowerPoint Presentation Gallery Display PDF. This layout presents information on Inventory Turn, Over Ratio, Gross Margin ROI. It is also available for immediate download and adjustment. So, changes can be made in the color, design, graphics or any other component to create a unique layout.
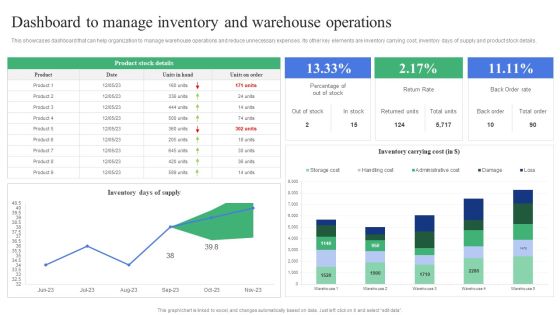
Strategic Guidelines To Administer Dashboard To Manage Inventory And Warehouse Introduction PDF
This showcases dashboard that can help organization to manage warehouse operations and reduce unnecessary expenses. Its other key elements are inventory carrying cost, inventory days of supply and product stock details. This Strategic Guidelines To Administer Dashboard To Manage Inventory And Warehouse Introduction PDF from Slidegeeks makes it easy to present information on your topic with precision. It provides customization options, so you can make changes to the colors, design, graphics, or any other component to create a unique layout. It is also available for immediate download, so you can begin using it right away. Slidegeeks has done good research to ensure that you have everything you need to make your presentation stand out. Make a name out there for a brilliant performance.
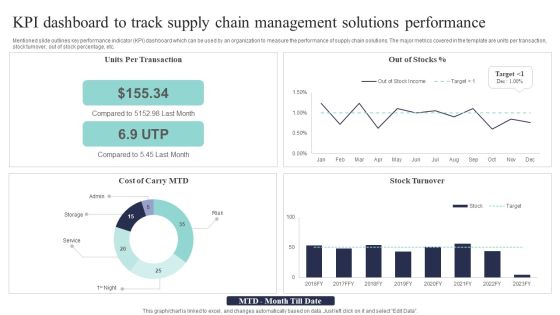
KPI Dashboard To Track Supply Chain Management Solutions Performance Background PDF
Mentioned slide outlines key performance indicator KPI dashboard which can be used by an organization to measure the performance of supply chain solutions. The major metrics covered in the template are units per transaction, stock turnover, out of stock percentage, etc. Pitch your topic with ease and precision using this KPI Dashboard To Track Supply Chain Management Solutions Performance Background PDF. This layout presents information on Per Transaction, Compared Last, Stock Turnover. It is also available for immediate download and adjustment. So, changes can be made in the color, design, graphics or any other component to create a unique layout.

Logistics Dashboard For XYZ Logistic Company Sales Ppt Inspiration Designs Download PDF
The slide shows the logistic measurement dashboard for measuring inventory turnover ratio, inventory carrying cost, inventory accuracy, percentage of out of stock items etc. Deliver an awe inspiring pitch with this creative logistics dashboard for xyz logistic company sales ppt inspiration designs download pdf bundle. Topics like carrying cost of inventory, inventory accuracy, out of stocks item, inventory to sales, inventory turnover can be discussed with this completely editable template. It is available for immediate download depending on the needs and requirements of the user.
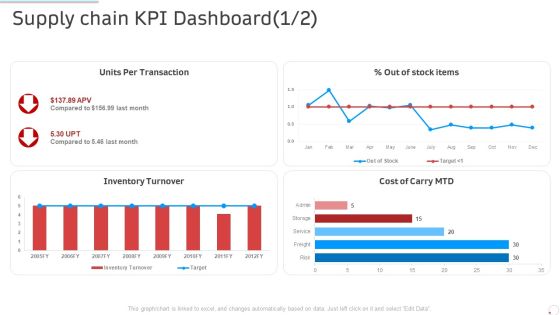
Supply Chain Kpi Dashboard Manufacturing Control Ppt Infographics Design Inspiration PDF
Deliver and pitch your topic in the best possible manner with this supply chain kpi dashboard manufacturing control ppt infographics design inspiration pdf. Use them to share invaluable insights on inventory turnover, cost, units per transaction, stock items and impress your audience. This template can be altered and modified as per your expectations. So, grab it now.

Dashboard Showing Supply Chain KPI Ppt PowerPoint Presentation Gallery Slide Portrait PDF
Showcasing this set of slides titled dashboard showing supply chain kpi ppt powerpoint presentation gallery slide portrait pdf. The topics addressed in these templates are inventory turnover, units per transaction, percent out of stock items. All the content presented in this PPT design is completely editable. Download it and make adjustments in color, background, font etc. as per your unique business setting.
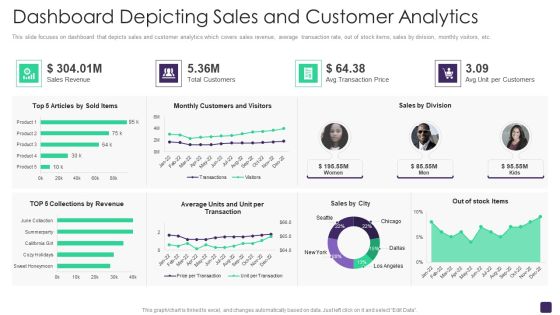
Retail Merchandising Program Dashboard Depicting Sales And Customer Analytics Topics PDF
This slide focuses on dashboard that depicts sales and customer analytics which covers sales revenue, average transaction rate, out of stock items, sales by division, monthly visitors, etc. Deliver an awe inspiring pitch with this creative Retail Merchandising Program Dashboard Depicting Sales And Customer Analytics Topics PDF bundle. Topics like Sales Revenue, Total Customers, Avg Transaction Price, Sales Division can be discussed with this completely editable template. It is available for immediate download depending on the needs and requirements of the user.
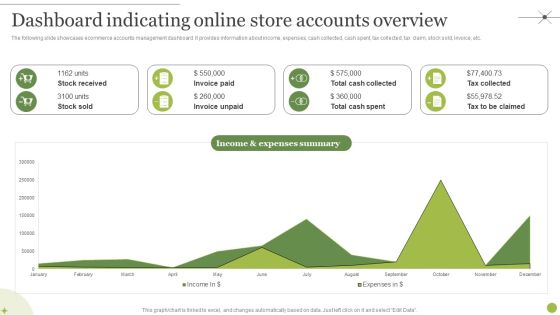
Managing E Commerce Business Accounting Dashboard Indicating Online Store Accounts Overview Inspiration PDF
The following slide showcases ecommerce accounts management dashboard. It provides information about income, expenses, cash collected, cash spent, tax collected, tax claim, stock sold, invoice, etc. There are so many reasons you need a Managing E Commerce Business Accounting Dashboard Indicating Online Store Accounts Overview Inspiration PDF. The first reason is you can not spend time making everything from scratch, Thus, Slidegeeks has made presentation templates for you too. You can easily download these templates from our website easily.
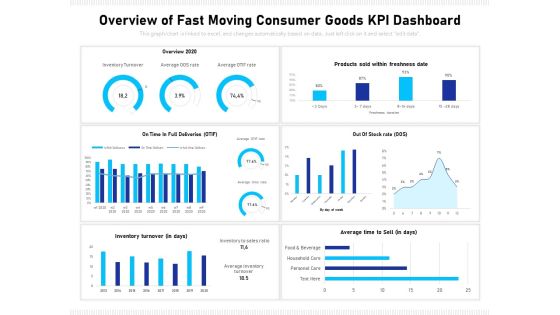
Overview Of Fast Moving Consumer Goods Kpi Dashboard Ppt PowerPoint Presentation Show Visual Aids PDF
Showcasing this set of slides titled overview of fast moving consumer goods kpi dashboard ppt powerpoint presentation show visual aids pdf. The topics addressed in these templates are overview 2020, on time in full deliveries otif, out of stock rate oos, inventory turnover in days, average time to sell in days. All the content presented in this PPT design is completely editable. Download it and make adjustments in color, background, font etc. as per your unique business setting.
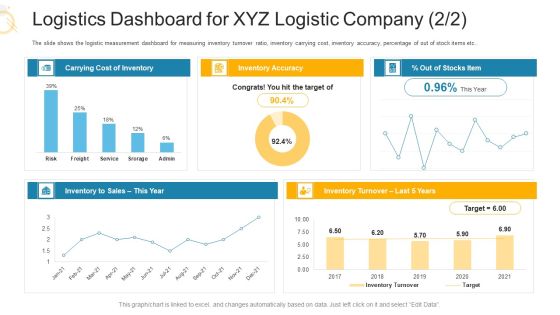
Logistics Dashboard For XYZ Logistic Company Accuracy Ppt File Formats PDF
The slide shows the logistic measurement dashboard for measuring inventory turnover ratio, inventory carrying cost, inventory accuracy, percentage of out of stock items etc. Deliver and pitch your topic in the best possible manner with this logistics dashboard for XYZ logistic company accuracy ppt file formats pdf. Use them to share invaluable insights on carrying cost of inventory, inventory accuracy, logistics dashboard for XYZ logistic company and impress your audience. This template can be altered and modified as per your expectations. So, grab it now.

Supply Chain Strategic Planning KPI Dashboard Depicting Inventory And Costs Template PDF
This slide delineates supply planning key performance indicator kpi dashboard depicting inventory and costs which can assist logistics manager in determining demand and supply of products. It includes information about transaction based on units, out of stock products, inventory turnover and month to date expenditures. Showcasing this set of slides titled Supply Chain Strategic Planning KPI Dashboard Depicting Inventory And Costs Template PDF. The topics addressed in these templates are Transaction Based Units, 2016 To 2022. All the content presented in this PPT design is completely editable. Download it and make adjustments in color, background, font etc. as per your unique business setting.
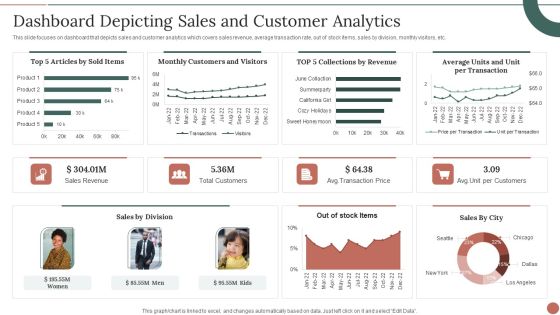
Retail Business Product Planning Procedure Dashboard Depicting Sales And Customer Analytics Themes PDF
This slide focuses on dashboard that depicts sales and customer analytics which covers sales revenue, average transaction rate, out of stock items, sales by division, monthly visitors, etc. Deliver and pitch your topic in the best possible manner with this Retail Business Product Planning Procedure Dashboard Depicting Sales And Customer Analytics Themes PDF. Use them to share invaluable insights on Sales Revenue, Total Customers, Sales By Division and impress your audience. This template can be altered and modified as per your expectations. So, grab it now.

Deploy Merchandise Program To Enhance Sales Dashboard Depicting Sales And Customer Analytics Sample PDF
This slide focuses on dashboard that depicts sales and customer analytics which covers sales revenue, average transaction rate, out of stock items, sales by division, monthly visitors, etc. Make sure to capture your audiences attention in your business displays with our gratis customizable Deploy Merchandise Program To Enhance Sales Dashboard Depicting Sales And Customer Analytics Sample PDF. These are great for business strategies, office conferences, capital raising or task suggestions. If you desire to acquire more customers for your tech business and ensure they stay satisfied, create your own sales presentation with these plain slides.

Dashboard Indicating Online Store Accounts Overview Financial Management Strategies Clipart PDF
The following slide showcases ecommerce accounts management dashboard. It provides information about income, expenses, cash collected, cash spent, tax collected, tax claim, stock sold, invoice, etc.From laying roadmaps to briefing everything in detail, our templates are perfect for you. You can set the stage with your presentation slides. All you have to do is download these easy-to-edit and customizable templates. Dashboard Indicating Online Store Accounts Overview Financial Management Strategies Clipart PDF will help you deliver an outstanding performance that everyone would remember and praise you for. Do download this presentation today.

Adopting Multiple Tactics To Improve Inventory Optimization Dashboard To Manage Inventory And Warehouse Operations Guidelines PDF
This showcases dashboard that can help organization to manage warehouse operations and reduce unnecessary expenses. Its other key elements are inventory carrying cost, inventory days of supply and product stock details. Crafting an eye catching presentation has never been more straightforward. Let your presentation shine with this tasteful yet straightforward Adopting Multiple Tactics To Improve Inventory Optimization Dashboard To Manage Inventory And Warehouse Operations Guidelines PDF template. It offers a minimalistic and classy look that is great for making a statement. The colors have been employed intelligently to add a bit of playfulness while still remaining professional. Construct the ideal Adopting Multiple Tactics To Improve Inventory Optimization Dashboard To Manage Inventory And Warehouse Operations Guidelines PDF that effortlessly grabs the attention of your audience. Begin now and be certain to wow your customers.
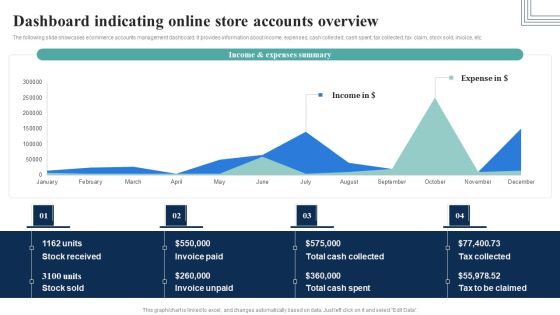
How Electronic Commerce Financial Procedure Can Be Enhanced Dashboard Indicating Online Store Pictures PDF
The following slide showcases ecommerce accounts management dashboard. It provides information about income, expenses, cash collected, cash spent, tax collected, tax claim, stock sold, invoice, etc.Do you know about Slidesgeeks How Electronic Commerce Financial Procedure Can Be Enhanced Dashboard Indicating Online Store Pictures PDF These are perfect for delivering any kind od presentation. Using it, create PowerPoint presentations that communicate your ideas and engage audiences. Save time and effort by using our pre-designed presentation templates that are perfect for a wide range of topic. Our vast selection of designs covers a range of styles, from creative to business, and are all highly customizable and easy to edit. Download as a PowerPoint template or use them as Google Slides themes.
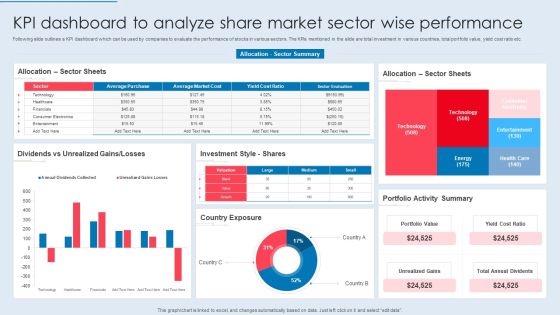
KPI Dashboard To Analyze Share Market Sector Wise Performance Summary PDF
Following slide outlines a KPI dashboard which can be used by companies to evaluate the performance of stocks in various sectors. The KPIs mentioned in the slide are total investment in various countries, total portfolio value, yield cost ratio etc. Pitch your topic with ease and precision using this KPI Dashboard To Analyze Share Market Sector Wise Performance Summary PDF. This layout presents information on Sector Sheets, Dividends Vs Unrealized, Investment Style. It is also available for immediate download and adjustment. So, changes can be made in the color, design, graphics or any other component to create a unique layout.

Dashboard To Track Inventory Status In Sales To Cash Process Themes PDF
This slide depicts a dashboard for business managers to keep the track of inventory in order to cash process for easy understanding and decision making. The major key performing indicators are inventory status, surplus stock, dead inventory, sales by product grades etc. Showcasing this set of slides titled Dashboard To Track Inventory Status In Sales To Cash Process Themes PDF. The topics addressed in these templates are Inventory Status, Surplus Stock, Dead Inventory. All the content presented in this PPT design is completely editable. Download it and make adjustments in color, background, font etc. as per your unique business setting.
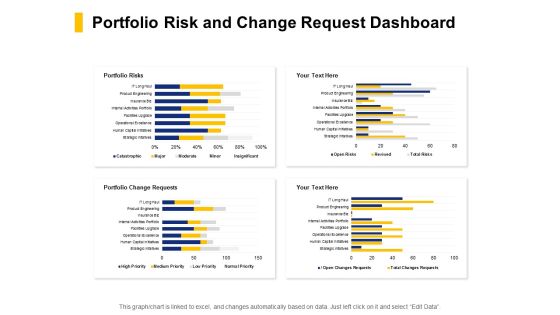
Portfolio Risk And Change Request Dashboard Ppt PowerPoint Presentation Professional Slide Portrait
Presenting this set of slides with name portfolio risk and change request dashboard ppt powerpoint presentation professional slide portrait. This is a one stage process. The stages in this process are portfolio, stocks, cash. This is a completely editable PowerPoint presentation and is available for immediate download. Download now and impress your audience.

Retail Store Dashboard With Inventory SKU Ppt PowerPoint Presentation Gallery Graphics Template PDF
This slide showcases SKU dashboard for tracking retail store product inventory. It provides information about price, tax rate, units sold, stock, available, reorder, incoming, in transit, warehouse, etc. Showcasing this set of slides titled Retail Store Dashboard With Inventory SKU Ppt PowerPoint Presentation Gallery Graphics Template PDF. The topics addressed in these templates are South Hall Warehouse, New Jersey Warehouse, Munich Warehouse. All the content presented in this PPT design is completely editable. Download it and make adjustments in color, background, font etc. as per your unique business setting.

Case Competition Inflated Fuel Price In Logistics Firm Logistics Dashboard For XYZ Logistic Company Sales Microsoft PDF
The slide shows the logistic measurement dashboard for measuring inventory turnover ratio, inventory carrying cost, inventory accuracy, percentage of out of stock items etc. Deliver an awe inspiring pitch with this creative case competition inflated fuel price in logistics firm logistics dashboard for xyz logistic company sales microsoft pdf bundle. Topics like logistics dashboard for xyz logistic company can be discussed with this completely editable template. It is available for immediate download depending on the needs and requirements of the user.

Utilization Of Current Techniques To Improve Efficiency Case Competition ADC Cosmetics Company Dashboard With Variables Diagrams PDF
This slide shows a cosmetics and skin care sales dashboard with KPIs such as Profit Margin in 2021, Cross Selling Rate , Market Size , Stock Turnover Rate , Social Media Usage, Revenue etc.Deliver and pitch your topic in the best possible manner with this utilization of current techniques to improve efficiency case competition adc cosmetics company dashboard with variables diagrams pdf. Use them to share invaluable insights on profit margin 2021, cross selling rate 2021, social media usage 2021 and impress your audience. This template can be altered and modified as per your expectations. So, grab it now.

Raising Stocks Business PowerPoint Templates And PowerPoint Backgrounds 0811
Microsoft PowerPoint Template and Background with stock market positive trend
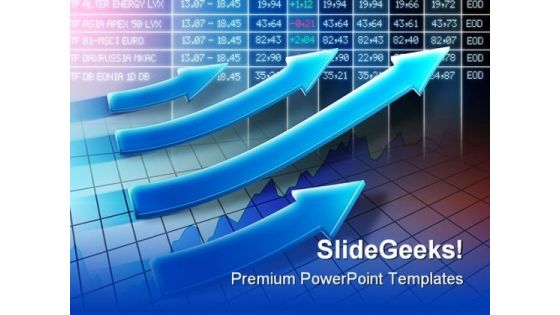
Raising Stocks Business PowerPoint Themes And PowerPoint Slides 0811
Microsoft PowerPoint Theme and Slide with stock market positive trend

Investment Risk Assessment Of Stocks With Trend Structure PDF
This slide shows the key strategies for risk management in stock market. These strategies are portfolio diversification, bottom line, lower portfolio volatility, etc Showcasing this set of slides titled Investment Risk Assessment Of Stocks With Trend Structure PDF. The topics addressed in these templates are Stock Listing, Trend, Investment. All the content presented in this PPT design is completely editable. Download it and make adjustments in color, background, font etc. as per your unique business setting.

Six Stages Of Stocks Fundamental Trend Analysis Process Sample PDF
This slide represents the six steps to be followed by the investor for performing fundamental analysis of stocks. It includes six steps of understanding the company, studying of financial reports, checking the debt, finding companys competitors, analysis of future prospects and reviewing of aspects.Persuade your audience using this Six Stages Of Stocks Fundamental Trend Analysis Process Sample PDF. This PPT design covers six stages, thus making it a great tool to use. It also caters to a variety of topics including Financial Reports, Companys Competitors, Prospects Analysis. Download this PPT design now to present a convincing pitch that not only emphasizes the topic but also showcases your presentation skills.

Investment Summary Report Of ABC Stocks Introduction PDF
The following slide shows portfolio activity over a certain period of time to analyze the market value of firms investment. It also includes period returns, contributions, revenue and expenses. Pitch your topic with ease and precision using this Investment Summary Report Of ABC Stocks Introduction PDF. This layout presents information on Summary Report, Value Summary, Revenues, Expenses. It is also available for immediate download and adjustment. So, changes can be made in the color, design, graphics or any other component to create a unique layout.

Assessing Stocks In Financial Market Relative Valuation Approach For Equity Research Ppt PowerPoint Presentation Ideas Graphics Tutorials PDF
Presenting this set of slides with name assessing stocks in financial market relative valuation approach for equity research ppt powerpoint presentation ideas graphics tutorials pdf. This is a three stage process. The stages in this process are market data, financial data, valuation. This is a completely editable PowerPoint presentation and is available for immediate download. Download now and impress your audience.

Assessing Stocks In Financial Market Key Industry Trends For Equity Research Ppt PowerPoint Presentation Show Templates PDF
Presenting this set of slides with name assessing stocks in financial market key industry trends for equity research ppt powerpoint presentation show templates pdf. This is a five stage process. The stages in this process are byod technology, increase in crypto currency, cloud, computing, increase ai. This is a completely editable PowerPoint presentation and is available for immediate download. Download now and impress your audience.

Investor Report Finance PowerPoint Templates And PowerPoint Backgrounds 0711
Microsoft PowerPoint Template and Background with stock market charts for investor analysis

We Shall Overcome Business PowerPoint Templates And PowerPoint Backgrounds 0711
Microsoft PowerPoint Template and Background with the hand showing successful growth of stock market trends

Building Financial Future PowerPoint Background And Template 1210
Microsoft PowerPoint Template and Background with Coins stacked as a rising graph on stock report
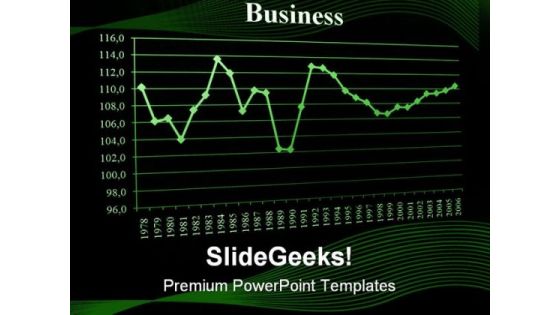
Graph03 Business PowerPoint Templates And PowerPoint Backgrounds 0411
Microsoft PowerPoint Template and Background with business chart and data from stock market showing success

Data Analytics Vector Icon Ppt PowerPoint Presentation Gallery Smartart
Presenting this set of slides with name data analytics vector icon ppt powerpoint presentation gallery smartart. This is a one stage process. The stages in this process are warehouse icon, stock icon, stock market icon. This is a completely editable PowerPoint presentation and is available for immediate download. Download now and impress your audience.

Use Case Pattern For Big Data Ppt Powerpoint Themes
This is a use case pattern for big data ppt powerpoint themes. This is a eight stage process. The stages in this process are product pricing, stock levels, sales, stocking costs, competitor prices, customer sentiment, advertisement pricing, product costs and price, big data processing.
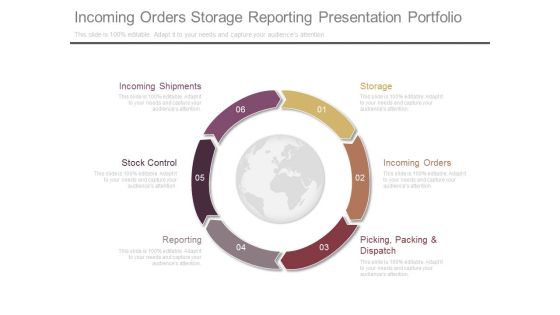
Incoming Orders Storage Reporting Presentation Portfolio
This is a incoming orders storage reporting presentation portfolio. This is a six stage process. The stages in this process are storage, incoming orders, picking packing and dispatch, reporting, stock control, incoming shipments.
Economic Trends Analysis Dollar Sign With Four Arrows Ppt PowerPoint Presentation Layouts Icons
This is a economic trends analysis dollar sign with four arrows ppt powerpoint presentation layouts icons. This is a four stage process. The stages in this process are stock market, financial markets, bull market.

PowerPoint Theme Ring Chart Diagram Growth Ppt Template
PowerPoint Theme Ring Chart Diagram Growth PPT Template-Use this graphical approach to represent global business issues such as financial data, stock market Exchange, increase in sales, corporate presentations and more.-PowerPoint Theme Ring Chart Diagram Growth PPT Template
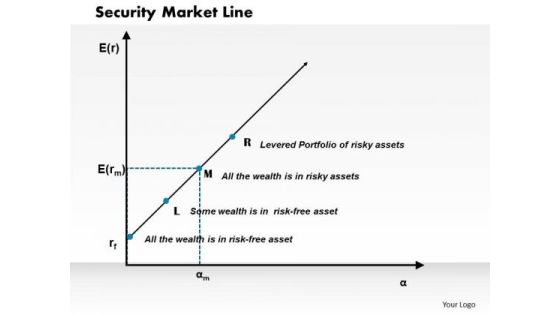
Business Framework Security Market Line PowerPoint Presentation
This diagram displays graph of security market line. You can use line graph to plot changes in data over time, such as monthly revenue and earnings changes or daily changes in stock market prices.
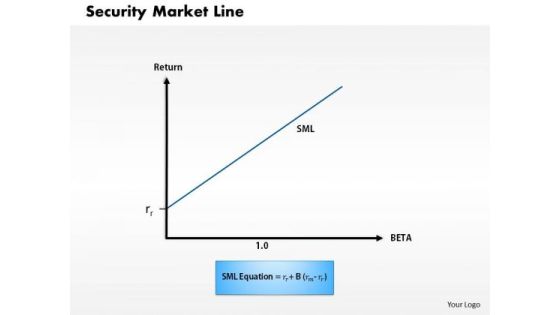
Business Framework Security Market Line 1 PowerPoint Presentation
This diagram displays graph of security market line. You can use line graph to plot changes in data over time, such as monthly revenue and earnings changes or daily changes in stock market prices.

Business Framework Security Market Line 11 PowerPoint Presentation
This diagram displays graph of security market line. You can use line graph to plot changes in data over time, such as monthly revenue and earnings changes or daily changes in stock market prices.

Business Framework Put Option Long PowerPoint Presentation
Our above diagram helps to represent data graphically. Use this put option long diagram for stock market related topics. This diagram has area for your own text to assist you get your point across.

Checklist For Investment Risk Management Summary PDF
This slide shows the stock market risk management checklist. It includes various points such as use of risk management software, continuous monitoring of stock trends, exit strategy formulation, etc Presenting Checklist For Investment Risk Management Summary PDF to dispense important information. This template comprises two stages. It also presents valuable insights into the topics including Management, Checklist, Investment. This is a completely customizable PowerPoint theme that can be put to use immediately. So, download it and address the topic impactfully.

Key Performance Indicators Of ADC Cosmetics Company With Future Targets Infographics PDF
The slide shows the key Performance Indicator KPIs which will help the company to track the success rate of implemented strategies. Some of the KPIs are Company Revenue , Profit Margin, Market Share, Stock Turnover Rate , Cross Selling Rate, Net Promotor Score etc. Deliver and pitch your topic in the best possible manner with this key performance indicators of adc cosmetics company with future targets infographics pdf. Use them to share invaluable insights on company revenue, profit margin, market share, stock turnover rate, customer churn rate and impress your audience. This template can be altered and modified as per your expectations. So, grab it now.

Competition Key Performance Indicators Of ADC Cosmetics Company With Future Targets Inspiration PDF
The slide shows the key Performance Indicator KPIs which will help the company to track the success rate of implemented strategies. Some of the KPIs are Company Revenue , Profit Margin, Market Share, Stock Turnover Rate , Cross Selling Rate, Net Promotor Score etc.Deliver an awe-inspiring pitch with this creative competition key performance indicators of adc cosmetics company with future targets inspiration pdf bundle. Topics like key performance indicators, stock turnover rate, customer churn rate can be discussed with this completely editable template. It is available for immediate download depending on the needs and requirements of the user.
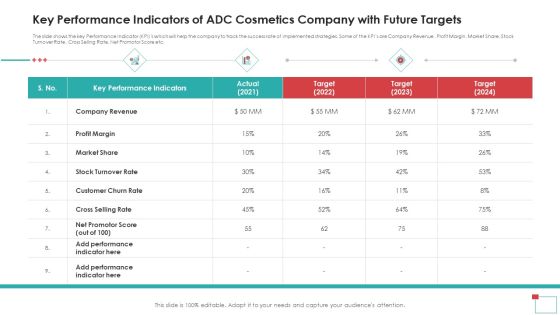
Key Performance Indicators Of ADC Cosmetics Company With Future Targets Elements PDF
The slide shows the key Performance Indicator KPIs which will help the company to track the success rate of implemented strategies. Some of the KPIs are Company Revenue , Profit Margin, Market Share, Stock Turnover Rate, Cross Selling Rate, Net Promotor Score etc. Deliver an awe-inspiring pitch with this creative key performance indicators of adc cosmetics company with future targets elements pdf bundle. Topics like company revenue, profit margin, market share, stock turnover rate, cross selling rate can be discussed with this completely editable template. It is available for immediate download depending on the needs and requirements of the user.
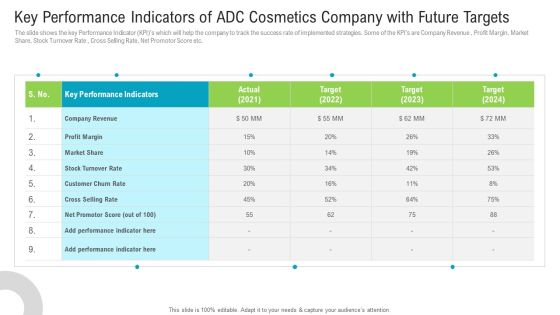
Key Performance Indicators Of ADC Cosmetics Company With Future Targets Mockup PDF
The slide shows the key Performance Indicator KPIs which will help the company to track the success rate of implemented strategies. Some of the KPIs are Company Revenue , Profit Margin, Market Share, Stock Turnover Rate, Cross Selling Rate, Net Promotor Score etc. Deliver an awe inspiring pitch with this creative key performance indicators of adc cosmetics company with future targets mockup pdf bundle. Topics like company revenue, profit margin, stock turnover rate, customer churn rate can be discussed with this completely editable template. It is available for immediate download depending on the needs and requirements of the user.

Signs Indicating Tail End Cost In Business Demonstration PDF
This slide presents signs that indicate presence of tail spends in business helpful in identifying barriers to cost efficiency and providing solutions for same. It includes mismatch of ERP, sourcing data hidden in email, too much stock holding that should be treated on priority basis. Persuade your audience using this Signs Indicating Tail End Cost In Business Demonstration PDF. This PPT design covers three stages, thus making it a great tool to use. It also caters to a variety of topics including Stocks, Resource, Supplier. Download this PPT design now to present a convincing pitch that not only emphasizes the topic but also showcases your presentation skills.

KPI Framework For Fast Moving Consumer Goods Ppt PowerPoint Presentation File Show PDF
The below mentioned slide highlights key performance indicator framework for measuring fast moving consumer goods. This includes indicators like out of stock, supply chain cost, carrying cost of inventory and average time taken to sell the goods to the ultimate consumers. Pitch your topic with ease and precision using this kpi framework for fast moving consumer goods ppt powerpoint presentation file show pdf This layout presents information on average, stock rate, cost It is also available for immediate download and adjustment. So, changes can be made in the color, design, graphics or any other component to create a unique layout.

Key Performance Indicators Of ADC Cosmetics Company With Future Targets Structure PDF
Deliver an awe inspiring pitch with this creative key performance indicators of adc cosmetics company with future targets structure pdf bundle. Topics like market share, stock turnover rate, key performance indicators can be discussed with this completely editable template. It is available for immediate download depending on the needs and requirements of the user.

Portfolio Analysis And Evaluation Powerpoint Slides Templates
This is a portfolio analysis and evaluation powerpoint slides templates. This is a six stage process. The stages in this process are your current portfolio, holding, current weight, current value, us total stock market, us large cap value, us mid cap value, us small cap value, developed markets, emerging markets, municipal bonds, us corporate, interactional bonds, emerging markets bonds, data analysis.

Performance Assessment Sales Initiative Report Sales Team Incentive Plan Reward System Microsoft
Presenting this set of slides with name performance assessment sales initiative report sales team incentive plan reward system microsoft. This is a three stage process. The stages in this process are stock options, profit sharing, staff recognition. This is a completely editable PowerPoint presentation and is available for immediate download. Download now and impress your audience.
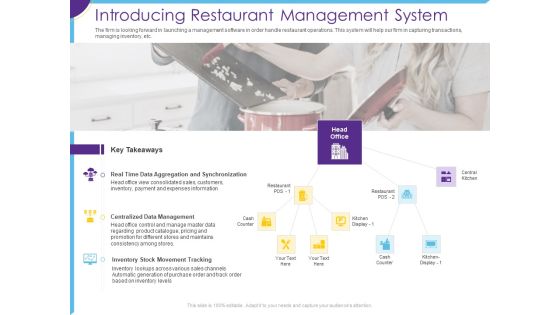
Optimization Restaurant Operations Introducing Restaurant Management System Clipart PDF
Deliver and pitch your topic in the best possible manner with this optimization restaurant operations introducing restaurant management system clipart pdf. Use them to share invaluable insights on centralized data management, inventory stock movement tracking, synchronization and impress your audience. This template can be altered and modified as per your expectations. So, grab it now.
Eight Methods Of Inventory Management With Icons Ppt PowerPoint Presentation File Templates PDF
Presenting eight methods of inventory management with icons ppt powerpoint presentation file templates pdf to dispense important information. This template comprises eight stages. It also presents valuable insights into the topics including stock auditing, vendor auditing, tracking kpis. This is a completely customizable PowerPoint theme that can be put to use immediately. So, download it and address the topic impactfully.

Corporate Snapshot For Investor Relations One Pager Documents
This slide covers the companys corporate snapshot with share price details and market performance for different stock markets. Presenting you an exemplary Corporate Snapshot For Investor Relations One Pager Documents. Our one-pager comprises all the must-have essentials of an inclusive document. You can edit it with ease, as its layout is completely editable. With such freedom, you can tweak its design and other elements to your requirements. Download this Corporate Snapshot For Investor Relations One Pager Documents brilliant piece now.

Logistics Control Tower For Handling Overall Operations Guidelines PDF
The following slide depicts logistics control tower for handling overall operations. It contains details about suppliers, regional warehouse, yard management, QR code, transit, temperature, rack, pallet, stock data, etc. Deliver and pitch your topic in the best possible manner with this Logistics Control Tower For Handling Overall Operations Guidelines PDF. Use them to share invaluable insights on Business Intelligence, Risk Management, Event Management and impress your audience. This template can be altered and modified as per your expectations. So, grab it now.

Strategies To Improve Warehouse Inventory Management Summary PDF
This slide covers strategies to improve stock inventory management. It involves four strategies such as supply chain monitoring, efficient use of technology, data analysis and continuous improvement. Presenting Strategies To Improve Warehouse Inventory Management Summary PDF to dispense important information. This template comprises four stages. It also presents valuable insights into the topics including Supply Chain Monitoring, Data Analysis, Continuous Improvement. This is a completely customizable PowerPoint theme that can be put to use immediately. So, download it and address the topic impactfully.

Comparing Portfolio Returns Ppt Slide
This is a comparing portfolio returns ppt slide. This is a seven stage process. The stages in this process are your current portfolio, holding, current weight, current value, data analysis, us total stock market vti, us largecap value ive vtv, us mid cap value iws, us small cap value vbr iwn, developed markets schf vea, emerging markets vwo iemg, municipal bonds mub nyf, us corporate onds lqd, interactional bonds bndx, emerging markets bonds vwob.
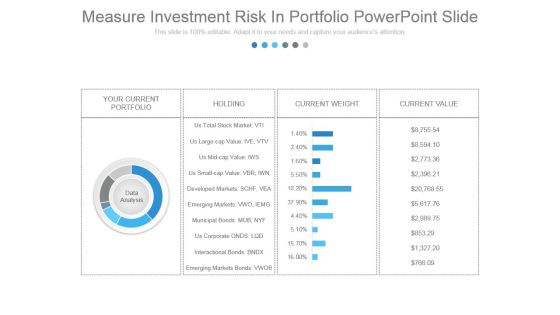
Measure Investment Risk In Portfolio Powerpoint Slide
This is a measure investment risk in portfolio powerpoint slide. This is a four stage process. The stages in this process are your current portfolio, holding, current weight, current value, data analysis, us total stock market vti, us large cap value ive vtv, us mid cap value iws, us small cap value vbr iwn, developed markets schf, vea, emerging markets vwo, iemg, municipal bonds mub, nyf, us corporate onds lqd, interactional bonds bndx, emerging markets bonds vwob.
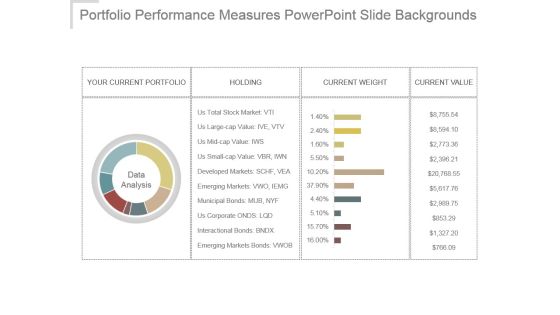
Portfolio Performance Measures Powerpoint Slide Backgrounds
This is a portfolio performance measures powerpoint slide backgrounds. This is a seven stage process. The stages in this process are your current portfolio, holding, current weight, current value, data analysis, us total stock market vti, us large cap value ive vtv, us mid cap value iws, us small cap value vbr iwn, developed markets schf vea, emerging markets vwo iemg, municipal bonds mub nyf, us corporate onds lqd, interactional bonds bndx, emerging markets bonds vwob.
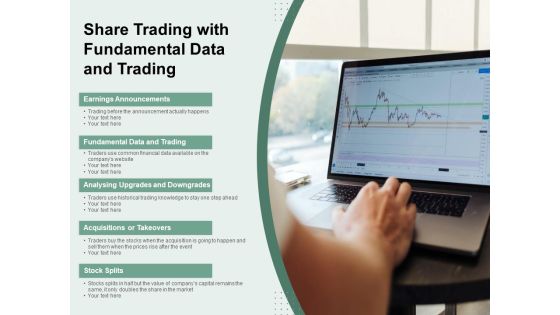
Share Trading With Fundamental Data And Trading Ppt PowerPoint Presentation Ideas Template PDF
Presenting this set of slides with name share trading with fundamental data and trading ppt powerpoint presentation ideas template pdf. This is a one stage process. The stages in this process are earnings announcements, fundamental data and trading, analysing upgrades and downgrades, acquisitions or takeovers, stock splits. This is a completely editable PowerPoint presentation and is available for immediate download. Download now and impress your audience.

Ppt Linear Flow 3 Stages1 PowerPoint Templates
PPT linear flow 3 stages1 PowerPoint Templates-This PowerPoint Diagram can be used to represent worldwide business issues such as financial data, stock market Exchange, increase in sales, corporate presentations and more. It illustrates the blue component of this worldwide PowerPoint Diagram.-PPT linear flow 3 stages1 PowerPoint Templates-Abstract, Arrow, Blank, Business, Chart, Circular, Circulation, Concept, Conceptual, Design, Diagram, Executive, Icon, Idea, Illustration, Management, Model, Numbers, Organization, Procedure, Process, Progression, Resource, Sequence, Sequential, 3Stages, Steps, Strategy

