Dashboard Speedometers
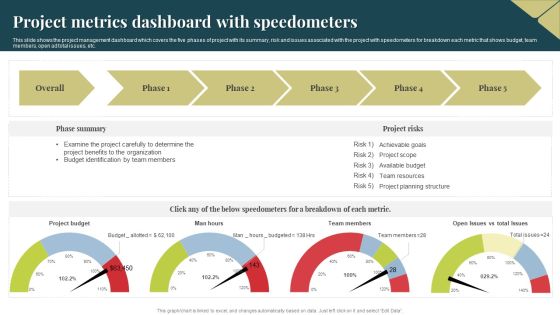
Project Metrics Dashboard With Speedometers Themes PDF
This slide shows the project management dashboard which covers the five phases of project with its summary, risk and issues associated with the project with speedometers for breakdown each metric that shows budget, team members, open ad total issues, etc. Showcasing this set of slides titled Project Metrics Dashboard With Speedometers Themes PDF. The topics addressed in these templates are Budget, Project Benefits, Organization. All the content presented in this PPT design is completely editable. Download it and make adjustments in color, background, font etc. as per your unique business setting.

Analytics Icon Dashboard Speedometer Ppt PowerPoint Presentation Complete Deck
Presenting this set of slides with name analytics icon dashboard speedometer ppt powerpoint presentation complete deck. The topics discussed in these slides are dashboard, speedometer, key performance, business, automobile. This is a completely editable PowerPoint presentation and is available for immediate download. Download now and impress your audience.
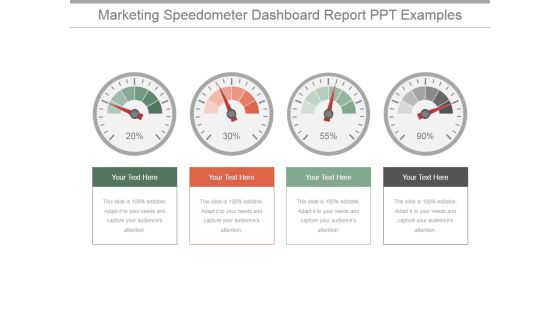
Marketing Speedometer Dashboard Report Ppt PowerPoint Presentation Designs Download
This is a marketing speedometer dashboard report ppt powerpoint presentation designs download. This is a four stage process. The stages in this process are dashboard, measurement, percentage, business, finance.
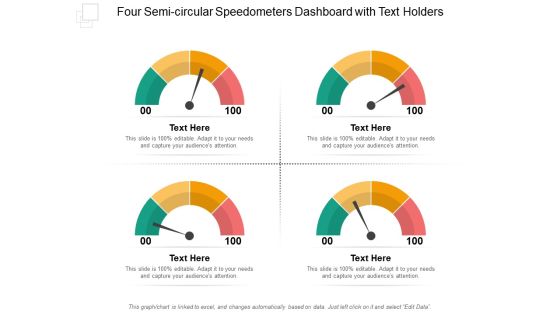
Four Semi Circular Speedometers Dashboard With Text Holders Ppt PowerPoint Presentation File Layouts
This is a four semi circular speedometers dashboard with text holders ppt powerpoint presentation file layouts. This is a four stage process. The stages in this process are fuel gauge, gas gauge, fuel containers.
Vehicle Dashboard With Speedometer Vector Icon Ppt PowerPoint Presentation Portfolio Graphics PDF
Presenting vehicle dashboard with speedometer vector icon ppt powerpoint presentation portfolio graphics pdf to dispense important information. This template comprises three stages. It also presents valuable insights into the topics including vehicle dashboard with speedometer vector icon. This is a completely customizable PowerPoint theme that can be put to use immediately. So, download it and address the topic impactfully.

Car Dashboard And Speedometer Graphics Ppt PowerPoint Presentation File Graphics Template
This is a car dashboard and speedometer graphics ppt powerpoint presentation file graphics template. This is a four stage process. The stages in this process are fuel gauge, gas gauge, fuel containers.
Speedometer Dashboard Vector Icon Ppt PowerPoint Presentation File Designs Download PDF
Presenting this set of slides with name speedometer dashboard vector icon ppt powerpoint presentation file designs download pdf. This is a four stage process. The stages in this process are speedometer dashboard vector icon. This is a completely editable PowerPoint presentation and is available for immediate download. Download now and impress your audience.
Vehicle Speedometer Dashboard Vector Icon Ppt PowerPoint Presentation Slides Show PDF
Persuade your audience using this vehicle speedometer dashboard vector icon ppt powerpoint presentation slides show pdf. This PPT design covers three stages, thus making it a great tool to use. It also caters to a variety of topics including vehicle speedometer dashboard vector icon. Download this PPT design now to present a convincing pitch that not only emphasizes the topic but also showcases your presentation skills.
Speedometer Vehicle Dashboard Vector Icon Ppt PowerPoint Presentation Ideas Design Inspiration PDF
Persuade your audience using this speedometer vehicle dashboard vector icon ppt powerpoint presentation ideas design inspiration pdf. This PPT design covers three stages, thus making it a great tool to use. It also caters to a variety of topics including speedometer vehicle dashboard vector icon. Download this PPT design now to present a convincing pitch that not only emphasizes the topic but also showcases your presentation skills.
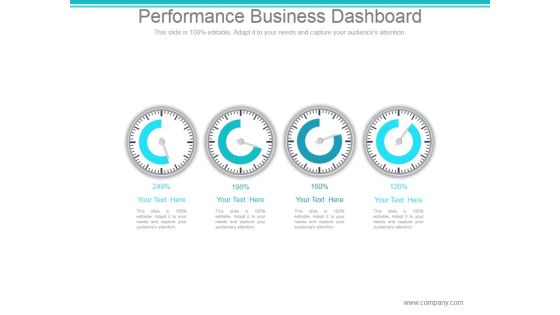
Performance Business Dashboard Ppt PowerPoint Presentation Visuals
This is a performance business dashboard ppt powerpoint presentation visuals. This is a four stage process. The stages in this process are dashboard, speedometer, report, business, marketing.
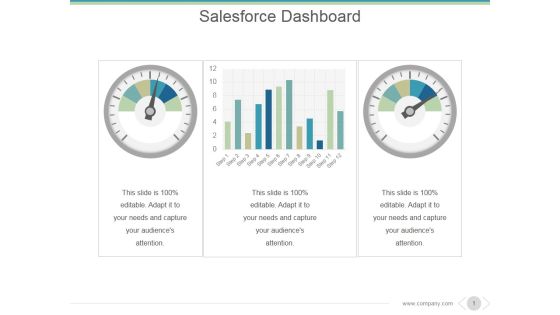
Salesforce Dashboard Ppt PowerPoint Presentation Summary
This is a salesforce dashboard ppt powerpoint presentation summary. This is a two stage process. The stages in this process are business, marketing, dashboard, graph, speedometer.

Dashboard Ppt PowerPoint Presentation Infographic Template Tips
This is a dashboard ppt powerpoint presentation infographic template tips. This is a three stage process. The stages in this process are speedometer, dashboard, business, marketing, equipment.
Speedometer Vector Icon Ppt Powerpoint Presentation Gallery Objects
This is a speedometer vector icon ppt powerpoint presentation gallery objects. This is a four stage process. The stages in this process are accelerator, seed accelerators, startup accelerator.

Revenue Performance Reporting Speedometer Ppt PowerPoint Presentation Visuals
This is a revenue performance reporting speedometer ppt powerpoint presentation visuals. This is a four stage process. The stages in this process are speedometer, measurement, business, marketing, finance.

Dashboards For Measuring Business Performance Ppt Icon
This is a dashboards for measuring business performance ppt icon. This is a three stage process. The stages in this process are dashboard, measuring, management, speedometer, icons, strategy.
Speedometer Performance Indicator Vector Icon Ppt PowerPoint Presentation Show Deck PDF
Presenting this set of slides with name speedometer performance indicator vector icon ppt powerpoint presentation show deck pdf. This is a three stage process. The stages in this process are speedometer performance indicator vector icon. This is a completely editable PowerPoint presentation and is available for immediate download. Download now and impress your audience.
Speedometer On Human Hand Vector Icon Ppt PowerPoint Presentation Outline Icons PDF
Presenting this set of slides with name speedometer on human hand vector icon ppt powerpoint presentation outline icons pdf. This is a three stage process. The stages in this process are speedometer on human hand vector icon. This is a completely editable PowerPoint presentation and is available for immediate download. Download now and impress your audience.
Vector Illustration Of Speedometer Vector Icon Ppt PowerPoint Presentation Ideas Slides PDF
Persuade your audience using this vector illustration of speedometer vector icon ppt powerpoint presentation ideas slides pdf. This PPT design covers three stages, thus making it a great tool to use. It also caters to a variety of topics including vector illustration of speedometer vector icon. Download this PPT design now to present a convincing pitch that not only emphasizes the topic but also showcases your presentation skills.
Speedometer Compass Round Shape Vector Icon Ppt PowerPoint Presentation Gallery Design Inspiration PDF
Presenting this set of slides with name speedometer compass round shape vector icon ppt powerpoint presentation gallery design inspiration pdf. This is a three stage process. The stages in this process are speedometer compass round shape vector icon. This is a completely editable PowerPoint presentation and is available for immediate download. Download now and impress your audience.
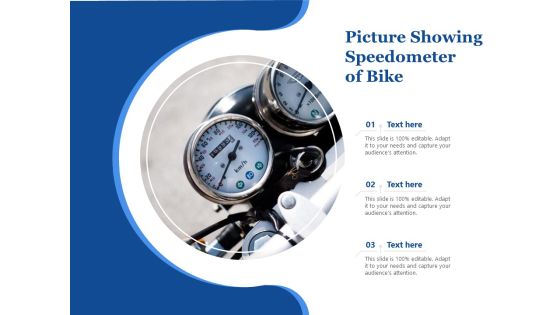
Picture Showing Speedometer Of Bike Ppt PowerPoint Presentation File Shapes PDF
Presenting picture showing speedometer of bike ppt powerpoint presentation file shapes pdf to dispense important information. This template comprises three stages. It also presents valuable insights into the topics including picture showing speedometer of bike. This is a completely customizable PowerPoint theme that can be put to use immediately. So, download it and address the topic impactfully.
Vector Illustration Of Speedometer Gauge Icon Ppt PowerPoint Presentation File Outline PDF
Persuade your audience using this vector illustration of speedometer gauge icon ppt powerpoint presentation file outline pdf. This PPT design covers three stages, thus making it a great tool to use. It also caters to a variety of topics including vector illustration of speedometer gauge icon. Download this PPT design now to present a convincing pitch that not only emphasizes the topic but also showcases your presentation skills.
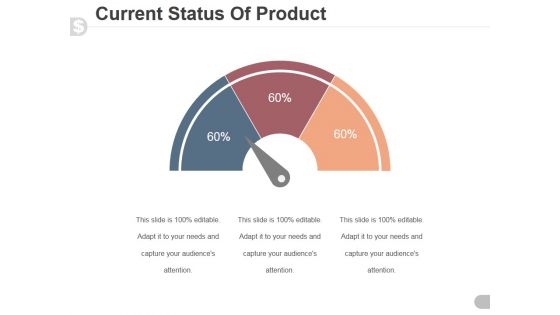
Current Status Of Product Ppt PowerPoint Presentation Designs Download
This is a current status of product ppt powerpoint presentation designs download. This is a three stage process. The stages in this process are speedometer, dashboard, business, marketing, finance.

Dashboard With Business Icons Powerpoint Slides
This PowerPoint template graphics of meter chart with business icons. Download this PPT chart to simplify business data analysis. This PowerPoint slide is of great help in the business sector to make realistic presentations and provides effective way of presenting your newer thoughts.

Dashboard Performance Analysis Chart Powerpoint Slides
This PowerPoint template graphics of meter chart. Download this PPT chart for business performance analysis. This PowerPoint slide is of great help in the business sector to make realistic presentations and provides effective way of presenting your newer thoughts.

Dashboard To Impact The Performance Powerpoint Slides
This PowerPoint template graphics of meter chart. Download this PPT chart for business performance analysis. This PowerPoint slide is of great help in the business sector to make realistic presentations and provides effective way of presenting your newer thoughts.
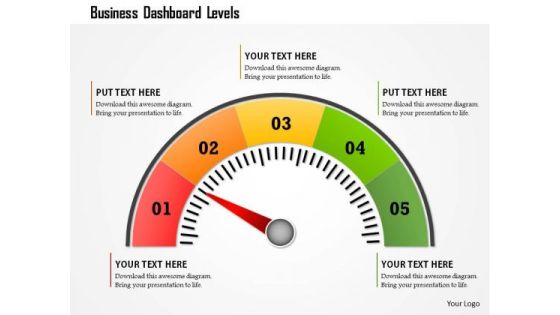
Business Framework Business Dashboard Levels PowerPoint Presentation
This business diagram displays colored meter with multiple levels. Use this diagram to display business process. This diagram can be used to indicate performance measures. This is an excellent diagram to impress your audiences.

Dashboard To Simplify Business Data Analysis Powerpoint Slides
This PowerPoint template graphics of meter chart. Download this PPT chart to simplify business data analysis. This PowerPoint slide is of great help in the business sector to make realistic presentations and provides effective way of presenting your newer thoughts.

Dashboard Meter On Excel Ppt PowerPoint Presentation Icon Slides PDF
Showcasing this set of slides titled dashboard meter on excel ppt powerpoint presentation icon slides pdf. The topics addressed in these templates are dashboard meter on excel. All the content presented in this PPT design is completely editable. Download it and make adjustments in color, background, font etc. as per your unique business setting.
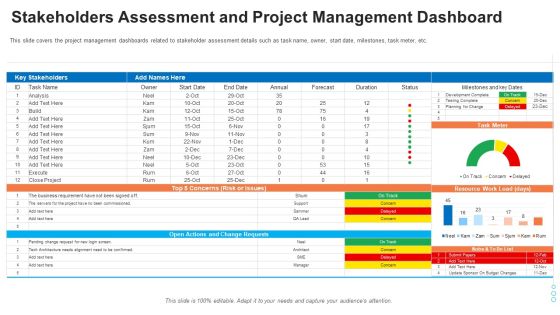
Evaluation Mapping Stakeholders Assessment And Project Management Dashboard Structure PDF
This slide covers the project management dashboards related to stakeholder assessment details such as task name, owner, start date, milestones, task meter, etc. Deliver an awe-inspiring pitch with this creative evaluation mapping stakeholders assessment and project management dashboard structure pdf bundle. Topics like stakeholders assessment and project management dashboard can be discussed with this completely editable template. It is available for immediate download depending on the needs and requirements of the user.
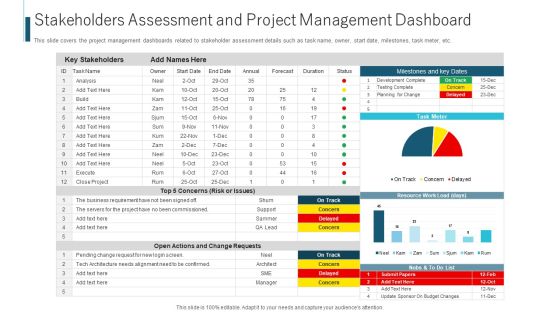
Stakeholders Assessment And Project Management Dashboard Ppt Ideas Outline PDF
This slide covers the project management dashboards related to stakeholder assessment details such as task name, owner, start date, milestones, task meter, etc. Deliver and pitch your topic in the best possible manner with this stakeholders assessment and project management dashboard ppt ideas outline pdf. Use them to share invaluable insights on risk or issues, business requirement, analysis and impress your audience. This template can be altered and modified as per your expectations. So, grab it now.
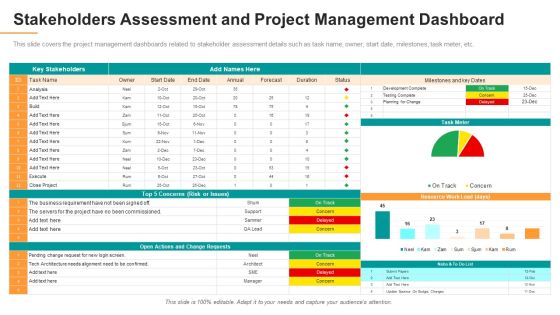
Stakeholders Assessment And Project Management Dashboard Formats PDF
This slide covers the project management dashboards related to stakeholder assessment details such as task name, owner, start date, milestones, task meter, etc. Deliver an awe inspiring pitch with this creative stakeholders assessment and project management dashboard formats pdf bundle. Topics like resource, stakeholders, analysis can be discussed with this completely editable template. It is available for immediate download depending on the needs and requirements of the user.
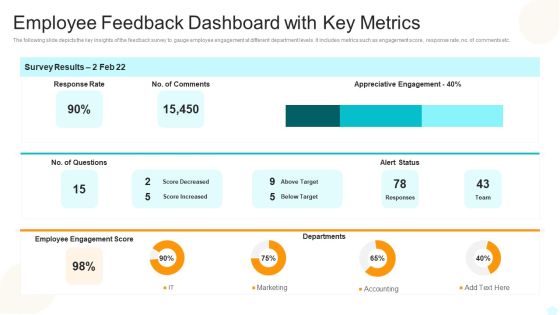
Employee Feedback Dashboard With Key Metrics Elements PDF
The following slide depicts the key insights of the feedback survey to gauge employee engagement at different department levels. It includes metrics such as engagement score, response rate, no. of comments etc.Showcasing this set of slides titled Employee Feedback Dashboard With Key Metrics Elements PDF The topics addressed in these templates are Employee Feedback Dashboard With Key Metrics All the content presented in this PPT design is completely editable. Download it and make adjustments in color, background, font etc. as per your unique business setting.
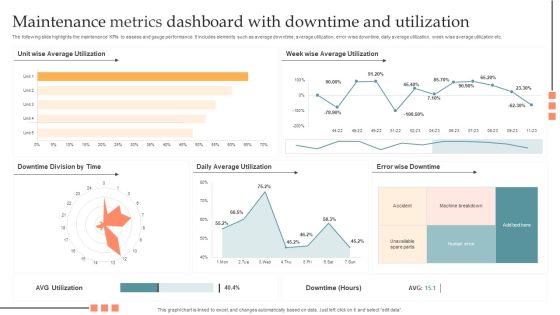
Maintenance Metrics Dashboard With Downtime And Utilization Pictures PDF
The following slide highlights the maintenance KPIs to assess and gauge performance. It includes elements such as average downtime, average utilization, error wise downtime, daily average utilization, week wise average utilization etc. Showcasing this set of slides titled Maintenance Metrics Dashboard With Downtime And Utilization Pictures PDF. The topics addressed in these templates are Maintenance Metrics Dashboard, Downtime And Utilization. All the content presented in this PPT design is completely editable. Download it and make adjustments in color, background, font etc. as per your unique business setting.

Dashboard For Measuring And Assessing Communication Tactics Information PDF
This slide represents dashboard to assess and gauge internal communication approaches which benefits industries in assessing strategy, plan gaps and build efficient employee engagement. Elements included in this slide are engagement score, employee satisfaction rate, communication tools and strategies, etc. Showcasing this set of slides titled Dashboard For Measuring And Assessing Communication Tactics Information PDF. The topics addressed in these templates are Employee Engagement, Employee Response Rate, Communication Effectiveness. All the content presented in this PPT design is completely editable. Download it and make adjustments in color, background, font etc. as per your unique business setting.
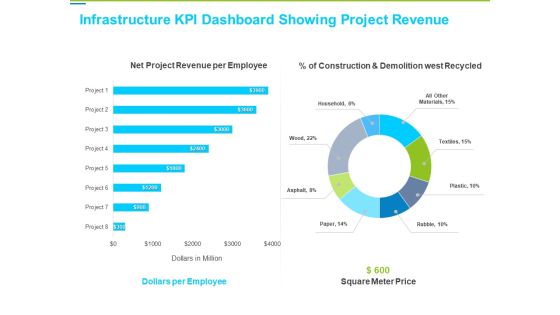
Framework Administration Infrastructure KPI Dashboard Showing Project Revenue Background PDF
Deliver an awe-inspiring pitch with this creative framework administration infrastructure kpi dashboard showing project revenue background pdf bundle. Topics like net project revenue per employee, dollars per employee, square meter price can be discussed with this completely editable template. It is available for immediate download depending on the needs and requirements of the user.

Customer Satisfaction Levels High Medium Low Indicator Dashboard Ppt PowerPoint Presentation Icon Show
This is a customer satisfaction levels high medium low indicator dashboard ppt powerpoint presentation icon show. This is a six stage process. The stages in this process are performance dashboard, performance meter, performance kpi.

Dashboard Vector With Pointer And Text Holders Ppt PowerPoint Presentation Portfolio Format Ideas
This is a dashboard vector with pointer and text holders ppt powerpoint presentation portfolio format ideas. This is a four stage process. The stages in this process are performance dashboard, performance meter, performance kpi.

Low High Performance Measurement Indicator Dashboard Ppt PowerPoint Presentation Summary Images
This is a low high performance measurement indicator dashboard ppt powerpoint presentation summary images. This is a five stage process. The stages in this process are performance dashboard, performance meter, performance kpi.
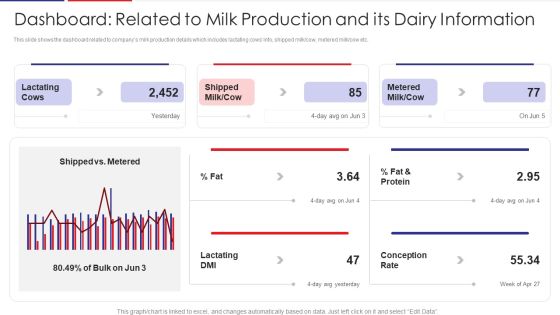
Examination Of Buyer Mindset Towards Dairy Products Dashboard Related To Milk Production Sample PDF
This slide shows the dashboard related to companys milk production details which includes lactating cows info, shipped milk or cow, metered milk or cow etc. Deliver an awe inspiring pitch with this creative examination of buyer mindset towards dairy products dashboard related to milk production sample pdf bundle. Topics like dashboard related to milk production and its dairy information can be discussed with this completely editable template. It is available for immediate download depending on the needs and requirements of the user.

Dashboard Related To Milk Production And Its Dairy Information Diagrams PDF
This slide shows the dashboard related to companys milk production details which includes lactating cows info, shipped milk or cow, metered milk or cow etc. Deliver and pitch your topic in the best possible manner with this dashboard related to milk production and its dairy information diagrams pdf. Use them to share invaluable insights on dashboard related to milk production and its dairy information and impress your audience. This template can be altered and modified as per your expectations. So, grab it now.
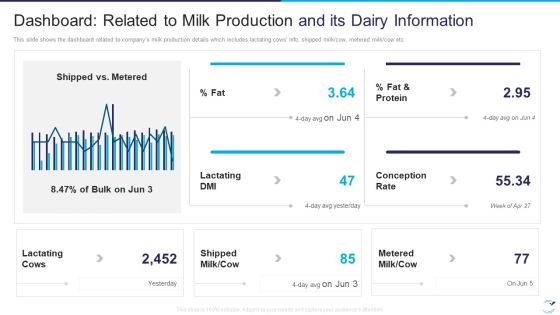
Factor Influencing User Experience Dairy Industry Dashboard Related To Milk Production Guidelines PDF
This slide shows the dashboard related to companys milk production details which includes lactating cows info, shipped milkcow, metered milk cow etc. Deliver and pitch your topic in the best possible manner with this factor influencing user experience dairy industry dashboard related to milk production guidelines pdf . Use them to share invaluable insights on dashboard related to milk production and its dairy information and impress your audience. This template can be altered and modified as per your expectations. So, grab it now.

Strategic Market Insight Implementation Guide Dashboard To Analyze Business Performance In Market Slides PDF
The following slide showcases a dashboard to evaluate organizational performance in market and analyze competition. It outlines components such as number of mention, sentiment meter, number of mentions, geographical distribution. Get a simple yet stunning designed Strategic Market Insight Implementation Guide Dashboard To Analyze Business Performance In Market Slides PDF. It is the best one to establish the tone in your meetings. It is an excellent way to make your presentations highly effective. So, download this PPT today from Slidegeeks and see the positive impacts. Our easy to edit Strategic Market Insight Implementation Guide Dashboard To Analyze Business Performance In Market Slides PDF can be your go to option for all upcoming conferences and meetings. So, what are you waiting for Grab this template today.
Online Risk Management Dashboard For Tracking Threats And Attacks Icons PDF
The purpose of this slide is to represent dashboard to monitor risks and cyber threats for efficient risk management. It includes various types of key performance indicators such as types of risks, severities, sources and risk meter. Showcasing this set of slides titled Online Risk Management Dashboard For Tracking Threats And Attacks Icons PDF. The topics addressed in these templates are Attack, Indication Severities, Sources. All the content presented in this PPT design is completely editable. Download it and make adjustments in color, background, font etc. as per your unique business setting.

Virtual Assets Investment Guide Dashboard To Effectively Track Bitcoin Performance Rules PDF
The following dashboard highlights key parameters that can be used by the organization to track the performance of their Bitcoin investment, it enlists major KPIs such as price of Bitcoin, transaction chart and its historical performance. Deliver an awe inspiring pitch with this creative Virtual Assets Investment Guide Dashboard To Effectively Track Bitcoin Performance Rules PDF bundle. Topics like Bitcoin Chart, Transaction Chart, Prediction Meter can be discussed with this completely editable template. It is available for immediate download depending on the needs and requirements of the user.
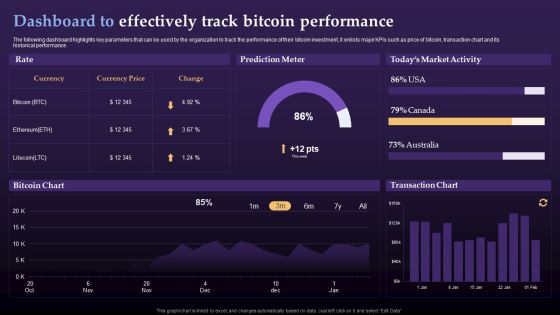
Virtual Currency Investment Guide For Companies Dashboard To Effectively Track Bitcoin Diagrams PDF
The following dashboard highlights key parameters that can be used by the organization to track the performance of their bitcoin investment, it enlists major KPIs such as price of bitcoin, transaction chart and its historical performance. Deliver an awe inspiring pitch with this creative Virtual Currency Investment Guide For Companies Dashboard To Effectively Track Bitcoin Diagrams PDF bundle. Topics like Prediction Meter, Todays Market Activity, Transaction Chart can be discussed with this completely editable template. It is available for immediate download depending on the needs and requirements of the user.
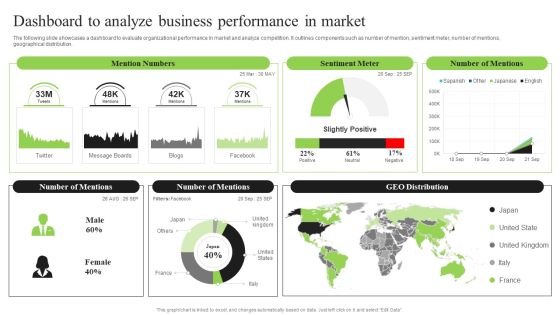
Guidebook For Executing Business Market Intelligence Dashboard To Analyze Business Brochure PDF
The following slide showcases a dashboard to evaluate organizational performance in market and analyze competition. It outlines components such as number of mention, sentiment meter, number of mentions, geographical distribution. Find a pre designed and impeccable Guidebook For Executing Business Market Intelligence Dashboard To Analyze Business Brochure PDF. The templates can ace your presentation without additional effort. You can download these easy to edit presentation templates to make your presentation stand out from others. So, what are you waiting for Download the template from Slidegeeks today and give a unique touch to your presentation.
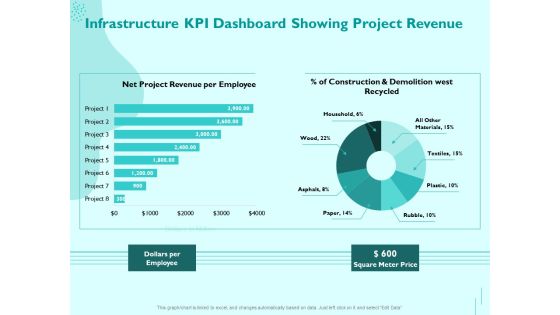
Managing IT Operating System Infrastructure KPI Dashboard Showing Project Revenue Diagrams PDF
Presenting this set of slides with name managing it operating system infrastructure kpi dashboard showing project revenue diagrams pdf. The topics discussed in these slides are dollars per employee, square meter price. This is a completely editable PowerPoint presentation and is available for immediate download. Download now and impress your audience.

Substructure Segment Analysis Infrastructure KPI Dashboard Showing Project Revenue Summary PDF
Deliver and pitch your topic in the best possible manner with this substructure segment analysis infrastructure kpi dashboard showing project revenue summary pdf. Use them to share invaluable insights on square meter price, dollars per employee, net project revenue per employee and impress your audience. This template can be altered and modified as per your expectations. So, grab it now.
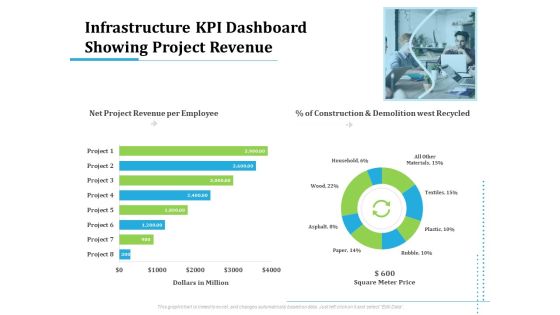
Information Technology Functions Management Infrastructure KPI Dashboard Showing Project Revenue Ppt Show Information PDF
Deliver an awe-inspiring pitch with this creative information technology functions management infrastructure kpi dashboard showing project revenue ppt show information pdf bundle. Topics like net project revenue per employee, construction and demolition west recycled, dollars million, square meter price, project can be discussed with this completely editable template. It is available for immediate download depending on the needs and requirements of the user.

Utilizing Infrastructure Management Using Latest Methods Infrastructure KPI Dashboard Showing Project Revenue Background PDF
Deliver an awe-inspiring pitch with this creative utilizing infrastructure management using latest methods infrastructure kpi dashboard showing project revenue background pdf bundle. Topics like net project revenue per employee, construction and demolition west recycled, dollars million, square meter price, project can be discussed with this completely editable template. It is available for immediate download depending on the needs and requirements of the user.

Improving Operational Activities Enterprise Infrastructure Kpi Dashboard Showing Project Revenue Professional PDF
Deliver an awe inspiring pitch with this creative improving operational activities enterprise infrastructure kpi dashboard showing project revenue professional pdf bundle. Topics like square meter price, dollars per employee can be discussed with this completely editable template. It is available for immediate download depending on the needs and requirements of the user.

Infrastructure Building Administration Infrastructure KPI Dashboard Showing Project Revenue Clipart PDF
Deliver an awe inspiring pitch with this creative infrastructure building administration infrastructure kpi dashboard showing project revenue clipart pdf bundle. Topics like square meter price, net project revenue per employee, dollars per employee can be discussed with this completely editable template. It is available for immediate download depending on the needs and requirements of the user.

Activity Management Customer Relationship Management Dashboard With Lead Status Portrait PDF
This slide illustrates graphical representation of activity management CRM statistical data. It includes sales team lead status, revenue meter, campaigns revenue graph. Showcasing this set of slides titled Activity Management Customer Relationship Management Dashboard With Lead Status Portrait PDF. The topics addressed in these templates are Sales Team Lead Status, Leads Sourced From Market. All the content presented in this PPT design is completely editable. Download it and make adjustments in color, background, font etc. as per your unique business setting.

Business Projects Dashboard Template With Risk Status Report Template Topics PDF
The slide showcases a multi-project status report of a construction company. It highlights the project financials, resource allocation, portfolio risk meter and other key project parameters. Pitch your topic with ease and precision using this Business Projects Dashboard Template With Risk Status Report Template Topics PDF. This layout presents information on Portfolio Risk Meter, Project Financials, Project Parameters, Resource Allocation. It is also available for immediate download and adjustment. So, changes can be made in the color, design, graphics or any other component to create a unique layout.

Budget Vs Actual Cost Comparison Dashboard Ppt PowerPoint Presentation Professional Format Ideas PDF
This slide illustrates fact and figures relating to various project budgets of a company. It includes monthly budget graph, project budget meter and budget vs. Actual costs chart.Pitch your topic with ease and precision using this Budget Vs Actual Cost Comparison Dashboard Ppt PowerPoint Presentation Professional Format Ideas PDF. This layout presents information on Milestones, Budget Graph, Manager. It is also available for immediate download and adjustment. So, changes can be made in the color, design, graphics or any other component to create a unique layout.
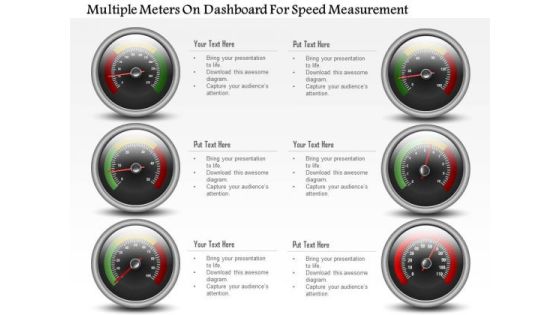
Business Diagram Multiple Meters On Dashboard For Speed Measurement PowerPoint Slide
This business diagram has been designed with multiple meters on dashboard. This slide can be used for business planning and progress. Use this diagram for your business and success milestones related presentations.
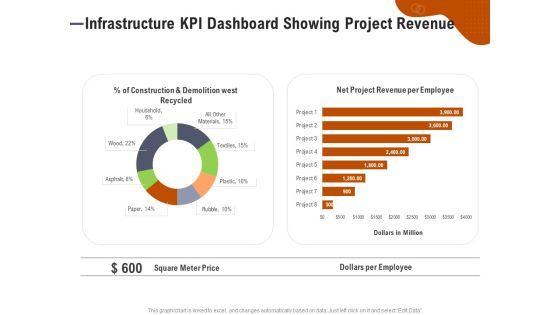
Key Features For Effective Business Management Infrastructure KPI Dashboard Showing Project Revenue Ppt Ideas File Formats PDF
Presenting this set of slides with name key features for effective business management infrastructure kpi dashboard showing project revenue ppt ideas file formats pdf. The topics discussed in these slides are construction and demolition west recycled, net project revenue per employee, square meter price, dollars per employee. This is a completely editable PowerPoint presentation and is available for immediate download. Download now and impress your audience.

KPI Dashboards And Operational Metrics Ppt PowerPoint Presentation Portfolio Infographics

Dashboards For Performance Mapping And Management Ppt PowerPoint Presentation Ideas File Formats
This is a dashboards for performance mapping and management ppt powerpoint presentation ideas file formats. This is a four stage process. The stages in this process are performance dashboard, performance meter, performance kpi.
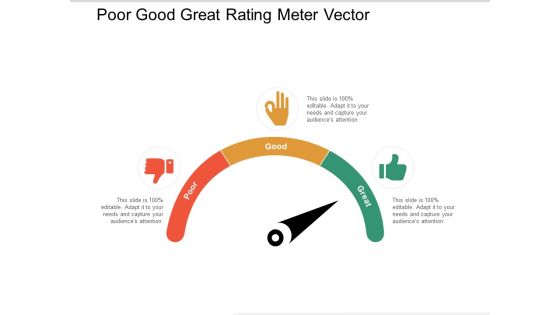
Poor Good Great Rating Meter Vector Ppt PowerPoint Presentation Show Slide Download
Presenting this set of slides with name poor good great rating meter vector ppt powerpoint presentation show slide download. This is a three stage process. The stages in this process are product quality, product improvement, rating scale. This is a completely editable PowerPoint presentation and is available for immediate download. Download now and impress your audience.
Red Yellow Green Meter With Emoticons For Feedback Ppt PowerPoint Presentation Ideas Template
Presenting this set of slides with name red yellow green meter with emoticons for feedback ppt powerpoint presentation ideas template. This is a three stage process. The stages in this process are product quality, product improvement, rating scale. This is a completely editable PowerPoint presentation and is available for immediate download. Download now and impress your audience.

Odometer Image For Kilometer And Speed Control Ppt PowerPoint Presentation Ideas Deck PDF
Presenting odometer image for kilometer and speed control ppt powerpoint presentation ideas deck pdf to dispense important information. This template comprises two stages. It also presents valuable insights into the topics including odometer image for kilometer, speed control. This is a completely customizable PowerPoint theme that can be put to use immediately. So, download it and address the topic impactfully.

Odometer Picture For Kilometer And Speed Control Ppt PowerPoint Presentation Infographics Graphics PDF
Presenting odometer picture for kilometer and speed control ppt powerpoint presentation infographics graphics pdf to dispense important information. This template comprises three stages. It also presents valuable insights into the topics including odometer picture for kilometer and speed control. This is a completely customizable PowerPoint theme that can be put to use immediately. So, download it and address the topic impactfully.

Picture Of Red Odometer With Speed Indicator Ppt PowerPoint Presentation Summary Ideas PDF
Presenting picture of red odometer with speed indicator ppt powerpoint presentation summary ideas pdf to dispense important information. This template comprises two stages. It also presents valuable insights into the topics including picture of red odometer, speed indicator. This is a completely customizable PowerPoint theme that can be put to use immediately. So, download it and address the topic impactfully.

Vector Illustration Of Digital Odometer With Kilometers Ppt PowerPoint Presentation Slides Example PDF
Presenting vector illustration of digital odometer with kilometers ppt powerpoint presentation slides example pdf to dispense important information. This template comprises two stages. It also presents valuable insights into the topics including vector illustration of digital odometer with kilometer. This is a completely customizable PowerPoint theme that can be put to use immediately. So, download it and address the topic impactfully.
Odometer For Speed Control Vector Icon Ppt PowerPoint Presentation Slides Infographics PDF
Persuade your audience using this odometer for speed control vector icon ppt powerpoint presentation slides infographics pdf. This PPT design covers three stages, thus making it a great tool to use. It also caters to a variety of topics including odometer for speed control vector icon. Download this PPT design now to present a convincing pitch that not only emphasizes the topic but also showcases your presentation skills.

Odometer Image For Vehicle Mileage Ppt PowerPoint Presentation Ideas Guide PDF
Persuade your audience using this odometer image for vehicle mileage ppt powerpoint presentation ideas guide pdf. This PPT design covers two stages, thus making it a great tool to use. It also caters to a variety of topics including odometer image for vehicle mileage. Download this PPT design now to present a convincing pitch that not only emphasizes the topic but also showcases your presentation skills.
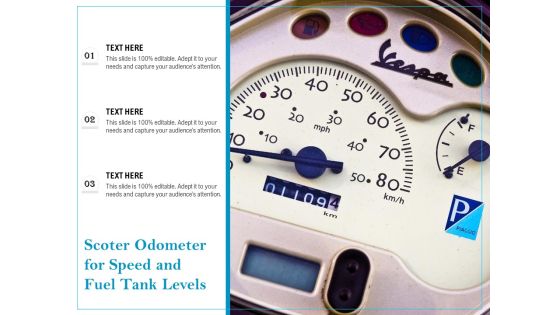
Scoter Odometer For Speed And Fuel Tank Levels Ppt PowerPoint Presentation Outline Mockup PDF
Persuade your audience using this scoter odometer for speed and fuel tank levels ppt powerpoint presentation outline mockup pdf. This PPT design covers three stages, thus making it a great tool to use. It also caters to a variety of topics including scoter odometer, speed and fuel tank levels. Download this PPT design now to present a convincing pitch that not only emphasizes the topic but also showcases your presentation skills.
Good Better Best Rating Meter With Icons Ppt Powerpoint Presentation Outline Vector
This is a good better best rating meter with icons ppt powerpoint presentation outline vector. This is a three stage process. The stages in this process are good better best, good great superb, good great excellent.

Bike Odometer With Red Pointer Ppt PowerPoint Presentation Pictures Templates PDF
Presenting bike odometer with red pointer ppt powerpoint presentation pictures templates pdf to dispense important information. This template comprises three stages. It also presents valuable insights into the topics including bike odometer with red pointer. This is a completely customizable PowerPoint theme that can be put to use immediately. So, download it and address the topic impactfully.

Customer Satisfaction Rating Meter Feedback Rating Scale Sale Services Excellent Ppt PowerPoint Presentation Complete Deck
Presenting this set of slides with name customer satisfaction rating meter feedback rating scale sale services excellent ppt powerpoint presentation complete deck. The topics discussed in these slides are feedback rating scale, sale services, excellent, product, services. This is a completely editable PowerPoint presentation and is available for immediate download. Download now and impress your audience.
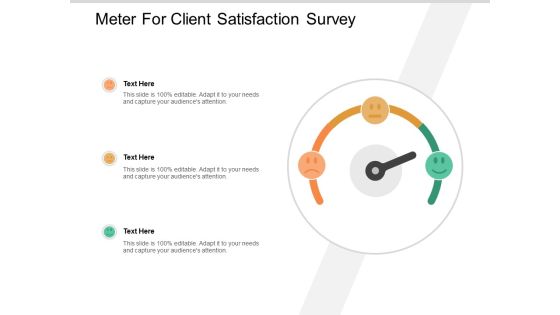
Meter For Client Satisfaction Survey Ppt PowerPoint Presentation Portfolio Outline
Presenting this set of slides with name meter for client satisfaction survey ppt powerpoint presentation portfolio outline. This is a three stage process. The stages in this process are product quality, product improvement, rating scale. This is a completely editable PowerPoint presentation and is available for immediate download. Download now and impress your audience.

Tableau Business Intelligence Tool Salesforce Business Profile Diagrams PDF
This slide highlights the salesforce analytics software reports and dashboards which showcases the dashboard that includes chart, table, gauge with real-time reporting, and security controls. Deliver an awe inspiring pitch with this creative Tableau Business Intelligence Tool Salesforce Business Profile Diagrams PDF bundle. Topics like Server Management, Embedded Analytics, Security Controls can be discussed with this completely editable template. It is available for immediate download depending on the needs and requirements of the user.

Software Application Marketing Data Analytics Report Mockup PDF
This slide shows app marketing analytics dashboard to gauge how well the marketing efforts are performing. It includes parameters like non organic content, organic content attribution,reengegement. Showcasing this set of slides titled Software Application Marketing Data Analytics Report Mockup PDF. The topics addressed in these templates are Software Application, Marketing Data, Analytics Report. All the content presented in this PPT design is completely editable. Download it and make adjustments in color, background, font etc. as per your unique business setting.
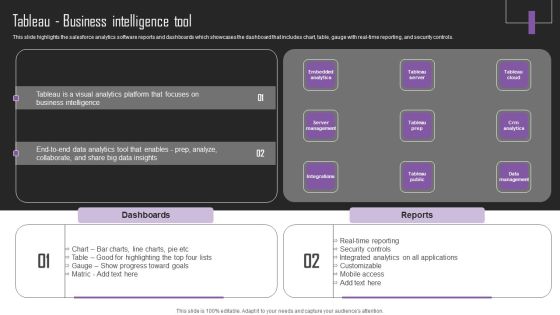
Web Hosting Software Company Outline Tableau Business Intelligence Tool Sample PDF
This slide highlights the salesforce analytics software reports and dashboards which showcases the dashboard that includes chart, table, gauge with real-time reporting, and security controls. This Web Hosting Software Company Outline Tableau Business Intelligence Tool Sample PDF from Slidegeeks makes it easy to present information on your topic with precision. It provides customization options, so you can make changes to the colors, design, graphics, or any other component to create a unique layout. It is also available for immediate download, so you can begin using it right away. Slidegeeks has done good research to ensure that you have everything you need to make your presentation stand out. Make a name out there for a brilliant performance.
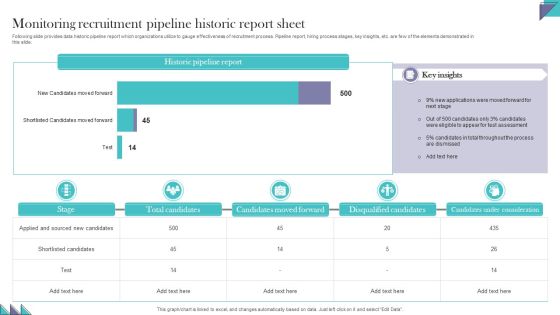
Monitoring Recruitment Pipeline Historic Report Sheet Pictures PDF
Following slide provides data historic pipeline report which organizations utilize to gauge effectiveness of recruitment process. Pipeline report, hiring process stages, key insights, etc. are few of the elements demonstrated in this slide. Pitch your topic with ease and precision using this Monitoring Recruitment Pipeline Historic Report Sheet Pictures PDF. This layout presents information on Candidates Moved Forward, Disqualified Candidates, Candidates Under Consideration. It is also available for immediate download and adjustment. So, changes can be made in the color, design, graphics or any other component to create a unique layout

Customer Behavioral Data And Analytics Measure Net Promoter Score Mockup PDF
The Net Promoter Score measures the willingness of customers to recommend the companys products or services to others. It helps in gauging the customers overall satisfaction with the companys product or service. Deliver and pitch your topic in the best possible manner with this customer behavioral data and analytics measure net promoter score mockup pdf. Use them to share invaluable insights on promoters, passives, detractors and impress your audience. This template can be altered and modified as per your expectations. So, grab it now.

Data Processing Services Delivery Prevent Future Calls Ppt Inspiration Clipart Images PDF
This slide depicts how we can prevent the future calls or repetitive calls by working on the areas of improvement based on the trends or analytics. Deliver an awe inspiring pitch with this creative Data Processing Services Delivery Prevent Future Calls Ppt Inspiration Clipart Images PDF bundle. Topics like Service Level, Abandoned, Incoming Calls Gauge, Total Calls Count can be discussed with this completely editable template. It is available for immediate download depending on the needs and requirements of the user.

Core Operational Competencies Risk Analysis Software Tool Graphics PDF
This slide covers the risk assessment meter with different operational and core objectives. It also includes the list and activity status of initiatives along with the status report. Pitch your topic with ease and precision using this Core Operational Competencies Risk Analysis Software Tool Graphics PDF. This layout presents information on Strategic Partnership, Market Value, Shareholder Investment. It is also available for immediate download and adjustment. So, changes can be made in the color, design, graphics or any other component to create a unique layout.
 Home
Home