AI PPT Maker
Templates
PPT Bundles
Design Services
Business PPTs
Business Plan
Management
Strategy
Introduction PPT
Roadmap
Self Introduction
Timelines
Process
Marketing
Agenda
Technology
Medical
Startup Business Plan
Cyber Security
Dashboards
SWOT
Proposals
Education
Pitch Deck
Digital Marketing
KPIs
Project Management
Product Management
Artificial Intelligence
Target Market
Communication
Supply Chain
Google Slides
Research Services
 One Pagers
All Categories
-
Home
- Customer Favorites
- Cost Summary
Cost Summary
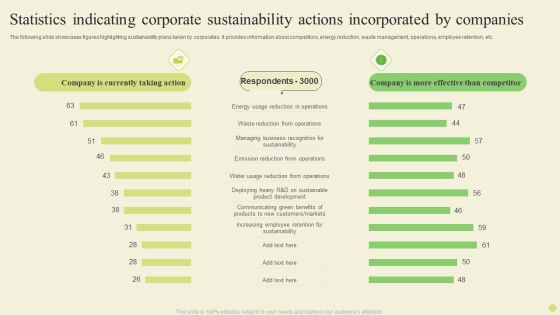
Statistics Indicating Corporate Sustainability Actions Incorporated By Companies Diagrams PDF
The following slide showcases figures highlighting sustainability plans taken by corporates. It provides information about competitors, energy reduction, waste management, operations, employee retention, etc.Pitch your topic with ease and precision using this Statistics Indicating Corporate Sustainability Actions Incorporated By Companies Diagrams PDF. This layout presents information on Energy Reduction, Emission Reduction, Increasing Employee. It is also available for immediate download and adjustment. So, changes can be made in the color, design, graphics or any other component to create a unique layout.
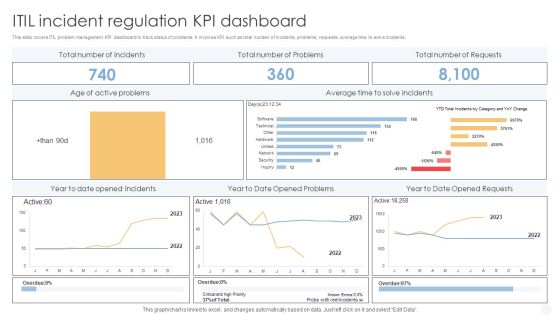
ITIL Incident Regulation Kpi Dashboard Background PDF
This slide covers ITIL problem management KPI dashboard to track status of problems. It involves KPI such as total number of incidents, problems, requests, average time to solve incidents.Pitch your topic with ease and precision using this ITIL Incident Regulation Kpi Dashboard Background PDF. This layout presents information on Active Problems, Average Incidents, Opened Problems. It is also available for immediate download and adjustment. So, changes can be made in the color, design, graphics or any other component to create a unique layout.

Engineering Performance Metrics Dashboard For Measuring Performance Download PDF
This slide covers engineering KPI dashboard to measure performance. It involves KPIs such as cycle time breakdown, risk breakdown, activities on focus and timeline. Pitch your topic with ease and precision using this Engineering Performance Metrics Dashboard For Measuring Performance Download PDF. This layout presents information on Average, Risk Breakdown, Measuring Performance. It is also available for immediate download and adjustment. So, changes can be made in the color, design, graphics or any other component to create a unique layout.

Monthly Sales Capability Statistical Data Background PDF
This slide illustrates graphical representation and tabular data of forecasted and cumulative sales to evaluate companys future targets and achievements. It includes month wise revenue generation. Pitch your topic with ease and precision using this Monthly Sales Capability Statistical Data Background PDF. This layout presents information on Monthly Sales, Capability Statistical Data. It is also available for immediate download and adjustment. So, changes can be made in the color, design, graphics or any other component to create a unique layout.
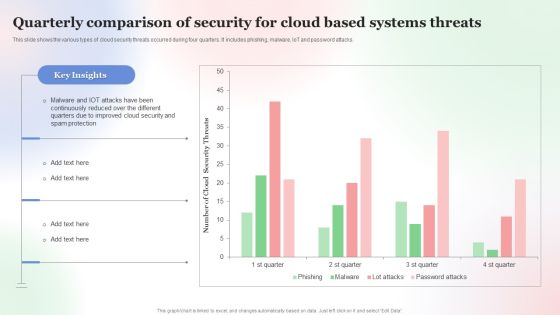
Quarterly Comparison Of Security For Cloud Based Systems Threats Infographics PDF
This slide shows the various types of cloud security threats occurred during four quarters. It includes phishing, malware, IoT and password attacks. Pitch your topic with ease and precision using this Quarterly Comparison Of Security For Cloud Based Systems Threats Infographics PDF. This layout presents information on Quarterly Comparison Of Security, Cloud Based Systems Threats. It is also available for immediate download and adjustment. So, changes can be made in the color, design, graphics or any other component to create a unique layout.
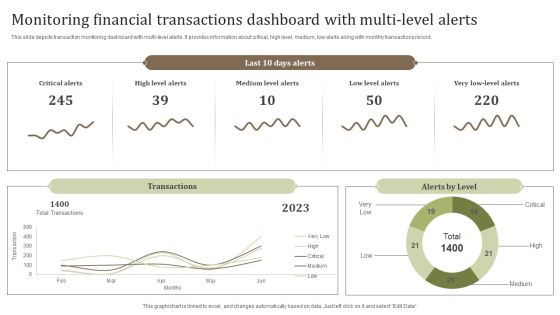
Monitoring Financial Transactions Dashboard With Multi Level Alerts Background PDF
This slide depicts transaction monitoring dashboard with multi-level alerts. It provides information about critical, high level, medium, low alerts along with monthly transactions record. Pitch your topic with ease and precision using this Monitoring Financial Transactions Dashboard With Multi Level Alerts Background PDF. This layout presents information on Critical Alerts, Medium Level Alerts, Total Transactions. It is also available for immediate download and adjustment. So, changes can be made in the color, design, graphics or any other component to create a unique layout.

Business Performance Report Across Diversified Segments Microsoft PDF
This slide illustrates report on business performance on different segments . It includes order won, replacement business, new business across different products etc.Pitch your topic with ease and precision using this Business Performance Report Across Diversified Segments Microsoft PDF. This layout presents information on Replacement Business, New Business, Replacement Business. It is also available for immediate download and adjustment. So, changes can be made in the color, design, graphics or any other component to create a unique layout.
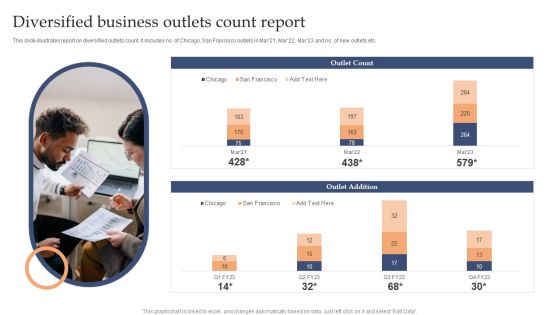
Diversified Business Outlets Count Report Background PDF
This slide illustrates report on diversified outlets count. It includes no. of Chicago, San Francisco outlets in Mar21, Mar22, Mar23 and no. of new outlets etc.Pitch your topic with ease and precision using this Diversified Business Outlets Count Report Background PDF. This layout presents information on Outlet Count, Outlet Addition, Chicago. It is also available for immediate download and adjustment. So, changes can be made in the color, design, graphics or any other component to create a unique layout.
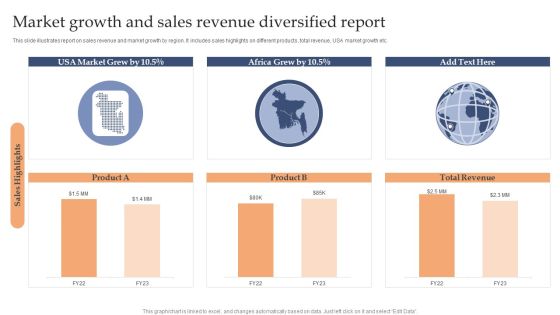
Market Growth And Sales Revenue Diversified Report Sample PDF
This slide illustrates report on sales revenue and market growth by region. It includes sales highlights on different products, total revenue, USA market growth etc.Pitch your topic with ease and precision using this Market Growth And Sales Revenue Diversified Report Sample PDF. This layout presents information on Market Grew, Africa Grew, Total Revenue. It is also available for immediate download and adjustment. So, changes can be made in the color, design, graphics or any other component to create a unique layout.
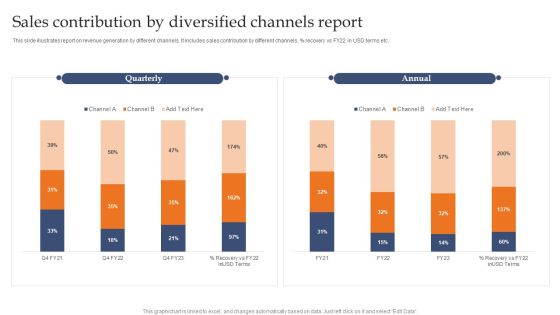
Sales Contribution By Diversified Channels Report Demonstration PDF
This slide illustrates report on revenue generation by different channels. It includes sales contribution by different channels, precent recovery vs FY22 in USD terms etc.Pitch your topic with ease and precision using this Sales Contribution By Diversified Channels Report Demonstration PDF. This layout presents information on Quarterly, Annual, Channel. It is also available for immediate download and adjustment. So, changes can be made in the color, design, graphics or any other component to create a unique layout.

30 60 90 Days Project Administration Strategy Infographics PDF
This slide covers 30 60 90 days project management plan which will be helpful for the project leaders to take relevent actions for completing key activities.Pitch your topic with ease and precision using this 30 60 90 Days Project Administration Strategy Infographics PDF. This layout presents information on Team Discussion, Improve Product, Scheduling Process. It is also available for immediate download and adjustment. So, changes can be made in the color, design, graphics or any other component to create a unique layout.

Quarterly Information Dashboard For Website Performance Portrait PDF
This slide displays KPI dashboard to analyze website performance and overall experience of online customers. It includes details about loading speed, internal links, views and average time. Pitch your topic with ease and precision using this Quarterly Information Dashboard For Website Performance Portrait PDF. This layout presents information on Quarterly Information, Dashboard For Website Performance. It is also available for immediate download and adjustment. So, changes can be made in the color, design, graphics or any other component to create a unique layout.

Corporate Hospitality Administration Dashboard With Occupancy Rate Guidelines PDF
This slide illustrates facts and figures related to hotel chain bookings and occupancy data. It includes visitors, occupancy rate, revenue, bookings comparison, occupancy type, etc.Pitch your topic with ease and precision using this Corporate Hospitality Administration Dashboard With Occupancy Rate Guidelines PDF. This layout presents information on Occupancy Rate, Average Daily Rate, Bookings Comparison. It is also available for immediate download and adjustment. So, changes can be made in the color, design, graphics or any other component to create a unique layout.
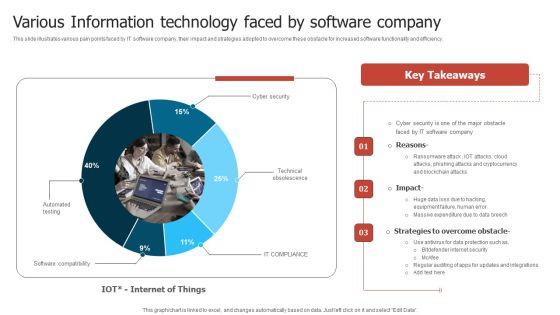
Various Information Technology Faced By Software Company Slides PDF
This slide illustrates various pain points faced by IT software company, their impact and strategies adopted to overcome these obstacle for increased software functionality and efficiency. Pitch your topic with ease and precision using this Various Information Technology Faced By Software Company Slides PDF. This layout presents information on Software Company, Phishing Attacks, Massive Expenditure. It is also available for immediate download and adjustment. So, changes can be made in the color, design, graphics or any other component to create a unique layout.

B2b Marketing Communication Strategies Survey Introduction PDF
The slide displays survey of various advertising strategies used by B2B marketers to communicate brand message. Various strategies included are seminars, e-book advertising, trade shows, paid advertisements, whitepapers, etc.Pitch your topic with ease and precision using this B2b Marketing Communication Strategies Survey Introduction PDF. This layout presents information on Increasing Customer, Engagement Activities, Adversting Strategies. It is also available for immediate download and adjustment. So, changes can be made in the color, design, graphics or any other component to create a unique layout.
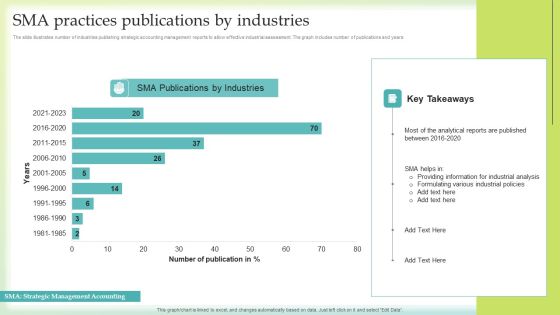
SMA Practices Publications By Industries Microsoft PDF
The slide illustrates number of industries publishing strategic accounting management reports to allow effective industrial assessment. The graph includes number of publications and years . Pitch your topic with ease and precision using this SMA Practices Publications By Industries Microsoft PDF. This layout presents information on Providing Information, Industrial Analysis, Publications Industries. It is also available for immediate download and adjustment. So, changes can be made in the color, design, graphics or any other component to create a unique layout.

Change Requests Management And Management Dashboard Clipart PDF
This slide illustrates facts and figures related to managing change requests. It includes request statistics, latest change requests, status by assignee, status by priority, etc. Pitch your topic with ease and precision using this Change Requests Management And Management Dashboard Clipart PDF. This layout presents information on Status By Assignee, Status By Priority, Request Statistics. It is also available for immediate download and adjustment. So, changes can be made in the color, design, graphics or any other component to create a unique layout.

Warehouse Efficiency Management Dashboard Showing Query Execution Rules PDF
This slide shows the dashboard representing data related to the performance of warehouse for its management. It shows query- provisioning and overload time along with its execution. Pitch your topic with ease and precision using this Warehouse Efficiency Management Dashboard Showing Query Execution Rules PDF. This layout presents information on Warehouse Performance, Warehouse Size, Database. It is also available for immediate download and adjustment. So, changes can be made in the color, design, graphics or any other component to create a unique layout.

Multiplayer Startup Online Business Simulation Dashboard Demonstration PDF
This slide showcases multiplier startup business simulation dashboard. It provides information about individuals, statistics, team processes, adoption, effectiveness, meetings, alignment, communication, etc. Pitch your topic with ease and precision using this Multiplayer Startup Online Business Simulation Dashboard Demonstration PDF. This layout presents information on Individuals, Team Processes, Statistics. It is also available for immediate download and adjustment. So, changes can be made in the color, design, graphics or any other component to create a unique layout.

Online Business Simulation Activity Dashboard With Quarterly Performance Details Guidelines PDF
This slide shows business simulation tasks with performance information. It provides information about financial and production advisor comments, revenue, rivals, profit, strategies, etc. Pitch your topic with ease and precision using this Online Business Simulation Activity Dashboard With Quarterly Performance Details Guidelines PDF. This layout presents information on Financial Adviser, Production Adviser, Revenue. It is also available for immediate download and adjustment. So, changes can be made in the color, design, graphics or any other component to create a unique layout.
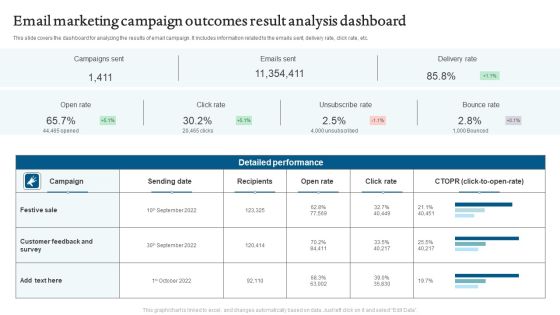
Email Marketing Campaign Outcomes Result Analysis Dashboard Mockup PDF
This slide covers the dashboard for analyzing the email campaign metrics. It includes information related to engagement a key performance indicator KPIs. Pitch your topic with ease and precision using this Email Marketing Campaign Outcomes Result Analysis Dashboard Mockup PDF. This layout presents information on Campaigns Sent, Emails Sent, Delivery Rate. It is also available for immediate download and adjustment. So, changes can be made in the color, design, graphics or any other component to create a unique layout.
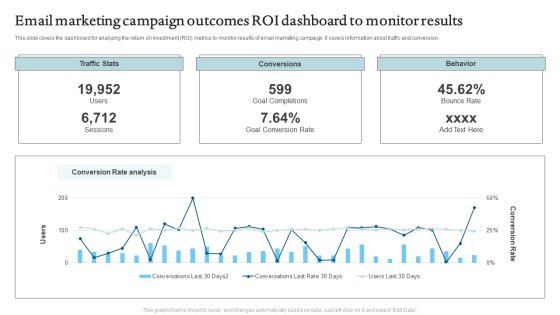
Email Marketing Campaign Outcomes ROI Dashboard To Monitor Results Formats PDF
This slide depicts the dashboard for analyzing the marketing results and campaign performance. It includes information related email sent, delivered, conversions, etc. Pitch your topic with ease and precision using this Email Marketing Campaign Outcomes ROI Dashboard To Monitor Results Formats PDF. This layout presents information on Traffic Stats, Conversions, Behavior. It is also available for immediate download and adjustment. So, changes can be made in the color, design, graphics or any other component to create a unique layout.
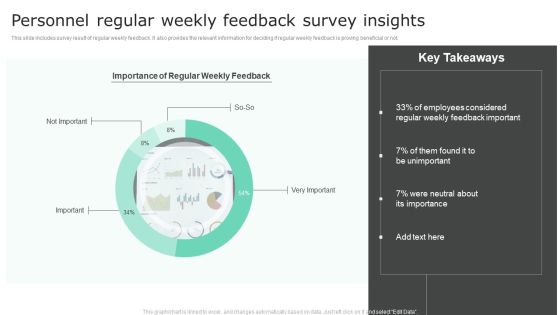
Personnel Regular Weekly Feedback Survey Insights Structure PDF
This slide includes survey result of regular weekly feedback. It also provides the relevant information for deciding if regular weekly feedback is proving beneficial or not. Pitch your topic with ease and precision using this Personnel Regular Weekly Feedback Survey Insights Structure PDF. This layout presents information on Feedback Important, Survey Insights. It is also available for immediate download and adjustment. So, changes can be made in the color, design, graphics or any other component to create a unique layout.

Personnel Survey Insights Analysis Dashboard Inspiration PDF
This slide includes a dashboard of employees survey result significant for understanding employee engagement. It is also important to determine the motivation levels of the employees. Pitch your topic with ease and precision using this Personnel Survey Insights Analysis Dashboard Inspiration PDF. This layout presents information on Employee Survey Result, Overall Survey Results. It is also available for immediate download and adjustment. So, changes can be made in the color, design, graphics or any other component to create a unique layout.

Brand Awareness And Popularity Assessment Dashboard Topics PDF
This slide illustrates graphical representation of facts and figures related with brand awareness. It includes popularity ratings, brand awareness graph, people ratings of brand slogans etc. Pitch your topic with ease and precision using thisBrand Awareness And Popularity Assessment Dashboard Topics PDF. This layout presents information on Customers By Age, Brand Ambassador Analysis, Brand Awareness. It is also available for immediate download and adjustment. So, changes can be made in the color, design, graphics or any other component to create a unique layout.

AI Patents Granted To Pharma Production Companies For Digital Transformation Download PDF
This slide shows number of AI patents granted to pharmaceutical industry for manufacturing products in last 23 Years. Pitch your topic with ease and precision using this AI Patents Granted To Pharma Production Companies For Digital Transformation Download PDF. This layout presents information on Patents Granted Pharma, Production Companies, Digital Transformation. It is also available for immediate download and adjustment. So, changes can be made in the color, design, graphics or any other component to create a unique layout.

Artificial Intelligence Capabilities And Applications In Retail Sector Themes PDF
This slide illustrates statistics related to AI application in retail industry. It includes AI types like machine learning, chatbots, natural language processing and swarm intelligence etc. Pitch your topic with ease and precision using this Artificial Intelligence Capabilities And Applications In Retail Sector Themes PDF. This layout presents information on Capabilities And Applications, Retail Sector. It is also available for immediate download and adjustment. So, changes can be made in the color, design, graphics or any other component to create a unique layout.

Artificial Intelligence Sales Capabilities And Revenue Dashboard Portrait PDF
This slide illustrates artificial intelligence and business intelligence corporate revenue dashboard. It includes pipeline for Aug 2023, revenue for Sep 2023, AI augmented opportunities etc. Pitch your topic with ease and precision using this Artificial Intelligence Sales Capabilities And Revenue Dashboard Portrait PDF. This layout presents information on Sales Capabilities, Revenue Dashboard. It is also available for immediate download and adjustment. So, changes can be made in the color, design, graphics or any other component to create a unique layout.

Social Media Artificial Intelligence Data Visualization Capabilities Dashboard Inspiration PDF
This slide illustrates graphical representation of visualization abilities of artificial intelligence on social media. It includes total impressions, total clicks, performance review etc. Pitch your topic with ease and precision using this Social Media Artificial Intelligence Data Visualization Capabilities Dashboard Inspiration PDF. This layout presents information on Artificial Intelligence, Data Visualization Capabilities. It is also available for immediate download and adjustment. So, changes can be made in the color, design, graphics or any other component to create a unique layout.

Hotel Operations Management Software Key Metrics Dashboard Inspiration PDF
The slide includes a dashboard of hotel property management system that provides information about check in guests , reservations, housekeeping and other KPIs at a glance. Pitch your topic with ease and precision using this Hotel Operations Management Software Key Metrics Dashboard Inspiration PDF. This layout presents information on Reservations, Housekeeping, Occupancy. It is also available for immediate download and adjustment. So, changes can be made in the color, design, graphics or any other component to create a unique layout.

Annual Sales Comparison Of Corporate Products Themes PDF
This slide covers the comparison of annual business sales. It shows that the sales of product A has been increased by 7 percent due to product improvement. Pitch your topic with ease and precision using this Annual Sales Comparison Of Corporate Products Themes PDF. This layout presents information on Annual Sales, Comparison Of Corporate Products. It is also available for immediate download and adjustment. So, changes can be made in the color, design, graphics or any other component to create a unique layout.

Client Analytics Relationship Management Dashboard With Conversion Funnel Demonstration PDF
The following slide depicts the key performing areas in lead management. It includes traffic, potential customers, category wise closing percentages, financial insights etc. Pitch your topic with ease and precision using this Client Analytics Relationship Management Dashboard With Conversion Funnel Demonstration PDF. This layout presents information on Potential Customers, Social Media Followers, Social Media Subscribers. It is also available for immediate download and adjustment. So, changes can be made in the color, design, graphics or any other component to create a unique layout.

Client Support Management Dashboard Designs PDF
This slide shows KPI dashboard of customer service delivery management. It includes key performance indicators such as total support requests received, support status, total solved and unsolved issues, etc. Pitch your topic with ease and precision using this Client Support Management Dashboard Designs PDF. This layout presents information on Client Support, Management Dashboard. It is also available for immediate download and adjustment. So, changes can be made in the color, design, graphics or any other component to create a unique layout.

Client Support Resolution Dashboard Graphics PDF
This slide shows dashboard which can be used by organization in customer service resolution delivery. It includes KPIs such as first call resolution, unsolved issues, average response time, etc. Pitch your topic with ease and precision using this Client Support Resolution Dashboard Graphics PDF. This layout presents information on Client Support, Resolution Dashboard. It is also available for immediate download and adjustment. So, changes can be made in the color, design, graphics or any other component to create a unique layout.
KPI Dashboard Of Client Support Icons PDF
This slide shows customer service delivery key performance indicators dashboard. It includes KPIs such as issues received, average time to close issues, first call resolution, top performers, etc. Pitch your topic with ease and precision using this KPI Dashboard Of Client Support Icons PDF. This layout presents information on KPI Dashboard, Client Support. It is also available for immediate download and adjustment. So, changes can be made in the color, design, graphics or any other component to create a unique layout.

KPI Dashboard Showcasing Product Management Guidelines PDF
This slide showcases dashboard providing product development team performance status with determined KPIs. It provides details such as product development team score, average result scores and result KPIs. Pitch your topic with ease and precision using this KPI Dashboard Showcasing Product Management Guidelines PDF. This layout presents information on Average Rating, Innovation, Design. It is also available for immediate download and adjustment. So, changes can be made in the color, design, graphics or any other component to create a unique layout.
Service Desk Tracker Sheet To Monitor Status Of Ticket Professional PDF
This slide showcases tracker sheet that includes ticket details. It includes ticket number, priority, description, reported date and responsible person. Pitch your topic with ease and precision using this Service Desk Tracker Sheet To Monitor Status Of Ticket Professional PDF. This layout presents information on Ticket Number, Description, Responsible Person. It is also available for immediate download and adjustment. So, changes can be made in the color, design, graphics or any other component to create a unique layout.
New Commodity Development Assessment Metrics Icons PDF
The following slide highlights the key metrics to evaluate product performance. It includes elements such as product wise revenue, time to the market etc.Pitch your topic with ease and precision using this New Commodity Development Assessment Metrics Icons PDF. This layout presents information on Annual Product, Wise Revenue, Shown Continuous. It is also available for immediate download and adjustment. So, changes can be made in the color, design, graphics or any other component to create a unique layout.
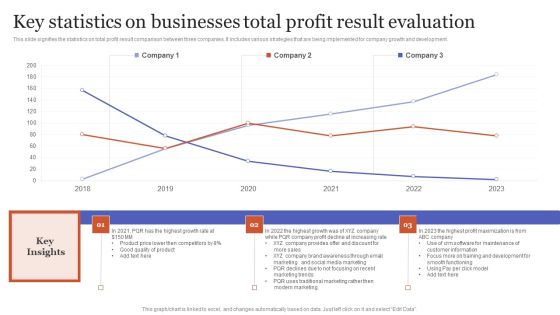
Key Statistics On Businesses Total Profit Result Evaluation Rules PDF
This slide signifies the statistics on total profit result comparison between three companies. It includes various strategies that are being implemented for company growth and development.Pitch your topic with ease and precision using this Key Statistics On Businesses Total Profit Result Evaluation Rules PDF. This layout presents information on Traditional Marketing, Modern Marketing, Training Development. It is also available for immediate download and adjustment. So, changes can be made in the color, design, graphics or any other component to create a unique layout.
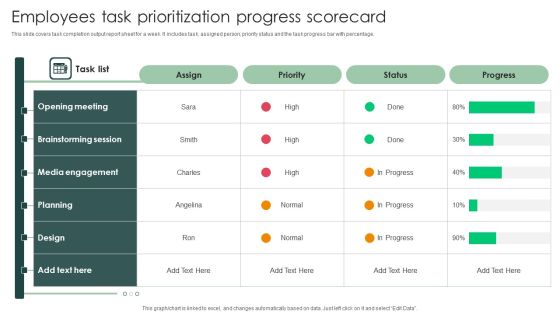
Employees Task Prioritization Progress Scorecard Download PDF
This slide covers task completion output report sheet for a week. It includes task, assigned person, priority status and the task progress bar with percentage.Pitch your topic with ease and precision using this Employees Task Prioritization Progress Scorecard Download PDF. This layout presents information on Communication Skills Development, Manager Training, Area Sales . It is also available for immediate download and adjustment. So, changes can be made in the color, design, graphics or any other component to create a unique layout.

Project Prioritization Progress Scorecard With Assigned Employees Diagrams PDF
This slide covers report of multiple projects with assigned project manager. It also includes priority status, time frame, completion bar along with variances found. Pitch your topic with ease and precision using this Project Prioritization Progress Scorecard With Assigned Employees Diagrams PDF. This layout presents information on Project Prioritization, Progress Scorecard, Assigned Employees. It is also available for immediate download and adjustment. So, changes can be made in the color, design, graphics or any other component to create a unique layout.

Augmented Reality Technology Implementation And Gaming Industry Designs PDF
This slide provides the benefit of using augmented reality technology to transform the gaming industry. Key components are 3D revival, real time interaction and enhanced experience. Pitch your topic with ease and precision using this Augmented Reality Technology Implementation And Gaming Industry Designs PDF. This layout presents information on Gamers Surrounded, Interaction Gamers, Virtual Real. It is also available for immediate download and adjustment. So, changes can be made in the color, design, graphics or any other component to create a unique layout.

Data And Analytics Impact Analysis On Business Slides PDF
This slide covers potential impact of data and analytics on location based services and other sectors. It also includes major barriers to adoption disrupting the process. Pitch your topic with ease and precision using this Data And Analytics Impact Analysis On Business Slides PDF. This layout presents information on Retail, Manufacturing, Location Based Data. It is also available for immediate download and adjustment. So, changes can be made in the color, design, graphics or any other component to create a unique layout.
Pareto Analysis Shipping Tracking Metrics Dashboard Guidelines PDF
This slide showcases dashboard for analyzing on-time delivery trends. It also includes KPIs such as Pareto analysis and on-time deliveries by shipping organizations. Pitch your topic with ease and precision using this Pareto Analysis Shipping Tracking Metrics Dashboard Guidelines PDF. This layout presents information on Pareto Analysis, Deliveries Trends, Shipping Organization. It is also available for immediate download and adjustment. So, changes can be made in the color, design, graphics or any other component to create a unique layout.
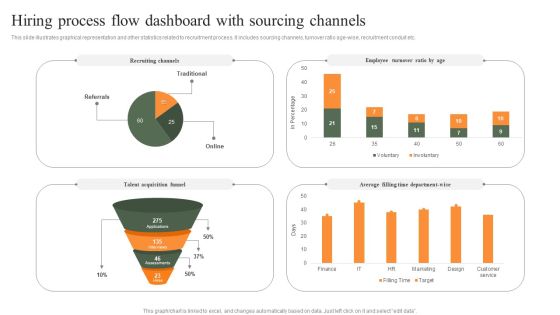
Hiring Process Flow Dashboard With Sourcing Channels Professional PDF
This slide illustrates graphical representation and other statistics related to recruitment process. It includes sourcing channels, turnover ratio age-wise, recruitment conduit etc. Pitch your topic with ease and precision using this Hiring Process Flow Dashboard With Sourcing Channels Professional PDF. This layout presents information on Employee Turnover Ratio, Recruiting Channels, Average. It is also available for immediate download and adjustment. So, changes can be made in the color, design, graphics or any other component to create a unique layout.

Agile Team Member Customer Relationship Management Dashboard With Deals Funnel Mockup PDF
This slide illustrates graphical representation of CRM sales team member data. It includes pipeline, business components and activity level, categories etc. Pitch your topic with ease and precision using this Agile Team Member Customer Relationship Management Dashboard With Deals Funnel Mockup PDF. This layout presents information on Funnel Of Deals, Sent Campaigns Emails, Sales Chart. It is also available for immediate download and adjustment. So, changes can be made in the color, design, graphics or any other component to create a unique layout.

Customer Relationship Management Dashboard With Industry Operations Data Statistics Pictures PDF
This slide illustrates graphical representation of statistical data of sales operation. It includes sales pipeline, closed operations, open operations, operations by closing date etc. Pitch your topic with ease and precision using this Customer Relationship Management Dashboard With Industry Operations Data Statistics Pictures PDF. This layout presents information on Sales Pipeline, Insurance, Telecommunic. It is also available for immediate download and adjustment. So, changes can be made in the color, design, graphics or any other component to create a unique layout.

Customer Relationship Management Salesperson Dashboard With Pipeline And Activity Level Designs PDF
This slide illustrates graphical representation of CRM sales team member data. It includes pipeline, business components and activity level, categories etc. Pitch your topic with ease and precision using this Customer Relationship Management Salesperson Dashboard With Pipeline And Activity Level Designs PDF. This layout presents information on Categories, Business Components, Team Member. It is also available for immediate download and adjustment. So, changes can be made in the color, design, graphics or any other component to create a unique layout.
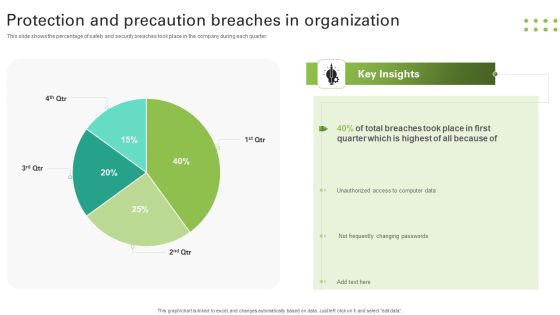
Protection And Precaution Breaches In Organization Slides PDF
This slide shows the percentage of safety and security breaches took place in the company during each quarter. Pitch your topic with ease and precision using this Protection And Precaution Breaches In Organization Slides PDF. This layout presents information on Breaches Took, Quarter, Unauthorized, Changing Passwords. It is also available for immediate download and adjustment. So, changes can be made in the color, design, graphics or any other component to create a unique layout.

Business Components Share Exploded Donut Circle Chart Elements PDF
This slide depicts the share of business components for a successful company and earn profits. It shows the percentage distribution of different components of business. Pitch your topic with ease and precision using this Business Components Share Exploded Donut Circle Chart Elements PDF. This layout presents information on Administration, Marketing, Customer Support. It is also available for immediate download and adjustment. So, changes can be made in the color, design, graphics or any other component to create a unique layout.

Countries Information Technology Export Share Circle Chart Inspiration PDF
This slide depicts IT export share chart of countries to determine global market share. It includes export market share percentage of different countries. Pitch your topic with ease and precision using this Countries Information Technology Export Share Circle Chart Inspiration PDF. This layout presents information on Countries Information Technology, Export Share Circle Chart. It is also available for immediate download and adjustment. So, changes can be made in the color, design, graphics or any other component to create a unique layout.

Employees Sales Performance Comparison Circle Chart Topics PDF
This slide shows the sales share percentage chart by salespersons to gain an understanding of the performance of employees. It includes teams and their sales percentage. Pitch your topic with ease and precision using this Employees Sales Performance Comparison Circle Chart Topics PDF. This layout presents information on Employees Sales Performance, Comparison Circle Chart. It is also available for immediate download and adjustment. So, changes can be made in the color, design, graphics or any other component to create a unique layout.

Software Sales Distribution Circle Chart Demonstration PDF
This slide shows sales distribution of software chart to determine market leader in IT industry. It shows quarterly software sales distribution in percentage. Pitch your topic with ease and precision using this Software Sales Distribution Circle Chart Demonstration PDF. This layout presents information on Software Sales Distribution, Circle Chart. It is also available for immediate download and adjustment. So, changes can be made in the color, design, graphics or any other component to create a unique layout.

USA Phone Market Share Circle Chart Sample PDF
This slide depicts phone market share chart of USA to determine market leader in United States of America. It includes market share of phone companies in USA. Pitch your topic with ease and precision using this USA Phone Market Share Circle Chart Sample PDF. This layout presents information on USA Phone Market, Share Circle Chart. It is also available for immediate download and adjustment. So, changes can be made in the color, design, graphics or any other component to create a unique layout.

Geographical Analysis Of Quarterly Sales Performance Of Business Portrait PDF
This slide displays sales record for different countries to implement marketing strategies. It also includes key insights for the statistics. Pitch your topic with ease and precision using this Geographical Analysis Of Quarterly Sales Performance Of Business Portrait PDF. This layout presents information on Geographical Analysis, Quarterly Sales, Performance Of Business. It is also available for immediate download and adjustment. So, changes can be made in the color, design, graphics or any other component to create a unique layout.

Quarterly Sales Performance Of Business Dashboard With Region And Product Wise Comparison Guidelines PDF
This slide displays sales analysis for different products and regions in each quarter. t also includes inter year comparisons. Pitch your topic with ease and precision using this Quarterly Sales Performance Of Business Dashboard With Region And Product Wise Comparison Guidelines PDF. This layout presents information on Product Wise Quarterly Sales, Comparison. It is also available for immediate download and adjustment. So, changes can be made in the color, design, graphics or any other component to create a unique layout.
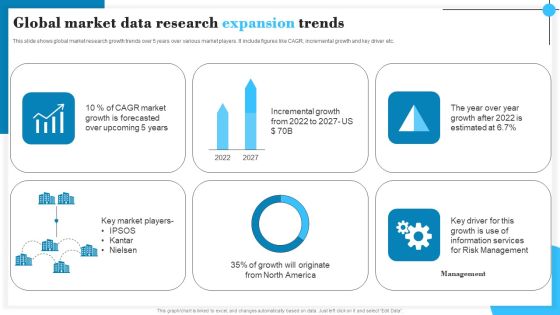
Global Market Data Research Expansion Trends Graphics PDF
This slide shows global market research growth trends over 5 years over various market players. It include figures like CAGR, incremental growth and key driver etc. Pitch your topic with ease and precision using this Global Market Data Research Expansion Trends Graphics PDF. This layout presents information on CAGR Market, Incremental Growth, Management. It is also available for immediate download and adjustment. So, changes can be made in the color, design, graphics or any other component to create a unique layout.
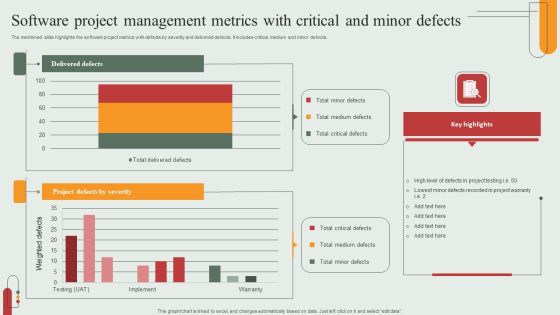
Software Project Management Metrics With Critical And Minor Defects Rules PDF
The mentioned slide highlights the software project metrics with defects by severity and delivered defects. It includes critical, medium and minor defects. Pitch your topic with ease and precision using this Software Project Management Metrics With Critical And Minor Defects Rules PDF. This layout presents information on Delivered Defects, Project Defects Severity, Critical Defects. It is also available for immediate download and adjustment. So, changes can be made in the color, design, graphics or any other component to create a unique layout.
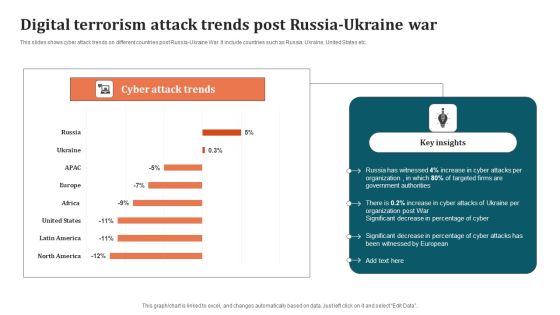
Digital Terrorism Attack Trends Post Russia Ukraine War Graphics PDF
This slides shows cyber attack trends on different countries post Russia-Ukraine War. It include countries such as Russia, Ukraine, United States etc. Pitch your topic with ease and precision using this Digital Terrorism Attack Trends Post Russia Ukraine War Graphics PDF. This layout presents information on Organization, Digital Terrorism Attack Trends. It is also available for immediate download and adjustment. So, changes can be made in the color, design, graphics or any other component to create a unique layout.
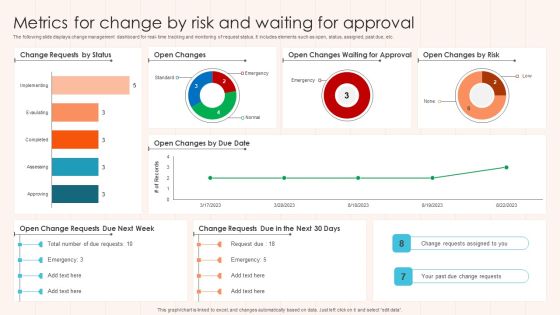
Metrics For Change By Risk And Waiting For Approval Diagrams PDF
The following slide displays change management dashboard for real- time tracking and monitoring of request status. It includes elements such as open, status, assigned, past due, etc. Pitch your topic with ease and precision using this Metrics For Change By Risk And Waiting For Approval Diagrams PDF This layout presents information on Approval, Risk, Status. It is also available for immediate download and adjustment. So, changes can be made in the color, design, graphics or any other component to create a unique layout.
