Cost Plan
Percentage Value Comparison Pie Chart Icon Ppt PowerPoint Presentation Model Clipart Images
This is a percentage value comparison pie chart icon ppt powerpoint presentation model clipart images. This is a three stage process. The stages in this process are percentage icon, dividend icon, portion icon.

Pie Chart Infographic Showing Revenue Share Ppt Styles Graphics Pictures PDF
Persuade your audience using this pie chart infographic showing revenue share ppt styles graphics pictures pdf. This PPT design covers three stages, thus making it a great tool to use. It also caters to a variety of topics including pie chart infographic showing revenue share. Download this PPT design now to present a convincing pitch that not only emphasizes the topic but also showcases your presentation skills.

Executing Private Label Private Brand And Its Competitive Edge In Market Information PDF
This slide represents meaning of private brand in the market along with its competitive advantage over brands. It covers control over production, price control, adaptability and branding. Do you have to make sure that everyone on your team knows about any specific topic I yes, then you should give Executing Private Label Private Brand And Its Competitive Edge In Market Information PDF a try. Our experts have put a lot of knowledge and effort into creating this impeccable Executing Private Label Private Brand And Its Competitive Edge In Market Information PDF. You can use this template for your upcoming presentations, as the slides are perfect to represent even the tiniest detail. You can download these templates from the Slidegeeks website and these are easy to edit. So grab these today.

Executing Private Label Penetration Of Online Private Labels Based On Product Categories Clipart PDF
This slide represents digital private label penetration in market in different product categories based on various factors. It covers factors such as price, accessibility, assortment and returns and reviews. This Executing Private Label Penetration Of Online Private Labels Based On Product Categories Clipart PDF is perfect for any presentation, be it in front of clients or colleagues. It is a versatile and stylish solution for organizing your meetings. The Executing Private Label Penetration Of Online Private Labels Based On Product Categories Clipart PDF features a modern design for your presentation meetings. The adjustable and customizable slides provide unlimited possibilities for acing up your presentation. Slidegeeks has done all the homework before launching the product for you. So, dont wait, grab the presentation templates today.

Guidebook For Executing Business Market Intelligence Description Of Conjoint Analysis As Data Professional PDF
The following slide provides an overview of conjoint analysis for analyzing data in market intelligence to compare various attributes and determine its value. It also highlights its benefits which are brand equity, market segmentation, price sensitivity and attribute interaction calculation. Create an editable Guidebook For Executing Business Market Intelligence Description Of Conjoint Analysis As Data Professional PDF that communicates your idea and engages your audience. Whether you are presenting a business or an educational presentation, pre designed presentation templates help save time. Guidebook For Executing Business Market Intelligence Description Of Conjoint Analysis As Data Professional PDF is highly customizable and very easy to edit, covering many different styles from creative to business presentations. Slidegeeks has creative team members who have crafted amazing templates. So, go and get them without any delay.

Corporate Profile IT Organization Employee Count Of The Company For Last Five Years Infographics PDF
The slide shows the employee count of the company from the year 2017-2021 and their split by geography and functions, at the end of Dec 2021. Deliver an awe inspiring pitch with this creative corporate profile it organization employee count of the company for last five years infographics pdf bundle. Topics like engineering, global sales m and o, worldwide, commercial business, business functions, finance, hr and legal, linkedin can be discussed with this completely editable template. It is available for immediate download depending on the needs and requirements of the user.
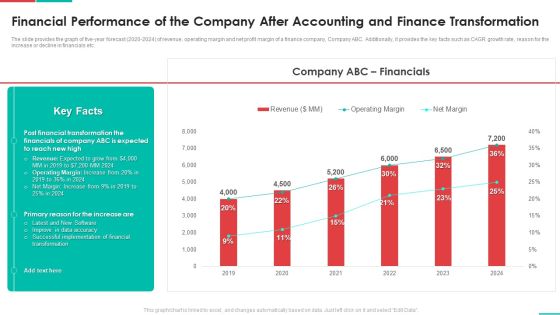
Roadmap For Financial Accounting Transformation Financial Performance Of The Company After Accounting Elements PDF
The slide provides the graph of five-year forecast 2020-2024 of revenue, operating margin and net profit margin of a finance company, Company ABC. Additionally, it provides the key facts such as CAGR growth rate, reason for the increase or decline in financials etc. Deliver and pitch your topic in the best possible manner with this roadmap for financial accounting transformation financial performance of the company after accounting elements pdf. Use them to share invaluable insights on implementation, financial, data accuracy, revenue and impress your audience. This template can be altered and modified as per your expectations. So, grab it now.

Creditors Dashboard For Enterprise Financial Debt Restructuring Brochure PDF
This slide showcases dashboard for accounts payable that can help company to keep track of outstanding payments of each creditor before indulging into process of enterprise finance debt restructuring. Its key elements are creditors days, payments due age summary, top 5 creditors and total invoices vs paid invoice. Deliver an awe inspiring pitch with this creative Creditors Dashboard For Enterprise Financial Debt Restructuring Brochure PDF bundle. Topics like Creditors Dashboard For Enterprise Financial Debt Restructuring can be discussed with this completely editable template. It is available for immediate download depending on the needs and requirements of the user.
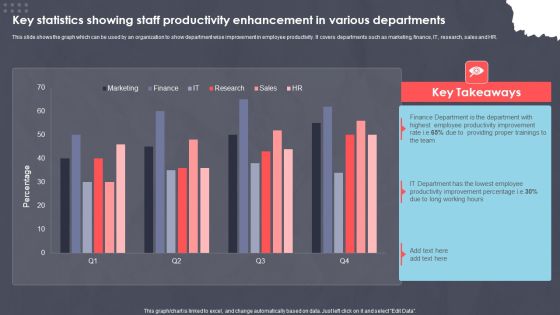
Key Statistics Showing Staff Productivity Enhancement In Various Departments Ppt PowerPoint Presentation Slides Portrait PDF
This slide shows the graph which can be used by an organization to show department wise improvement in employee productivity. It covers departments such as marketing, finance, IT, research, sales and HR. Pitch your topic with ease and precision using this Key Statistics Showing Staff Productivity Enhancement In Various Departments Ppt PowerPoint Presentation Slides Portrait PDF. This layout presents information on XXXXXXXXXXXXXXXXXXXXXXXXX. It is also available for immediate download and adjustment. So, changes can be made in the color, design, graphics or any other component to create a unique layout.

Line Comparison Graph For Yearly Liquidity Ratio Analysis Comparison Topics PDF
This slide showcases liquidity ratios graph that can help in identifying cash richness and financial position of organization. It showcases comparison for last 6 years and it key components are current ratio, quick ratio and cash ratio. Showcasing this set of slides titled Line Comparison Graph For Yearly Liquidity Ratio Analysis Comparison Topics PDF. The topics addressed in these templates are Term Financing, Cash Shortage, Cash Ratio. All the content presented in this PPT design is completely editable. Download it and make adjustments in color, background, font etc. as per your unique business setting.

Organization Financial Team Summary With Key Performance Indicators Clipart PDF
This slide represents a report prepared by the finance team showing the financial position of the organization with the help of key performance indicators. It demonstrates data related to current working capital, cash conversion cycle and vendor payment error rate of the company. Pitch your topic with ease and precision using this Organization Financial Team Summary With Key Performance Indicators Clipart PDF. This layout presents information on Current Working Capital, Cash Conversion Cycle. It is also available for immediate download and adjustment. So, changes can be made in the color, design, graphics or any other component to create a unique layout.

Team Productivity Assessment And Measurement Scorecard Introduction PDF
Following slide demonstrates scorecard for group performance utilized by organizations to address workforce redundancies and maximize team productivity. The slide provides data regarding team members, department, scorecard criteria, rating scale, departmental weighted average and remarks. Showcasing this set of slides titled Team Productivity Assessment And Measurement Scorecard Introduction PDF. The topics addressed in these templates are Finance And Accounting, Training And Development. All the content presented in this PPT design is completely editable. Download it and make adjustments in color, background, font etc. as per your unique business setting.
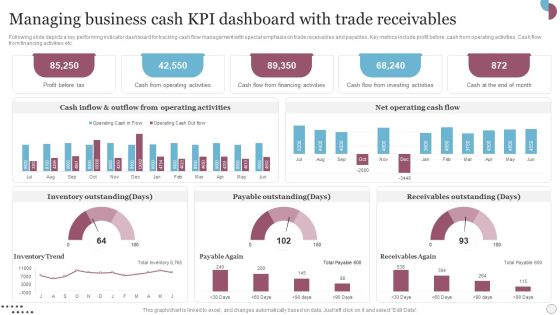
Managing Business Cash Kpi Dashboard With Trade Receivables Slides PDF
Following slide depicts a key performing indicator dashboard for tracking cash flow management with special emphasis on trade receivables and payables. Key metrics include profit before, cash from operating activities, Cash flow from financing activities etc. Showcasing this set of slides titled Managing Business Cash Kpi Dashboard With Trade Receivables Slides PDF. The topics addressed in these templates are Inventory Outstanding, Payable Outstanding, Receivables Outstanding. All the content presented in this PPT design is completely editable. Download it and make adjustments in color, background, font etc. as per your unique business setting.

Monthly Financials Metrics With Revenue And Gross Profit Professional PDF
This slide displays P and L variance analysis to closely monitor key financial parameters of the company. It includes details about sales, discounts allowed, freight income, customer finance charges, etc. Showcasing this set of slides titled Monthly Financials Metrics With Revenue And Gross Profit Professional PDF. The topics addressed in these templates are Amount, Current Month, Profit. All the content presented in this PPT design is completely editable. Download it and make adjustments in color, background, font etc. as per your unique business setting.
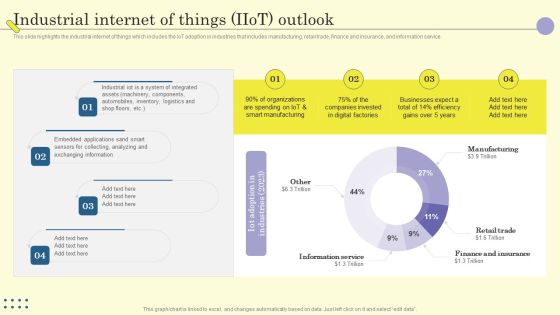
Internet Of Things In Manufacturing Sector Industrial Internet Of Things Iiot Outlook Professional PDF
This slide highlights the industrial internet of things which includes the IoT adoption in industries that includes manufacturing, retail trade, finance and insurance, and information service. Find a pre designed and impeccable Internet Of Things In Manufacturing Sector Industrial Internet Of Things Iiot Outlook Professional PDF. The templates can ace your presentation without additional effort. You can download these easy to edit presentation templates to make your presentation stand out from others. So, what are you waiting for Download the template from Slidegeeks today and give a unique touch to your presentation.

Key Statistics Associated With Bookkeeping Automation Demonstration PDF
The following slide highlights accounting automation statistics to improve efficiency and productivity. It includes components such as top automated services used for accounting firms, firms undertaking cloud-based finance and accounting software according to size, major accounting firms in the USA etc. Pitch your topic with ease and precision using this Key Statistics Associated With Bookkeeping Automation Demonstration PDF. This layout presents information on Key Statistics Associated, Bookkeeping Automation. It is also available for immediate download and adjustment. So, changes can be made in the color, design, graphics or any other component to create a unique layout.

Organization Hierarchy Structure Flow Chart Slides PDF
This slide consists of the basic organization structure depicting the structure in the form of flow chart . Key elements covered are top level personnel consisting of SEO, CFO, directors and departments such as marketing, administration, sales, finance, production etc. Presenting Organization Hierarchy Structure Flow Chart Slides PDF to dispense important information. This template comprises one stages. It also presents valuable insights into the topics including Marketing, Business Department, Administration. This is a completely customizable PowerPoint theme that can be put to use immediately. So, download it and address the topic impactfully.

Smart Home Security Solutions Company Profile Executive Leadership And Management Team Themes PDF
This slide highlights the security company leadership and management team which includes president and CEO, executive vice president of finance, EVP home security, chief administration officer. This is a Smart Home Security Solutions Company Profile Executive Leadership And Management Team Themes PDF template with various stages. Focus and dispense information on five stages using this creative set, that comes with editable features. It contains large content boxes to add your information on topics like Executive Leadership Management, Team Business Security, Financial Management Services. You can also showcase facts, figures, and other relevant content using this PPT layout. Grab it now.

Blue Signs Of Dollar Around A House PowerPoint Templates Ppt Backgrounds For Slides 0113
We present our Blue Signs Of Dollar Around A House PowerPoint Templates PPT Backgrounds For Slides 0113.Download and present our Signs PowerPoint Templates because Our PowerPoint Templates and Slides will let you Hit the target. Go the full distance with ease and elan. Use our Circle charts PowerPoint Templates because Our PowerPoint Templates and Slides will give good value for money. They also have respect for the value of your time. Download our Success PowerPoint Templates because You canTake a leap off the starting blocks with our PowerPoint Templates and Slides. They will put you ahead of the competition in quick time. Download our Finance PowerPoint Templates because Our PowerPoint Templates and Slides will provide you a launch platform. Give a lift off to your ideas and send them into orbit. Use our Future PowerPoint Templates because Our PowerPoint Templates and Slides will provide you a launch platform. Give a lift off to your ideas and send them into orbit.Use these PowerPoint slides for presentations relating to Dollar symbol around a house, signs, circle charts, success, future, finance. The prominent colors used in the PowerPoint template are White, Blue, Black. The feedback we get is that our Blue Signs Of Dollar Around A House PowerPoint Templates PPT Backgrounds For Slides 0113 will make the presenter successul in his career/life. PowerPoint presentation experts tell us our charts PowerPoint templates and PPT Slides will make the presenter look like a pro even if they are not computer savvy. Presenters tell us our Blue Signs Of Dollar Around A House PowerPoint Templates PPT Backgrounds For Slides 0113 will help them to explain complicated concepts. PowerPoint presentation experts tell us our signs PowerPoint templates and PPT Slides help you meet deadlines which are an element of today's workplace. Just browse and pick the slides that appeal to your intuitive senses. The feedback we get is that our Blue Signs Of Dollar Around A House PowerPoint Templates PPT Backgrounds For Slides 0113 will impress their bosses and teams. Use our circle PowerPoint templates and PPT Slides will make the presenter look like a pro even if they are not computer savvy.
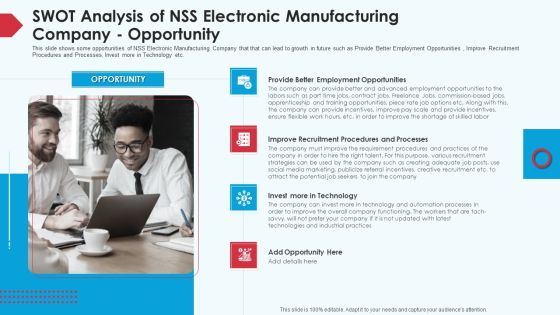
Skill Shortage In A Production Firm Case Study Solution SWOT Analysis Of NSS Electronic Manufacturing Company Opportunity Designs PDF
This slide shows some opportunities of NSS Electronic Manufacturing Company that that can lead to growth in future such as Provide Better Employment Opportunities , Improve Recruitment Procedures and Processes, Invest more in Technology etc. This is a skill shortage in a production firm case study solution SWOT analysis of NSS electronic manufacturing company opportunity designs pdf template with various stages. Focus and dispense information on four stages using this creative set, that comes with editable features. It contains large content boxes to add your information on topics like opportunity, recruitment procedures and processes, technology. You can also showcase facts, figures, and other relevant content using this PPT layout. Grab it now.

Addressing Leadership Training And Development Program Packages One Pager Sample Example Document
This slide provides information regarding leadership development training packages with details in context to package suitability, benefits, outcome and price. Presenting you an exemplary Addressing Leadership Training And Development Program Packages One Pager Sample Example Document. Our one-pager comprises all the must-have essentials of an inclusive document. You can edit it with ease, as its layout is completely editable. With such freedom, you can tweak its design and other elements to your requirements. Download this Addressing Leadership Training And Development Program Packages One Pager Sample Example Document brilliant piece now.

Business Process Outsourcing Company Profile Our Business Clients Template PDF
This slide highlights the clients of call center company. It covers the major companies such as amazon, standard chartered bank, Airbnb, airtel, Walmart and fortis. Presenting Business Process Outsourcing Company Profile Our Business Clients Template PDF to provide visual cues and insights. Share and navigate important information on one stages that need your due attention. This template can be used to pitch topics like Technical Service, Omni Channel, Order Management. In addtion, this PPT design contains high resolution images, graphics, etc, that are easily editable and available for immediate download.

BPO Call Center Company Profile Our Business Clients Topics PDF
This slide highlights the clients of call center company. It covers the major companies such as amazon, standard chartered bank, Airbnb, airtel, Walmart and fortis.Presenting BPO Call Center Company Profile Our Business Clients Topics PDF to provide visual cues and insights. Share and navigate important information on one stage that need your due attention. This template can be used to pitch topics like Assistance Related, Account Related, Order Management. In addtion, this PPT design contains high resolution images, graphics, etc, that are easily editable and available for immediate download.

6 Different Views On The Issue Ppt Slides Diagrams Template
We present our 6 Different Views on the issue ppt slides diagrams template.Download our Finance PowerPoint Templates because this diagram helps you to harness the opportunities, celebrate your performance till date and focus on greater growth and expansion in coming years. Use our Business PowerPoint Templates because like the famed William Tell, they put aside all emotions and concentrate on the target. Use our Circle Charts PowerPoint Templates because it is a step by step process with levels rising at every stage. Use our Circle Charts PowerPoint Templates because it builds on your foundation or prepares for change ahead to enhance the future. Download and present our Arrows PowerPoint Templates because this diagram has the unique ability to drive home your ideas and show how they mesh to guarantee success.Use these PowerPoint slides for presentations relating to 3d, Arrow, Background, Black, Blank, Blue, Business, Chart, Circle, Circular, Curving, Eps10, Financial, Flow, Graphic, Gray, Icon, Illustration, Isometric, Perspective, Process, Recycle, Round, Shape, Silver, Six, Spinning, Step, Transparency, Vector. The prominent colors used in the PowerPoint template are Yellow, Green, Blue. Presenters tell us our 6 Different Views on the issue ppt slides diagrams template are Versatile. We assure you our Black PowerPoint templates and PPT Slides will make you look like a winner. The feedback we get is that our 6 Different Views on the issue ppt slides diagrams template are Appealing. The feedback we get is that our Blank PowerPoint templates and PPT Slides are Dazzling. The feedback we get is that our 6 Different Views on the issue ppt slides diagrams template are readymade to fit into any presentation structure. Professionals tell us our Blank PowerPoint templates and PPT Slides are designed to make your presentations professional.
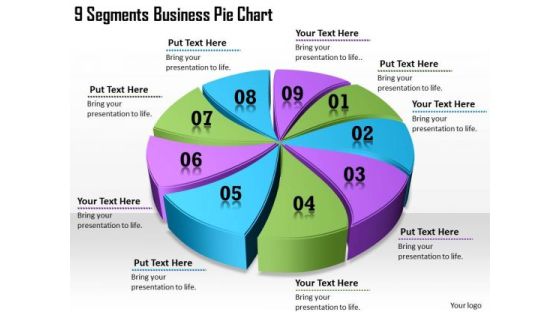
Timeline Ppt Template 9 Segments Business Pie Chart
Our Timeline Ppt Template 9 Segments Business Pie Chart Powerpoint Templates Leave No One In Doubt. Provide A Certainty To Your Views.
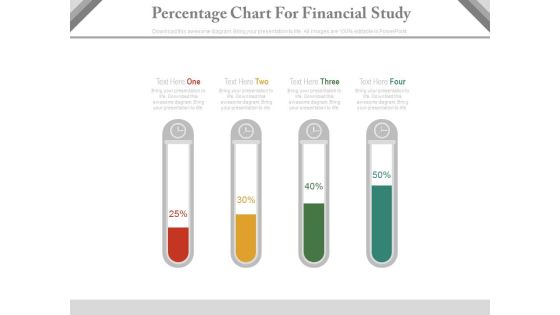
Test Tubes Percentage Chart For Financial Analysis Powerpoint Slides
This PPT slide contains test tubes percentage chart. You may download this PowerPoint template for financial analysis in your presentations. Make outstanding business presentation with this template.
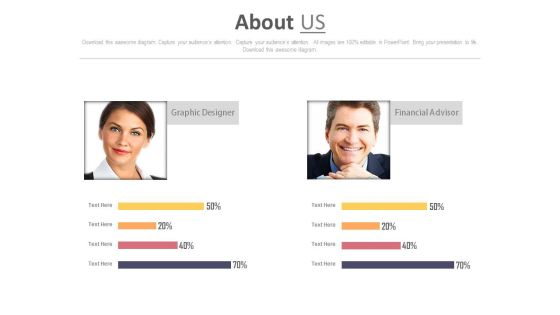
Graphic Designer And Financial Advisor Skill Assessment Chart Powerpoint Slides
The PowerPoint template has been designed with graphic designer and financial advisor skill assessment chart. Use this about us page to tell the story of your company.

Pie Charts For Pareto Analysis Powerpoint Slide Backgrounds
This is a pie charts for pareto analysis powerpoint slide backgrounds. This is a two stage process. The stages in this process are reasons, complaints.

Competitive Analysis Scatter Chart Ppt PowerPoint Presentation Samples
This is a competitive analysis scatter chart ppt powerpoint presentation samples. This is a six stage process. The stages in this process are competitive, analysis, business, marketing, management.

Stock Chart Ppt PowerPoint Presentation Infographic Template Clipart Images
This is a stock chart ppt powerpoint presentation infographic template clipart images. This is a five stage process. The stages in this process are high, volume, low, close.

Stock Chart Ppt PowerPoint Presentation Summary Background Designs
This is a stock chart ppt powerpoint presentation summary background designs. This is a five stage process. The stages in this process are high, volume, low.
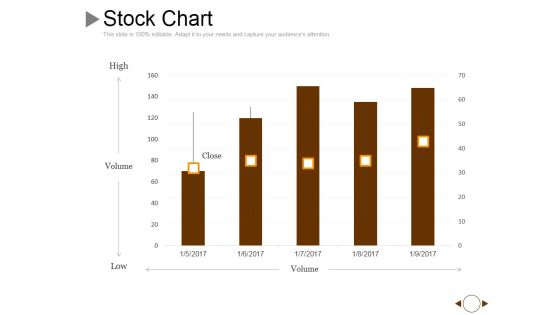
Stock Chart Ppt PowerPoint Presentation Gallery Graphics Example
This is a stock chart ppt powerpoint presentation gallery graphics example. This is a five stage process. The stages in this process are volume, high, low, close.
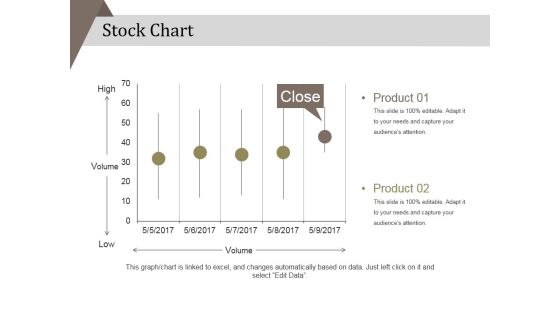
Stock Chart Ppt PowerPoint Presentation Portfolio Background Designs
This is a stock chart ppt powerpoint presentation portfolio background designs. This is a five stage process. The stages in this process are product, high, low .

High Low Close Chart Ppt PowerPoint Presentation Infographics Templates
This is a high low close chart ppt powerpoint presentation infographics templates. This is a nine stage process. The stages in this process are high, volume, low, close.
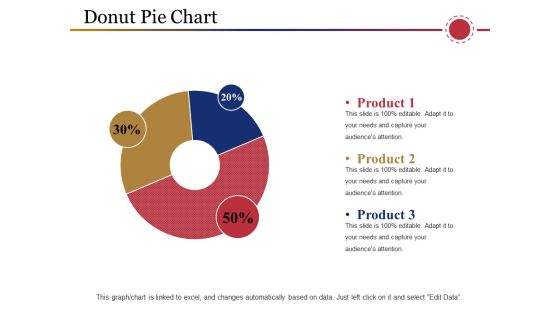
Donut Pie Chart Ppt PowerPoint Presentation Show Ideas
This is a donut pie chart ppt powerpoint presentation show ideas. This is a three stage process. The stages in this process are product, business, process, percentage, management.
Donut Chart Ppt PowerPoint Presentation Icon Example Topics
This is a donut chart ppt powerpoint presentation icon example topics. This is a six stage process. The stages in this process are management, process, business, percentage.
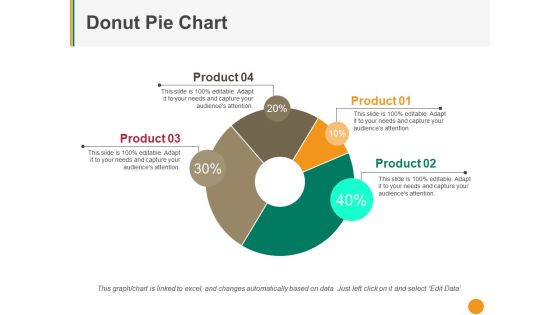
Donut Pie Chart Ppt PowerPoint Presentation Pictures Background
This is a donut pie chart ppt powerpoint presentation pictures background. This is a four stage process. The stages in this process are product, percentage, business, management, process.

Donut Pie Chart Ppt PowerPoint Presentation Inspiration Templates
This is a donut pie chart ppt powerpoint presentation inspiration templates. This is a four stage process. The stages in this process are icon, percentage, business, marketing, management.

Donut Pie Chart Ppt PowerPoint Presentation Slides Outfit
This is a donut pie chart ppt powerpoint presentation slides outfit. This is a three stage process. The stages in this process are product, percentage, business, process, management.
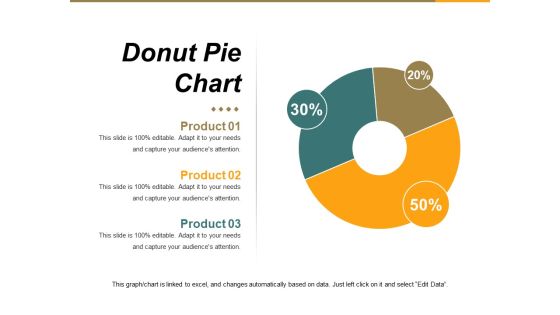
Donut Pie Chart Ppt PowerPoint Presentation Portfolio Background
This is a donut pie chart ppt powerpoint presentation portfolio background. This is a three stage process. The stages in this process are percentage, business, marketing, process.

Line Chart Ppt PowerPoint Presentation Inspiration Slide Download
This is a line chart ppt powerpoint presentation inspiration slide download. This is a two stage process. The stages in this process are product, in millions, business, marketing.
Scatter Chart Ppt PowerPoint Presentation Icon Background Images
This is a scatter chart ppt powerpoint presentation icon background images. This is a one stage process. The stages in this process are percentage, product, business, marketing, management.

Column Chart Ppt PowerPoint Presentation Infographics Graphics Template
This is a column chart ppt powerpoint presentation infographics graphics template. This is a two stage process. The stages in this process are percentage, product, business, management, marketing.

Scatter Bubble Chart Ppt PowerPoint Presentation Inspiration Demonstration
This is a scatter bubble chart ppt powerpoint presentation inspiration demonstration. This is a two stage process. The stages in this process are percentage, product, business, management, marketing.

Clustered Column Chart Ppt PowerPoint Presentation Ideas Picture
This is a clustered column chart ppt powerpoint presentation ideas picture. This is a three stage process. The stages in this process are percentage, product, management, marketing.

Stacked Column Chart Ppt PowerPoint Presentation Professional Diagrams
This is a stacked column chart ppt powerpoint presentation professional diagrams. This is a three stage process. The stages in this process are percentage, product, management, marketing.

Stacked Column Chart Ppt PowerPoint Presentation Slides Files
This is a stacked column chart ppt powerpoint presentation slides files. This is a three stage process. The stages in this process are percentage, product, business, marketing.

Global Automotive Industry Research And Analysis COVID 19 Impact On Global Automotive And Shared Mobility Industry Professional PDF
This slide covers the adverse effects of Covid 19 on the worldwide automobile and shared mobility industry. It includes various types of impacts such as economics, regulatory policy, technology, consumer, etc. Create an editable Global Automotive Industry Research And Analysis COVID 19 Impact On Global Automotive And Shared Mobility Industry Professional PDF that communicates your idea and engages your audience. Whether you are presenting a business or an educational presentation, pre designed presentation templates help save time. Global Automotive Industry Research And Analysis COVID 19 Impact On Global Automotive And Shared Mobility Industry Professional PDF is highly customizable and very easy to edit, covering many different styles from creative to business presentations. Slidegeeks has creative team members who have crafted amazing templates. So, go and get them without any delay.

COVID 19 Impact On Global Automobile And Shared Mobility Industry Guidelines PDF
This slide covers the adverse effects of Covid-19 on the worldwide automobile and shared mobility industry. It includes various types of impacts such as economics, regulatory policy, technology, consumer, etc. This slide covers the adverse effects of Covid-19 on worldwide auto motor sales based on region. It includes details such as sales in 2019, 2020, percentage change, etc. Do you have an important presentation coming up. Are you looking for something that will make your presentation stand out from the rest Look no further than COVID 19 Impact On Global Automobile And Shared Mobility Industry Guidelines PDF. With our professional designs, you can trust that your presentation will pop and make delivering it a smooth process. And with Slidegeeks, you can trust that your presentation will be unique and memorable. So why wait. Grab COVID 19 Impact On Global Automobile And Shared Mobility Industry Guidelines PDF today and make your presentation stand out from the rest.

Business Circular Chart PowerPoint Templates Marketing Home Selling Process Ppt Slides
Business Circular Chart PowerPoint Templates Marketing home selling process PPT Slides-This Marketing Home Selling Diagram summarizes the selling process. It maps all the steps involved in a home sale and their relationships to each other-Business Circular Chart PowerPoint Templates Marketing home selling process PPT Slides-This template can be used for presentations relating to Banners, Business, Buy, Communicate, Communicated, Communicating, Concepts, Conceptual, Display, Displayed, Estate, Home, House, Interested, Interest, Loan, Market, Notice, Over-White, Pend, Pending, Pole, Possible, Post, Posted,Posting, Process, Purchase, Real, Realestate, Realtor, Realty, Residence, Sale, Sell, Showing, Sign, Sold, Success
Business Charts PowerPoint Templates Graduation Celebration Smiley Emoticon
Business Charts PowerPoint templates graduation celebration smiley emoticon-This PowerPoint Diagram Shows the Different types of Graduation smileys celebrating their completion of degree. It expresses achievement, attainment, close, conclusion, consummation, culmination, curtains, dispatch, end, expiration, finalization, finis, finish, fruition, fulfillment, hips, integration, perfection, realization.-Business Charts PowerPoint templates graduation celebration smiley emoticon
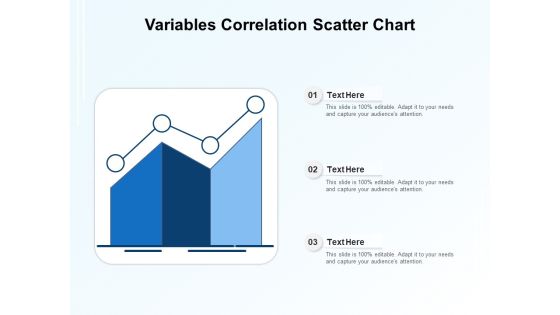
Variables Correlation Scatter Chart Ppt PowerPoint Presentation Model Smartart PDF
Presenting variables correlation scatter chart ppt powerpoint presentation model smartart pdf to dispense important information. This template comprises three stages. It also presents valuable insights into the topics including variables correlation scatter chart. This is a completely customizable PowerPoint theme that can be put to use immediately. So, download it and address the topic impactfully.

Business Objective Presentation Chart Of Provenance Data Download PDF
Presenting business objective presentation chart of provenance data download pdf to dispense important information. This template comprises five stages. It also presents valuable insights into the topics including business objective presentation chart of provenance data. This is a completely customizable PowerPoint theme that can be put to use immediately. So, download it and address the topic impactfully.

Statistical Data Analysis Chart Of Collected Data Formats PDF
Presenting statistical data analysis chart of collected data formats pdf to dispense important information. This template comprises four stages. It also presents valuable insights into the topics including statistical data analysis chart of collected data. This is a completely customizable PowerPoint theme that can be put to use immediately. So, download it and address the topic impactfully.

Bar Chart Icon For Financial Ratios Comparison Elements PDF
Presenting bar chart icon for financial ratios comparison elements pdf to dispense important information. This template comprises four stages. It also presents valuable insights into the topics including bar chart icon for financial ratios comparison. This is a completely customizable PowerPoint theme that can be put to use immediately. So, download it and address the topic impactfully.

Chart Comparison Icon For Financial Ratios Template PDF
Persuade your audience using this chart comparison icon for financial ratios template pdf. This PPT design covers three stages, thus making it a great tool to use. It also caters to a variety of topics including chart comparison icon for financial ratios. Download this PPT design now to present a convincing pitch that not only emphasizes the topic but also showcases your presentation skills.

Scrum Techniques Deployed Agile Members It Comparative Assessment Of Software Scrum Tools Themes PDF
This slide provides information regarding comparative assessment of software scrum tools by addressing them on various parameters such as demo version, price. Deliver an awe inspiring pitch with this creative scrum techniques deployed agile members it comparative assessment of software scrum tools themes pdf bundle. Topics like product, demo version, visualization can be discussed with this completely editable template. It is available for immediate download depending on the needs and requirements of the user.
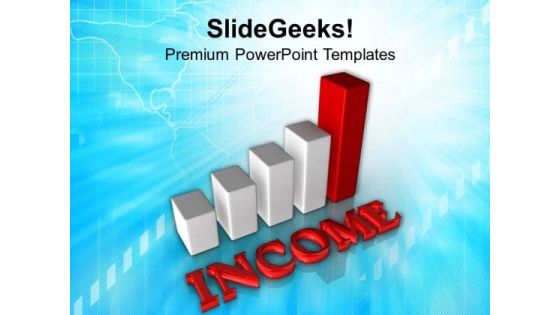
Income Growth Bar Chart PowerPoint Templates Ppt Backgrounds For Slides 0513
Edit your work with our Income Growth Bar Chart PowerPoint Templates PPT Backgrounds For Slides. They will help you give the final form. Be your own editor with our Business PowerPoint Templates. Align your thoughts as per your wishes. Be the drummer with our Success PowerPoint Templates. Let your thoughts create the beat.

Growing Values Of Property Bar Chart PowerPoint Templates Ppt Backgrounds For Slides 0513
Be the dramatist with our Growing Values Of Property Bar Chart PowerPoint Templates PPT Backgrounds For Slides 0513. Script out the play of words. Put our Business PowerPoint Templates into the draw. Your thoughts will win the lottery. Add some dramatization to your thoughts. Our Success PowerPoint Templates make useful props.

Business Chart Bar Graph PowerPoint Templates Ppt Backgrounds For Slides 0513
Doll up your thoughts with our Business Chart Bar Graph PowerPoint Templates PPT Backgrounds For Slides. They will make a pretty picture. They say a dog is man's best friend. Our Marketing PowerPoint Templates come a close second. Establish the dominance of your ideas. Our ArrowsPowerPoint Templates will put them on top.


 Continue with Email
 Sign up for an account
 Home
Home