Cost Plan

PowerPoint Themes Teamwork Circular Chart Ppt Designs
PowerPoint Themes Teamwork circular chart PPT Designs-The Circle of Life - a concept emmbedded in our minds and hence easy to comprehend. Life and Business is made up of processes comprising stages that flow from one to another. An excellent graphic to attract the attention of and understanding by your audience to improve earnings.-These amazing PowerPoint pre-designed slides and PowerPoint templates have been carefully created by our team of experts to help you impress your audience. Our stunning collection of Powerpoint slides are 100% editable and can easily fit in any PowerPoint presentations. By using these animations and graphics in PowerPoint and you can easily make professional presentations. Any text can be entered at any point in the PowerPoint template or slide. Just DOWNLOAD our awesome PowerPoint templates and you are ready to go.

Voc Chart For Customer Feedback Powerpoint Slide Show
This is a voc chart for customer feedback powerpoint slide show. This is a three stage process. The stages in this process are i want my pizza when you said it would be here, pizza delivered on the on time as promised to customer, timeliness, i want the pizza that i ordered, im not going to pay a lot for this pizza, accuracy, verbatim, need, requirement, i want my delivery person to be friendly, pizza delivery person is polite, complaints, im not going to pay a lot for this pizza, price is equal to or less than all other pizza providers, price.

5 Year Selling Forecasts Conversion Rate Chart Microsoft PDF
This slide covers forecast for sales conversion rates. It includes elements such as units in pipeline, pipeline growth rate, sales conversion rate, annual units sold, price per unit, forecast on revenue generation, etc. Pitch your topic with ease and precision using this 5 Year Selling Forecasts Conversion Rate Chart Microsoft PDF. This layout presents information on Conversion Rate, Price Per Unit, Growth Rate. It is also available for immediate download and adjustment. So, changes can be made in the color, design, graphics or any other component to create a unique layout.

Architecture Of Hadoop Framework Background PDF
This slide represents the architecture of Hadoop, including its various components and elements such as the master node and its members, slave node, along with its features.Deliver an awe inspiring pitch with this creative Architecture Of Hadoop Framework Background PDF bundle. Topics like Resource Manager, Node Manager, Computations Processing can be discussed with this completely editable template. It is available for immediate download depending on the needs and requirements of the user.
Donut Pie Chart Ppt PowerPoint Presentation Icon Background Designs
This is a donut pie chart ppt powerpoint presentation icon background designs. This is a four stage process. The stages in this process are product, percentage, finance, donut, business.

Donut Pie Chart Ppt PowerPoint Presentation Professional Example File
This is a donut pie chart ppt powerpoint presentation professional example file. This is a four stage process. The stages in this process are percentage, finance, donut, business, process.

Column Chart Ppt PowerPoint Presentation Layouts Graphics Example
This is a column chart ppt powerpoint presentation layouts graphics example. This is a two stage process. The stages in this process are product, year, bar graph, business, finance.

Donut Pie Chart Ppt PowerPoint Presentation Visual Aids Model
This is a donut pie chart ppt powerpoint presentation visual aids model. This is a four stage process. The stages in this process are product, percentage, finance, donut, business.

Donut Pie Chart Ppt PowerPoint Presentation Pictures Layout Ideas
This is a donut pie chart ppt powerpoint presentation pictures layout ideas. This is a four stage process. The stages in this process are percentage, finance, donut, business, product.
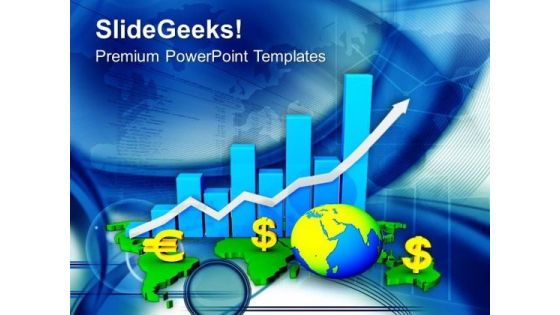
Global Business Economy And Growth PowerPoint Templates Ppt Backgrounds For Slides 0413
We present our Global Business Economy And Growth PowerPoint Templates PPT Backgrounds For Slides 0413.Use our Finance PowerPoint Templates because They will Put your wonderful verbal artistry on display. Our PowerPoint Templates and Slides will provide you the necessary glam and glitter. Download our Arrows PowerPoint Templates because You can Give birth to your ideas with our PowerPoint Templates and Slides. See them grow big and strong in record time. Download and present our Business PowerPoint Templates because It will get your audience in sync. Download and present our Global PowerPoint Templates because Our PowerPoint Templates and Slides will give good value for money. They also have respect for the value of your time. Download our Marketing PowerPoint Templates because You should Press the right buttons with our PowerPoint Templates and Slides. They will take your ideas down the perfect channel.Use these PowerPoint slides for presentations relating to Business graph global with arrow, marketing, finance, business, global, arrows. The prominent colors used in the PowerPoint template are Green, Blue, Yellow.
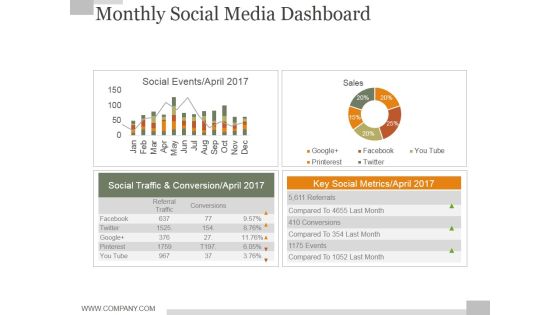
Monthly Social Media Dashboard Ppt PowerPoint Presentation Background Designs
This is a monthly social media dashboard ppt powerpoint presentation background designs. This is a four stage process. The stages in this process are business, finance, marketing, strategy, analysis, success.

Cycle Time By Month Ppt PowerPoint Presentation Guidelines
This is a cycle time by month ppt powerpoint presentation guidelines. This is a twelve stage process. The stages in this process are business, strategy, marketing, process, arrow, finance, bar graph.
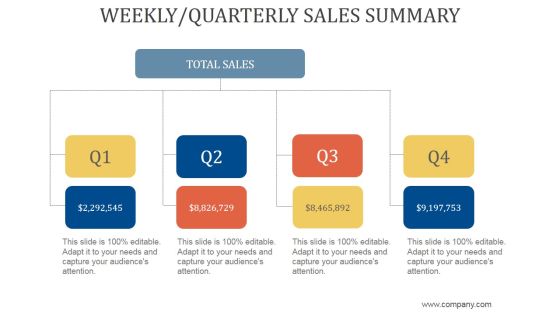
Weekly Quarterly Sales Summary Ppt PowerPoint Presentation Show
This is a weekly quarterly sales summary ppt powerpoint presentation show. This is a four stage process. The stages in this process are business, strategy, marketing, analysis, finance, arrow.

Current Quarter Portfolio Ppt PowerPoint Presentation Slide Download
This is a current quarter portfolio ppt powerpoint presentation slide download. This is a seven stage process. The stages in this process are business, strategy, marketing, analysis, finance, icons.

Selection Of The Optimal Portfolio Ppt PowerPoint Presentation Templates
This is a selection of the optimal portfolio ppt powerpoint presentation templates. This is a three stage process. The stages in this process are business, strategy, marketing, analysis, finance.

Key Driver Analytics Template Ppt PowerPoint Presentation Examples
This is a key driver analytics template ppt powerpoint presentation examples. This is a four stage process. The stages in this process are business, strategy, marketing, analysis, success, finance.

Measurement Of Portfolio Analysis Ppt PowerPoint Presentation Inspiration
This is a measurement of portfolio analysis ppt powerpoint presentation inspiration. This is a seven stage process. The stages in this process are business, strategy, marketing, analysis, success, finance.
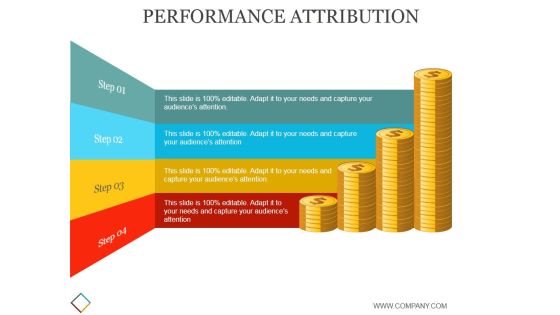
Performance Attribution Template 2 Ppt PowerPoint Presentation Backgrounds
This is a performance attribution template 2 ppt powerpoint presentation backgrounds. This is a four stage process. The stages in this process are business, strategy, marketing, analysis, currency, finance.

Portfolio Selection Allocation Template 1 Ppt PowerPoint Presentation Rules
This is a portfolio selection allocation template 1 ppt powerpoint presentation rules. This is a six stage process. The stages in this process are business, strategy, marketing, analysis, finance.
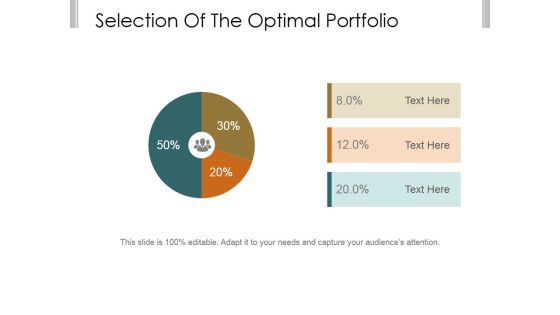
Selection Of The Optimal Portfolio Template 2 Ppt PowerPoint Presentation Background Image
This is a selection of the optimal portfolio template 2 ppt powerpoint presentation background image. This is a three stage process. The stages in this process are business, strategy, marketing, analysis, finance.

Big Data Opportunities And Challenges Template 2 Ppt PowerPoint Presentation Summary
This is a big data opportunities and challenges template 2 ppt powerpoint presentation summary. This is a three stage process. The stages in this process are business, donut, marketing, finance, strategy, analysis, success.
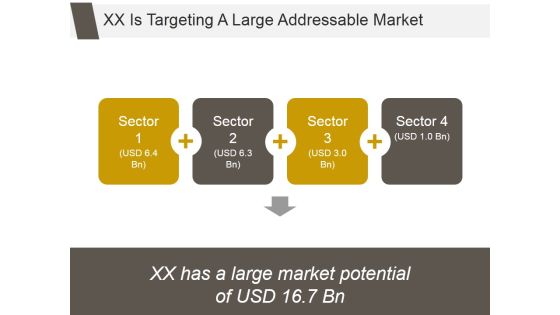
Xx Is Targeting A Large Addressable Market Ppt PowerPoint Presentation Background Images
This is a xx is targeting a large addressable market ppt powerpoint presentation background images. This is a four stage process. The stages in this process are business, strategy, analysis, marketing, finance.

Brand Performance Dashboard Template 2 Ppt PowerPoint Presentation Gallery
This is a brand performance dashboard template 2 ppt powerpoint presentation gallery. This is a two stage process. The stages in this process are business, finance, performance, location, strategy, success.

Crm Dashboard Top Customers Ppt PowerPoint Presentation Styles Designs
This is a crm dashboard top customers ppt powerpoint presentation styles designs. This is a ten stage process. The stages in this process are business, customer, finance, bar graph, marketing, strategy, analysis.

Competency Rating Template 2 Ppt PowerPoint Presentation Summary Templates
This is a competency rating template 2 ppt powerpoint presentation summary templates. This is a eight stage process. The stages in this process are business, finance, marketing, strategy, analysis.
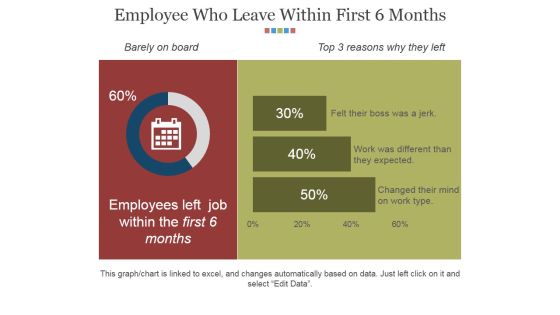
Employee Who Leave Within First 6 Months Ppt PowerPoint Presentation Gallery Grid
This is a employee who leave within first 6 months ppt powerpoint presentation gallery grid. This is a two stage process. The stages in this process are business, finance, marketing, strategy, analysis.

Bar Graph Ppt PowerPoint Presentation Icon Clipart Images
This is a bar graph ppt powerpoint presentation icon clipart images. This is a three stage process. The stages in this process are bar graph, finance, marketing, strategy, analysis.
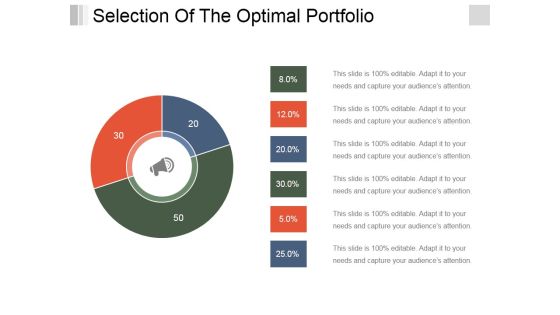
Selection Of The Optimal Portfolio Template 1 Ppt PowerPoint Presentation Summary Outfit
This is a selection of the optimal portfolio template 1 ppt powerpoint presentation summary outfit. This is a three stage process. The stages in this process are business, finance, management, marketing, strategy, process.

Assets And Revenue Financial Summary Ppt PowerPoint Presentation Icon Picture
This is a assets and revenue financial summary ppt powerpoint presentation icon picture. This is a six stage process. The stages in this process are business, strategy, marketing, finance, analysis.

Market Expansion And Growth Editable World Map Ppt PowerPoint Presentation Portfolio Format Ideas
This is a market expansion and growth editable world map ppt powerpoint presentation portfolio format ideas. This is a five stage process. The stages in this process are business, strategy, marketing, analysis, finance, location.

Current Sources Of Revenue Ppt PowerPoint Presentation Gallery Information
This is a current sources of revenue ppt powerpoint presentation gallery information. This is a five stage process. The stages in this process are business, strategy, marketing, analysis, finance, icons.

Dashboard Ppt PowerPoint Presentation Infographic Template Graphics Design
This is a dashboard ppt powerpoint presentation infographic template graphics design. This is a three stage process. The stages in this process are business, strategy, marketing, analysis, finance, dashboard.

Business Model Template 2 Ppt PowerPoint Presentation Icon Grid
This is a business model template 2 ppt powerpoint presentation icon grid. This is a three stage process. The stages in this process are business, marketing, management, finance, strategy.

Financial Projections Balance Sheet Ppt PowerPoint Presentation Visual Aids Example File
This is a financial projections balance sheet ppt powerpoint presentation visual aids example file. This is a one stage process. The stages in this process are business, strategy, analysis, pretention, finance.

Financial Projections Income Statement Ppt PowerPoint Presentation Portfolio Layouts
This is a financial projections income statement ppt powerpoint presentation portfolio layouts. This is a one stage process. The stages in this process are business, strategy, analysis, pretention, finance, table.

Bar Graph Ppt PowerPoint Presentation Infographics Slide Download
This is a bar graph ppt powerpoint presentation infographics slide download. This is a four stage process. The stages in this process are bar graph, finance, marketing, strategy, analysis.
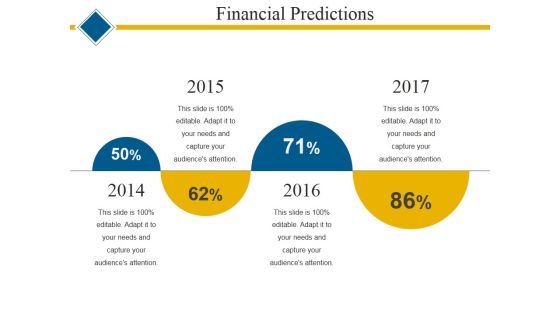
Financial Predictions Template 2 Ppt PowerPoint Presentation Show Example
This is a financial predictions template 2 ppt powerpoint presentation show example. This is a four stage process. The stages in this process are business, finance, marketing, analysis, strategy.
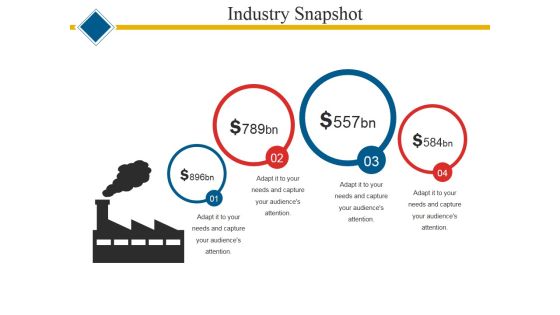
Industry Snapshot Template 1 Ppt PowerPoint Presentation Professional Templates
This is a industry snapshot template 1 ppt powerpoint presentation professional templates. This is a four stage process. The stages in this process are business, finance, marketing, strategy, analysis.

Case Study Ppt PowerPoint Presentation Infographics Maker
This is a case study ppt powerpoint presentation infographics maker. This is a three stage process. The stages in this process are business, case study, finance, marketing, strategy, success.
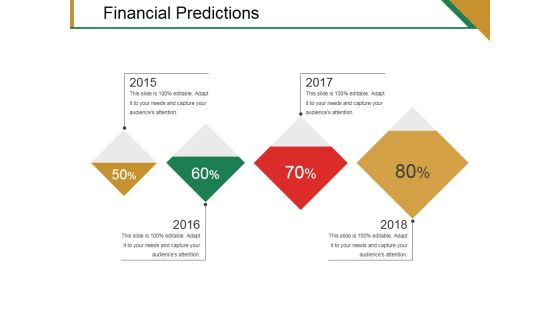
Financial Predictions Template 1 Ppt PowerPoint Presentation Infographic Template Themes
This is a financial predictions template 1 ppt powerpoint presentation infographic template themes. This is a four stage process. The stages in this process are business, finance, marketing, strategy, analysis, success.

Internal Analysis Template 5 Ppt PowerPoint Presentation File Inspiration
This is a internal analysis template 5 ppt powerpoint presentation file inspiration. This is a four stage process. The stages in this process are internal analysis, finance, marketing, strategy, business.

Financial Projection Graph Template 1 Ppt PowerPoint Presentation Professional Example Introduction
This is a financial projection graph template 1 ppt powerpoint presentation professional example introduction. This is a three stage process. The stages in this process are business, bar graph, finance, marketing, strategy, analysis.

Earning Per Share Ppt PowerPoint Presentation Slides Smartart
This is a earning per share ppt powerpoint presentation slides smartart. This is a five stage process. The stages in this process are earning per share, finance, marketing, strategy, business.
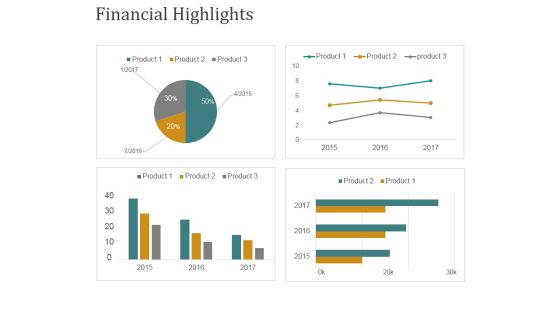
Financial Highlights Template 2 Ppt PowerPoint Presentation Ideas Pictures
This is a financial highlights template 2 ppt powerpoint presentation ideas pictures. This is a four stage process. The stages in this process are business, finance, marketing, strategy, management.

Principles For Judging The Alternatives Ppt PowerPoint Presentation Layouts Graphic Tips
This is a principles for judging the alternatives ppt powerpoint presentation layouts graphic tips. This is a two stage process. The stages in this process are business, finance, marketing, strategy, analysis.

Pareto Analysis Template 2 Ppt PowerPoint Presentation File Guide
This is a pareto analysis template 2 ppt powerpoint presentation file guide. This is a twelve stage process. The stages in this process are finance, analysis, business, strategy, marketing.
Key Evaluation Metrics Ppt PowerPoint Presentation Layouts Icons
This is a key evaluation metrics ppt powerpoint presentation layouts icons. This is a five stage process. The stages in this process are business, icons, marketing, strategy, finance, analysis.

Portfolio Selection Allocation Template 1 Ppt PowerPoint Presentation Infographic Template Guidelines
This is a portfolio selection allocation template 1 ppt powerpoint presentation infographic template guidelines. This is a two stage process. The stages in this process are business, finance, marketing, strategy, comparison, success.
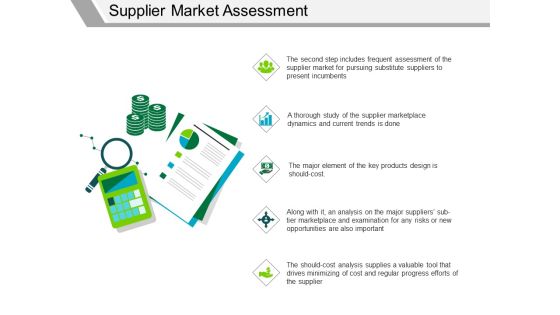
Supplier Market Assessment Ppt PowerPoint Presentation Visual Aids Slides
This is a supplier market assessment ppt powerpoint presentation visual aids slides. This is a five stage process. The stages in this process are finance, marketing, icons, business, strategy.

Brand Tracking Info Graphics Ppt PowerPoint Presentation Infographic Template Graphics Download
This is a brand tracking info graphics ppt powerpoint presentation infographic template graphics download. This is a four stage process. The stages in this process are business, marketing, finance, strategy, icons.

Brand Tracking Info Graphics Ppt PowerPoint Presentation Slides Inspiration
This is a brand tracking info graphics ppt powerpoint presentation slides inspiration. This is a four stage process. The stages in this process are finance, marketing, percentage, business, strategy.
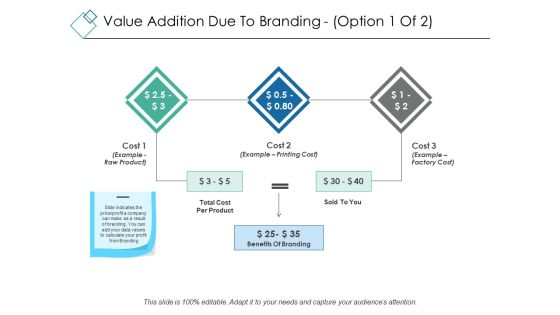
Value Addition Due To Branding Template 1 Ppt PowerPoint Presentation Portfolio Visual Aids
This is a value addition due to branding template 1 ppt powerpoint presentation portfolio visual aids. This is a three stage process. The stages in this process are business, marketing, finance, strategy benefits of branding.
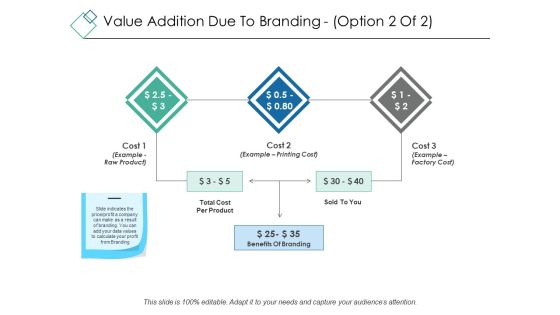
Value Addition Due To Branding Template 2 Ppt PowerPoint Presentation Ideas Sample
This is a value addition due to branding template 2 ppt powerpoint presentation ideas sample. This is a three stage process. The stages in this process are business, marketing, finance, strategy benefits of branding.
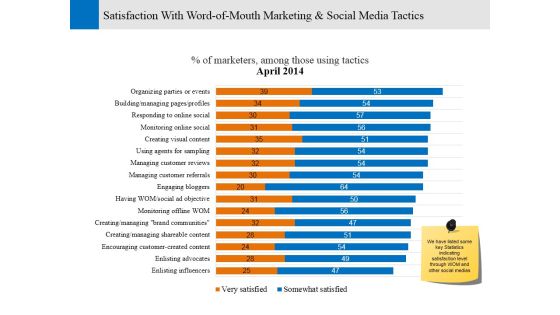
Satisfaction With Word Of Mouth Marketing And Social Media Tactics Ppt PowerPoint Presentation Styles Show
This is a satisfaction with word of mouth marketing and social media tactics ppt powerpoint presentation styles show. This is a two stage process. The stages in this process are business, marketing, finance, strategy, analysis.
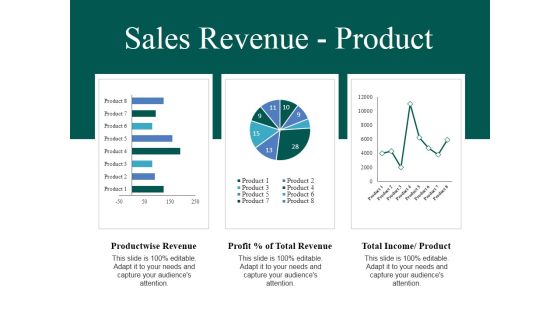
Sales Revenue Product Ppt PowerPoint Presentation Slides Clipart Images
This is a sales revenue product ppt powerpoint presentation slides clipart images. This is a three stage process. The stages in this process are business, finance, sales revenue, marketing, strategy.
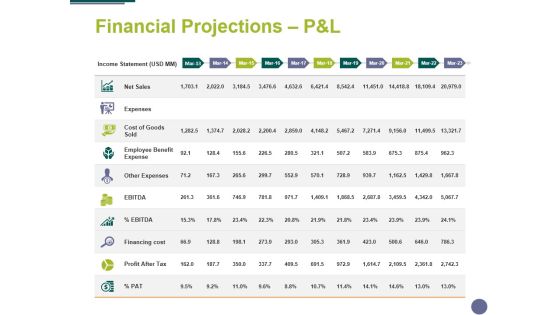
Financial Projections Panel Template 1 Ppt PowerPoint Presentation Summary Slide
This is a financial projections panel template 1 ppt powerpoint presentation summary slide. This is a one stage process. The stages in this process are analysis, finance, business, marketing, strategy.
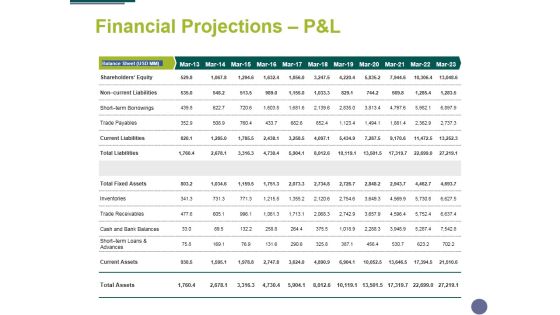
Financial Projections Panel Template 2 Ppt PowerPoint Presentation Infographics Inspiration
This is a financial projections panel template 2 ppt powerpoint presentation infographics inspiration. This is a one stage process. The stages in this process are analysis, finance, business, marketing, strategy.
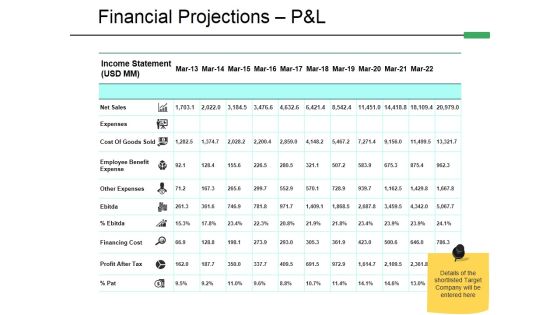
Financial Projections P And L Template 1 Ppt PowerPoint Presentation Show Ideas
This is a financial projections p and l template 1 ppt powerpoint presentation show ideas. This is a three stage process. The stages in this process are analysis, finance, strategy, business, marketing.

Financial Projections P And L Template 2 Ppt PowerPoint Presentation Portfolio Sample
This is a financial projections p and l template 2 ppt powerpoint presentation portfolio sample. This is a one stage process. The stages in this process are finance, strategy, business, marketing, analysis.

Key Financial Ratios Template 2 Ppt PowerPoint Presentation Professional Infographics
This is a key financial ratios template 2 ppt powerpoint presentation professional infographics. This is a four stage process. The stages in this process are analysis, finance, strategy, business, marketing.


 Continue
with Email
 Sign
up for an account

 Home
Home


