Cost Plan

Compliance Management Kpi Dashboard For Building And Construction Sector Inspiration PDF
This slide covers quality management KPI dashboard for construction industry. It involves success rate at site inspection, customer complaints, total rework cost, customer satisfaction ratio. Pitch your topic with ease and precision using this Compliance Management Kpi Dashboard For Building And Construction Sector Inspiration PDF. This layout presents information on Customer Complaints, Customer Satisfaction, Safety Meetings. It is also available for immediate download and adjustment. So, changes can be made in the color, design, graphics or any other component to create a unique layout.

Cios Guide To Optimize Addressing Present Challenges Faced By IT Department Sample PDF
This slide provides information regarding various challenges faced by IT department in terms of rise in IT infrastructure cost, reasons for rise in IT spending and reported financial losses due to increase in security threats. There are so many reasons you need a Cios Guide To Optimize Addressing Present Challenges Faced By IT Department Sample PDF. The first reason is you cant spend time making everything from scratch, Thus, Slidegeeks has made presentation templates for you too. You can easily download these templates from our website easily.

Impacts Of Rad Implementation On Business Rapid Application Building RAB Model Elements PDF
This slide represents the impacts of RAD implementation on the business, including costs, number of quality projects, risk mitigation, and percentage of satisfied customers.From laying roadmaps to briefing everything in detail, our templates are perfect for you. You can set the stage with your presentation slides. All you have to do is download these easy to edit and customizable templates. Impacts Of Rad Implementation On Business Rapid Application Building RAB Model Elements PDF will help you deliver an outstanding performance that everyone would remember and praise you for. Do download this presentation today.

Construction Project Instructions Playbook Essential Construction Activities Management Dashboard Graphics PDF
This slide provides information regarding essential construction activities management dashboard with details about site inspection, rework costs, safety meetings, etc. Crafting an eye catching presentation has never been more straightforward. Let your presentation shine with this tasteful yet straightforward Construction Project Instructions Playbook Essential Construction Activities Management Dashboard Graphics PDF template. It offers a minimalistic and classy look that is great for making a statement. The colors have been employed intelligently to add a bit of playfulness while still remaining professional. Construct the ideal Construction Project Instructions Playbook Essential Construction Activities Management Dashboard Graphics PDF that effortlessly grabs the attention of your audience Begin now and be certain to wow your customers.

Dashboard Of Employee Yearly Performance Review For Organization Mockup PDF
This slide shows the dashboard for reviewing the work performance of their employees over the years. It includes KPIs such as absenteeism, overtime hours, training costs, overall labor effectiveness. Showcasing this set of slides titled Dashboard Of Employee Yearly Performance Review For Organization Mockup PDF. The topics addressed in these templates are Dashboard Of Employee, Yearly Performance, Review For Organization. All the content presented in this PPT design is completely editable. Download it and make adjustments in color, background, font etc. as per your unique business setting.

Healthcare Management Overview Trends Stats And Operational Areas Dashboard To Evaluate The Hospital Operations Performance Pictures PDF
The following slide showcases dashboard which can be used by the healthcare professionals to measure the performance of operational department. The KPIs covered in the slide are total patients, operational cost, available staff per division etc. There are so many reasons you need a Healthcare Management Overview Trends Stats And Operational Areas Dashboard To Evaluate The Hospital Operations Performance Pictures PDF. The first reason is you can not spend time making everything from scratch, Thus, Slidegeeks has made presentation templates for you too. You can easily download these templates from our website easily.
Staff Awareness Playbook Determine Workforce Training Performance Tracking Dashboard Slides PDF
This slide provides information regarding workforce training performance tracking dashboard with training cost, number of participants, hours of training, etc. This Staff Awareness Playbook Determine Workforce Training Performance Tracking Dashboard Slides PDF from Slidegeeks makes it easy to present information on your topic with precision. It provides customization options, so you can make changes to the colors, design, graphics, or any other component to create a unique layout. It is also available for immediate download, so you can begin using it right away. Slidegeeks has done good research to ensure that you have everything you need to make your presentation stand out. Make a name out there for a brilliant performance.

Business Revenue And Client Retention Analytics Dashboard Brochure PDF
This slide shows dashboard of service department of firm to make business decisions using customer analytics and covers essential KPIs of customer. It includes request answered, revenue, support cost, customer satisfaction and retention, average time to solve issue. Showcasing this set of slides titled Business Revenue And Client Retention Analytics Dashboard Brochure PDF. The topics addressed in these templates are Customer Satisfaction, Customer Retention, Revenue. All the content presented in this PPT design is completely editable. Download it and make adjustments in color, background, font etc. as per your unique business setting.

Business Sales And Revenue Summary Dashboard Brochure PDF
This slide exhibits sales report dashboards that provides information of sales activities and performance in financial year. It includes elements such as average weekly sales revenue, customer acquisition cost, customer lifetime value and sales target. Pitch your topic with ease and precision using this Business Sales And Revenue Summary Dashboard Brochure PDF. This layout presents information on Average Revenue, Customer Lifetime, Customer Acquisition. It is also available for immediate download and adjustment. So, changes can be made in the color, design, graphics or any other component to create a unique layout.

Dashboard For Big Healthcare Data Analytics Graphics PDF
This slide showcase the dashboard for big data analytics in healthcare. It includes elements such as bed occupancy rate, patient turnover rate, efficiency and costs, missed and cancelled appointment rate. Showcasing this set of slides titled Dashboard For Big Healthcare Data Analytics Graphics PDF. The topics addressed in these templates are Satisfaction Service Indicators, Occupancy, Forecasted Patient Turnover. All the content presented in this PPT design is completely editable. Download it and make adjustments in color, background, font etc. as per your unique business setting.

Customer Service Delivery And Management Dashboard With Revenue Brochure PDF
The purpose of this slide is to monitor and evaluate service delivery KPIs to improve the customer support process. The major KPIs included are total requests, percentage of requests answered, total revenue, and support cost. Pitch your topic with ease and precision using this Customer Service Delivery And Management Dashboard With Revenue Brochure PDF. This layout presents information on Customer Service Delivery, Management Dashboard With Revenue. It is also available for immediate download and adjustment. So, changes can be made in the color, design, graphics or any other component to create a unique layout.
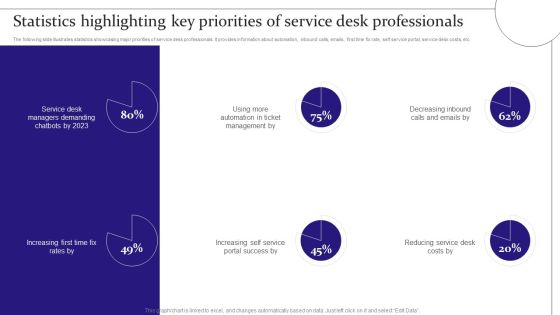
Digitalization Of Service Desk Statistics Highlighting Key Priorities Of Service Desk Professionals Ppt Gallery Grid PDF
The following slide illustrates statistics showcasing major priorities of service desk professionals. It provides information about automation, inbound calls, emails, first time fix rate, self service portal, service desk costs, etc. Take your projects to the next level with our ultimate collection of Digitalization Of Service Desk Statistics Highlighting Key Priorities Of Service Desk Professionals Ppt Gallery Grid PDF. Slidegeeks has designed a range of layouts that are perfect for representing task or activity duration, keeping track of all your deadlines at a glance. Tailor these designs to your exact needs and give them a truly corporate look with your own brand colors they will make your projects stand out from the rest.

Dashboard For Analyzing Brand Perception Building A Comprehensive Brand Elements PDF
This slide covers the dashboard for tracking brand reputation. It also includes metrics such as new customer lifetime value, customer acquisition cost, target met, above sales target, average weekly sales revenue, etc. Find a pre-designed and impeccable Dashboard For Analyzing Brand Perception Building A Comprehensive Brand Elements PDF. The templates can ace your presentation without additional effort. You can download these easy-to-edit presentation templates to make your presentation stand out from others. So, what are you waiting for Download the template from Slidegeeks today and give a unique touch to your presentation.

Safety Measurement Dashboard With Key Kpis And Severity Sample PDF
This slide represents the dashboard showing performance measurement analysis of safety team of an organization. It includes details related to incidents, critical incidents and its cost, severity, type of incident and their consequence. Showcasing this set of slides titled Safety Measurement Dashboard With Key Kpis And Severity Sample PDF. The topics addressed in these templates are Incidents, Critical Incidents, Day Since Last Incident. All the content presented in this PPT design is completely editable. Download it and make adjustments in color, background, font etc. as per your unique business setting.
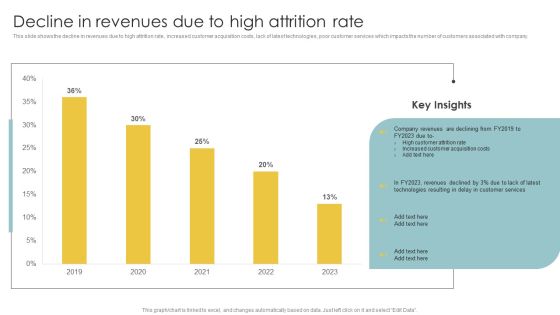
Implementing CRM To Optimize Decline In Revenues Due To High Attrition Rate Sample PDF
This slide shows the decline in revenues due to high attrition rate, increased customer acquisition costs, lack of latest technologies, poor customer services which impacts the number of customers associated with company. Want to ace your presentation in front of a live audience Our Implementing CRM To Optimize Decline In Revenues Due To High Attrition Rate Sample PDF can help you do that by engaging all the users towards you. Slidegeeks experts have put their efforts and expertise into creating these impeccable powerpoint presentations so that you can communicate your ideas clearly. Moreover, all the templates are customizable, and easy-to-edit and downloadable. Use these for both personal and commercial use.

Inventory Overview Dashboard In Supply Chain Management To Enhance Logistics Operations Summary PDF
This slide showcases the inventory management dashboard. It include KPIs such as inventory value, re-order products, restocking cost, inventory value by vendor, item name, last order date, warehouse, etc. Showcasing this set of slides titled Inventory Overview Dashboard In Supply Chain Management To Enhance Logistics Operations Summary PDF. The topics addressed in these templates are Inventory Overview Dashboard, Supply Chain Management, Enhance Logistics Operations. All the content presented in this PPT design is completely editable. Download it and make adjustments in color, background, font etc. as per your unique business setting.
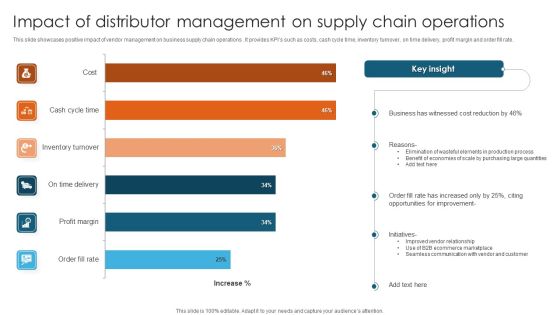
Impact Of Distributor Management On Supply Chain Operations Brochure PDF
This slide showcases positive impact of vendor management on business supply chain operations . It provides KPIs such as costs, cash cycle time, inventory turnover, on time delivery, profit margin and order fill rate.Showcasing this set of slides titled Impact Of Distributor Management On Supply Chain Operations Brochure PDF. The topics addressed in these templates are Business Witnessed, Elimination Wasteful, Opportunities Improvement. All the content presented in this PPT design is completely editable. Download it and make adjustments in color, background, font etc. as per your unique business setting.
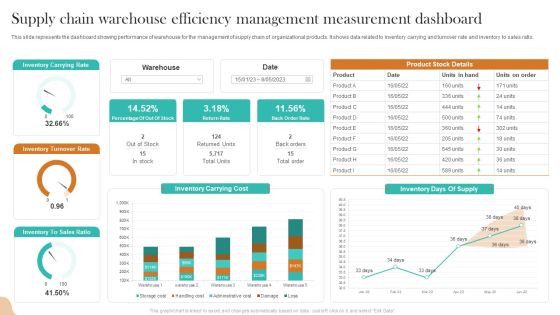
Supply Chain Warehouse Efficiency Management Measurement Dashboard Inspiration PDF
This slide represents the dashboard showing performance of warehouse for the management of supply chain of organizational products. It shows data related to inventory carrying and turnover rate and inventory to sales ratio. Pitch your topic with ease and precision using this Supply Chain Warehouse Efficiency Management Measurement Dashboard Inspiration PDF. This layout presents information on Inventory Carrying Rate, Inventory Turnover Rate, Inventory Carrying Cost. It is also available for immediate download and adjustment. So, changes can be made in the color, design, graphics or any other component to create a unique layout.
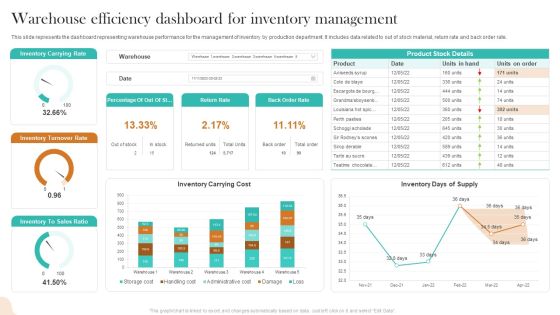
Warehouse Efficiency Dashboard For Inventory Management Infographics PDF
This slide represents the dashboard representing warehouse performance for the management of inventory by production department. It includes data related to out of stock material, return rate and back order rate. Showcasing this set of slides titled Warehouse Efficiency Dashboard For Inventory Management Infographics PDF. The topics addressed in these templates are Inventory Carrying Rate, Inventory Turnover Rate, Inventory Carrying Cost. All the content presented in this PPT design is completely editable. Download it and make adjustments in color, background, font etc. as per your unique business setting.

Inspecting Sales Optimization Areas Sales Analysis Dashboard To Measure Performance Demonstration PDF
This slide showcases a dashboard presenting various metrics to measure and analyze sales performance for revenue growth. It includes key components such as number of annual new customer, sales revenue, customer satisfaction, customer acquisition cost, product wise sales, month wise sales and sales comparison. From laying roadmaps to briefing everything in detail, our templates are perfect for you. You can set the stage with your presentation slides. All you have to do is download these easy-to-edit and customizable templates. Inspecting Sales Optimization Areas Sales Analysis Dashboard To Measure Performance Demonstration PDF will help you deliver an outstanding performance that everyone would remember and praise you for. Do download this presentation today.

Deployment Of Business Process Breakdown Of Operational Issues On The Basis Pictures PDF
This slide shows the operations issues within organization on the basis of level which includes skills management, workflows, manage productivity and cost, quality and risk, timely deliveries, etc. Find a pre-designed and impeccable Deployment Of Business Process Breakdown Of Operational Issues On The Basis Pictures PDF. The templates can ace your presentation without additional effort. You can download these easy-to-edit presentation templates to make your presentation stand out from others. So, what are you waiting for Download the template from Slidegeeks today and give a unique touch to your presentation.
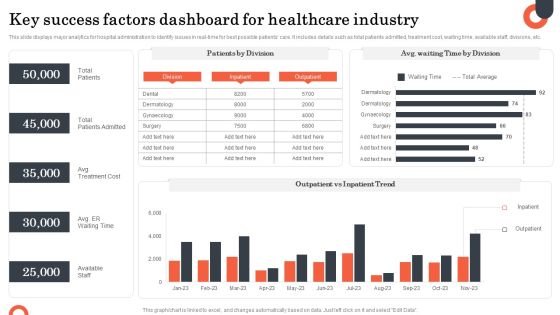
Key Success Factors Dashboard For Healthcare Industry Diagrams PDF
This slide displays major analytics for hospital administration to identify issues in real-time for best possible patients care. It includes details such as total patients admitted, treatment cost, waiting time, available staff, divisions, etc. Showcasing this set of slides titled Key Success Factors Dashboard For Healthcare Industry Diagrams PDF. The topics addressed in these templates are Success Factors, Total Patients, Total Patients Admitted, Available Staff. All the content presented in this PPT design is completely editable. Download it and make adjustments in color, background, font etc. as per your unique business setting.
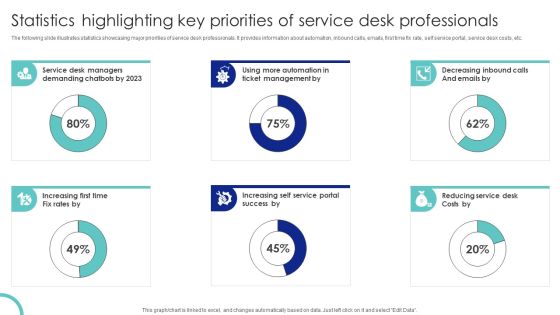
Statistics Highlighting Key Priorities Of Service Desk Professionals Ppt PowerPoint Presentation Diagram PDF
The following slide illustrates statistics showcasing major priorities of service desk professionals. It provides information about automation, inbound calls, emails, first time fix rate, self service portal, service desk costs, etc. If your project calls for a presentation, then Slidegeeks is your go to partner because we have professionally designed, easy to edit templates that are perfect for any presentation. After downloading, you can easily edit Statistics Highlighting Key Priorities Of Service Desk Professionals Ppt PowerPoint Presentation Diagram PDF and make the changes accordingly. You can rearrange slides or fill them with different images. Check out all the handy templates.

Global Statistics Highlighting Service Desk Scenario Pictures PDF
This slide global statistics highlighting service desk scenario. It provides information about service desk staff, recruitment costs, bad IT service, customer retention, IT product, IT service, etc. From laying roadmaps to briefing everything in detail, our templates are perfect for you. You can set the stage with your presentation slides. All you have to do is download these easy to edit and customizable templates. Global Statistics Highlighting Service Desk Scenario Pictures PDF will help you deliver an outstanding performance that everyone would remember and praise you for. Do download this presentation today.
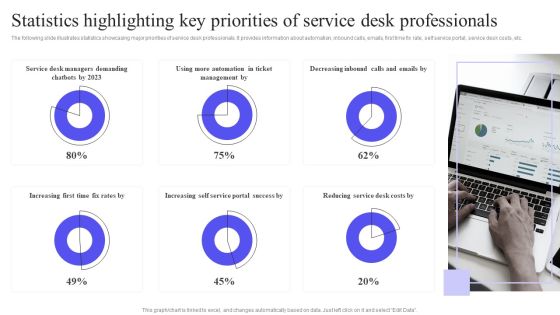
Statistics Highlighting Key Priorities Of Service Desk Professionals Graphics PDF
The following slide illustrates statistics showcasing major priorities of service desk professionals. It provides information about automation, inbound calls, emails, first time fix rate, self service portal, service desk costs, etc. If your project calls for a presentation, then Slidegeeks is your go to partner because we have professionally designed, easy to edit templates that are perfect for any presentation. After downloading, you can easily edit Statistics Highlighting Key Priorities Of Service Desk Professionals Graphics PDF and make the changes accordingly. You can rearrange slides or fill them with different images. Check out all the handy templates.
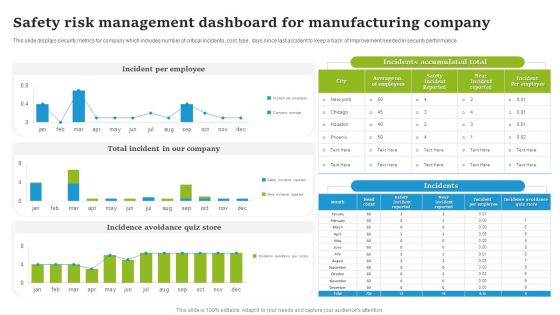
Safety Risk Management Dashboard For Manufacturing Company Introduction PDF
This slide displays security metrics for company which includes number of critical incidents, cost, type, days since last accident to keep a track of Improvement needed in security performance. Showcasing this set of slides titled Safety Risk Management Dashboard For Manufacturing Company Introduction PDF. The topics addressed in these templates are Incident Per Employee, Total Incident Our Company, Incidence Avoidance Quiz Store. All the content presented in this PPT design is completely editable. Download it and make adjustments in color, background, font etc. as per your unique business setting.
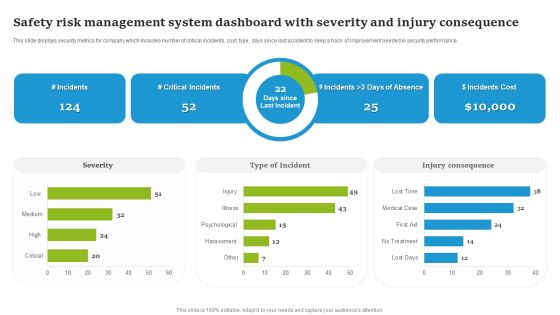
Safety Risk Management System Dashboard With Severity And Injury Consequence Clipart PDF
This slide displays security metrics for company which includes number of critical incidents, cost, type, days since last accident to keep a track of Improvement needed in security performance. Pitch your topic with ease and precision using this Safety Risk Management System Dashboard With Severity And Injury Consequence Clipart PDF. This layout presents information on Severity, Type Of Incident, Injury Consequence . It is also available for immediate download and adjustment. So, changes can be made in the color, design, graphics or any other component to create a unique layout.

Decline In Revenues Due To High Attrition Rate Ppt Professional Introduction PDF
This slide shows the decline in revenues due to high attrition rate, increased customer acquisition costs, lack of latest technologies, poor customer services which impacts the number of customers associated with company. Want to ace your presentation in front of a live audience Our Decline In Revenues Due To High Attrition Rate Ppt Professional Introduction PDF can help you do that by engaging all the users towards you.. Slidegeeks experts have put their efforts and expertise into creating these impeccable powerpoint presentations so that you can communicate your ideas clearly. Moreover, all the templates are customizable, and easy-to-edit and downloadable. Use these for both personal and commercial use.
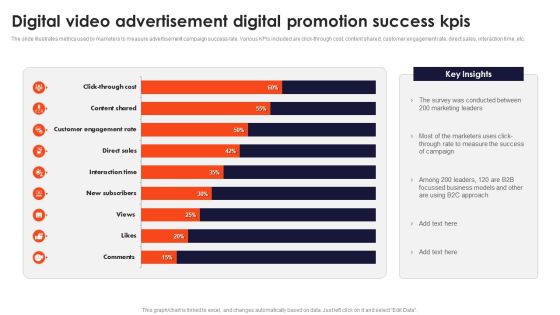
Digital Video Advertisement Digital Promotion Success Kpis Formats PDF
The slide illustrates metrics used by marketers to measure advertisement campaign success rate. Various KPIs included are click-through cost, content shared, customer engagement rate, direct sales, interaction time, etc. Showcasing this set of slides titled Digital Video Advertisement Digital Promotion Success Kpis Formats PDF. The topics addressed in these templates are Digital Video, Advertisement Digital, Promotion Success Kpis. All the content presented in this PPT design is completely editable. Download it and make adjustments in color, background, font etc. as per your unique business setting.

Data Monetization And Management Statistics Related To Power Of Data Diagrams PDF
This slide provides information about key statistics related to effective utilization of data that leads to annual increase in revenues, reduction in operational costs, better decision making. Find a pre-designed and impeccable Data Monetization And Management Statistics Related To Power Of Data Diagrams PDF. The templates can ace your presentation without additional effort. You can download these easy-to-edit presentation templates to make your presentation stand out from others. So, what are you waiting for Download the template from Slidegeeks today and give a unique touch to your presentation.

Managing Customer Attrition Decline In Revenues Due To High Attrition Rate Summary PDF
This slide shows the decline in revenues due to high attrition rate, increased customer acquisition costs, lack of latest technologies, poor customer services which impacts the number of customers associated with company. From laying roadmaps to briefing everything in detail, our templates are perfect for you. You can set the stage with your presentation slides. All you have to do is download these easy-to-edit and customizable templates. Managing Customer Attrition Decline In Revenues Due To High Attrition Rate Summary PDF will help you deliver an outstanding performance that everyone would remember and praise you for. Do download this presentation today.

Dashboard To Track Revenue After Global Expansion Ppt PowerPoint Presentation File Example PDF
This slide showcase dashboard that can help organization track revenue after global expansion. Its key components are average revenue per customer, customer acquisition cost, customer lifetime value and new customers acquired.Take your projects to the next level with our ultimate collection of Dashboard To Track Revenue After Global Expansion Ppt PowerPoint Presentation File Example PDF. Slidegeeks has designed a range of layouts that are perfect for representing task or activity duration, keeping track of all your deadlines at a glance. Tailor these designs to your exact needs and give them a truly corporate look with your own brand colors they all make your projects stand out from the rest.

Transport Management Dashboard For Logistics Company With Fleet Status Ideas PDF
This slide displays KPI dashboard to measure efficiency of transportation management in the company for optimizing its overall delivery time. It includes details about revenue, cost, shipments, profit by country, etc. Showcasing this set of slides titled Transport Management Dashboard For Logistics Company With Fleet Status Ideas PDF. The topics addressed in these templates are Logistics Company, Fleet Status. All the content presented in this PPT design is completely editable. Download it and make adjustments in color, background, font etc. as per your unique business setting.

Dashboard For Deploying HMS Portrait PDF
The following slide illustrates medical management dashboard about individuals admitted with their costs. It presents information related to patient satisfaction, available staff, etc. Pitch your topic with ease and precision using this Dashboard For Deploying Management System To Manage Hospital Software Inspiration PDF. This layout presents information on Patients By Division, Average Waiting Time, Patient Satisfaction. It is also available for immediate download and adjustment. So, changes can be made in the color, design, graphics or any other component to create a unique layout.
Key Challenges In Customers Segmentation Ppt PowerPoint Presentation File Icon PDF
This slides highlights key challenges faced by business during segmenting customers. It provides insights about challenges such as data management, data quality, emerging segmentation in business, selecting appropriate segments, keeping segments precise and cost. There are so many reasons you need a Key Challenges In Customers Segmentation Ppt PowerPoint Presentation File Icon PDF. The first reason is you can not spend time making everything from scratch, Thus, Slidegeeks has made presentation templates for you too. You can easily download these templates from our website easily.
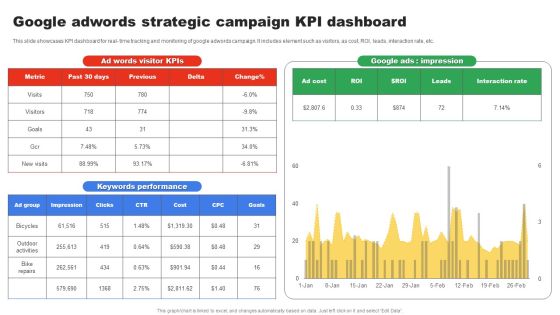
Google Adwords Strategic Campaign KPI Dashboard Topics PDF
This slide showcases KPI dashboard for real time tracking and monitoring of google adwords campaign. It includes element such as visitors, as cost, ROI, leads, interaction rate, etc. Showcasing this set of slides titled Google Adwords Strategic Campaign KPI Dashboard Topics PDF. The topics addressed in these templates are Keywords Performance, Google Ads Impression, Ad Words Visitor Kpis. All the content presented in this PPT design is completely editable. Download it and make adjustments in color, background, font etc. as per your unique business setting.

Latest Methodologies Of Construction Essential Construction Activities Management Dashboard Mockup PDF
This slide provides information regarding essential construction activities management dashboard with details about site inspection, rework costs, safety meetings, etc. From laying roadmaps to briefing everything in detail, our templates are perfect for you. You can set the stage with your presentation slides. All you have to do is download these easy-to-edit and customizable templates. Latest Methodologies Of Construction Essential Construction Activities Management Dashboard Mockup PDF will help you deliver an outstanding performance that everyone would remember and praise you for. Do download this presentation today.

Optimizing Production Process Smart Manufacturing Dashboard For Inventory Template PDF
This slide represents smart manufacturing dashboard for inventory management. It includes inventory carrying cost, inventory turnover, inventory to sales ratio etc. Slidegeeks is here to make your presentations a breeze with Optimizing Production Process Smart Manufacturing Dashboard For Inventory Template PDF With our easy-to-use and customizable templates, you can focus on delivering your ideas rather than worrying about formatting. With a variety of designs to choose from, youre sure to find one that suits your needs. And with animations and unique photos, illustrations, and fonts, you can make your presentation pop. So whether youre giving a sales pitch or presenting to the board, make sure to check out Slidegeeks first.

Organization Performance Strategic Evaluation Dashboard Ppt Slides Visual Aids PDF
This slide showcases dashboard to review business activities strategically for continual growth in company revenue and profits. It further includes KPIs such as sales, new consumers, actual and targets met, etc. Showcasing this set of slides titled Organization Performance Strategic Evaluation Dashboard Ppt Slides Visual Aids PDF. The topics addressed in these templates are Average Revenue Per Unit, Customer Lifetime Value, Customer Acquisition Cost. All the content presented in this PPT design is completely editable. Download it and make adjustments in color, background, font etc. as per your unique business setting.
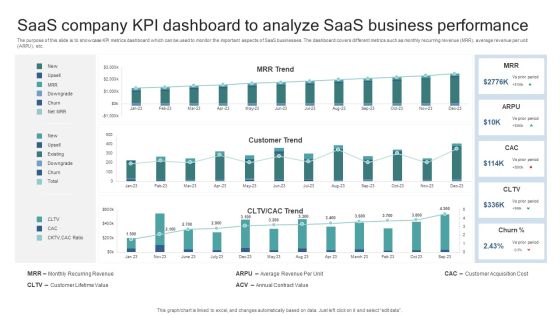
Saas Company KPI Dashboard To Analyze Saas Business Performance Elements PDF
The purpose of this slide is to showcase KPI metrics dashboard which can be used to monitor the important aspects of SaaS businesses. The dashboard covers different metrics such as monthly recurring revenue MRR, average revenue per unit ARPU, etc. Pitch your topic with ease and precision using this Saas Company KPI Dashboard To Analyze Saas Business Performance Elements PDF. This layout presents information on Monthly Recurring Revenue, Customer Lifetime Value, Average Revenue Per Unit, Annual Contract Value, Customer Acquisition Cost. It is also available for immediate download and adjustment. So, changes can be made in the color, design, graphics or any other component to create a unique layout.
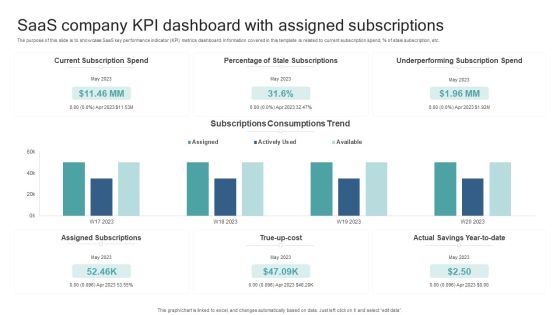
Saas Company KPI Dashboard With Assigned Subscriptions Formats PDF
The purpose of this slide is to showcase SaaS key performance indicator KPI metrics dashboard. Information covered in this template is related to current subscription spend, percent of stale subscription, etc. Pitch your topic with ease and precision using this Saas Company KPI Dashboard With Assigned Subscriptions Formats PDF. This layout presents information on Current Subscription Spend, Percentage Of Stale Subscriptions, True Up Cost, Underperforming Subscription Spend. It is also available for immediate download and adjustment. So, changes can be made in the color, design, graphics or any other component to create a unique layout.
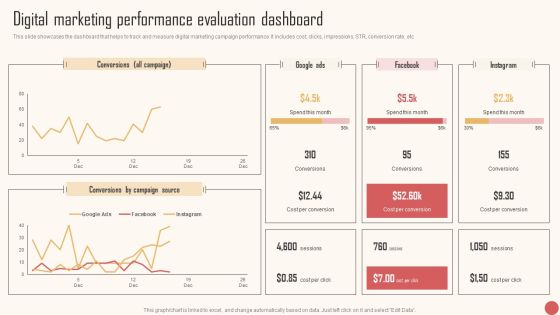
Digital Marketing Performance Evaluation Dashboard Microsoft PDF
This slide showcases the dashboard that helps to track and measure digital marketing campaign performance. It includes cost, clicks, impressions, STR, conversion rate, etc. Create an editable Digital Marketing Performance Evaluation Dashboard Microsoft PDF that communicates your idea and engages your audience. Whether you are presenting a business or an educational presentation, pre-designed presentation templates help save time. Digital Marketing Performance Evaluation Dashboard Microsoft PDF is highly customizable and very easy to edit, covering many different styles from creative to business presentations. Slidegeeks has creative team members who have crafted amazing templates. So, go and get them without any delay.

Dashboard To Analyze Healthcare Organization Data Summary PDF
This slide depicts the dashboard used for analyzing healthcare organization data. The purpose of this template is to provide details related to the patients, staffs and cost. It includes information related to the outpatient and inpatient trends, waiting time, etc. Showcasing this set of slides titled Dashboard To Analyze Healthcare Organization Data Summary PDF. The topics addressed in these templates are Patient Satisfaction, Average, Analyze Healthcare Organization Data. All the content presented in this PPT design is completely editable. Download it and make adjustments in color, background, font etc. as per your unique business setting.
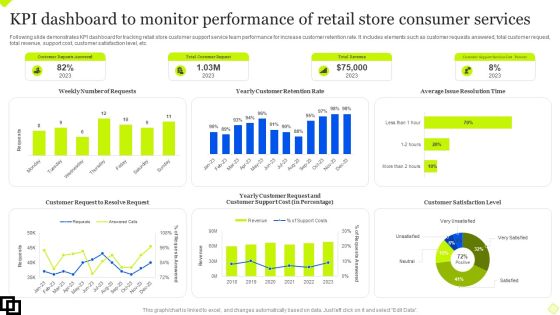
KPI Dashboard To Monitor Performance Of Retail Store Consumer Services Summary PDF
Following slide demonstrates KPI dashboard for tracking retail store customer support service team performance for increase customer retention rate. It includes elements such as customer requests answered, total customer request, total revenue, support cost, customer satisfaction level, etc. Showcasing this set of slides titled KPI Dashboard To Monitor Performance Of Retail Store Consumer Services Summary PDF. The topics addressed in these templates are Customer Request, Customer Retention Rate, Customer Satisfaction Level. All the content presented in this PPT design is completely editable. Download it and make adjustments in color, background, font etc. as per your unique business setting.

Merchant Performance Report With Rating And Status Diagrams PDF
The purpose of this slide is to measure the performance and effectiveness of vendors and suppliers who provides goods or services to the company. Certain metrics include quality, delivery, cost, local factors, and order count. Showcasing this set of slides titled Merchant Performance Report With Rating And Status Diagrams PDF. The topics addressed in these templates are Merchant Performance Report, Rating And Status. All the content presented in this PPT design is completely editable. Download it and make adjustments in color, background, font etc. as per your unique business setting.

Metric Dashboard To Track Supplier Diversity And Performance Designs PDF
This slide represents KPI dashboard for tracking supplier diversity in organization and measure performance. It provides information regarding organization spending cost, supplier count, diversity type, status etc. Pitch your topic with ease and precision using this Metric Dashboard To Track Supplier Diversity And Performance Designs PDF. This layout presents information on Diversity Type, Diversity Status, Diverse Supplier. It is also available for immediate download and adjustment. So, changes can be made in the color, design, graphics or any other component to create a unique layout.
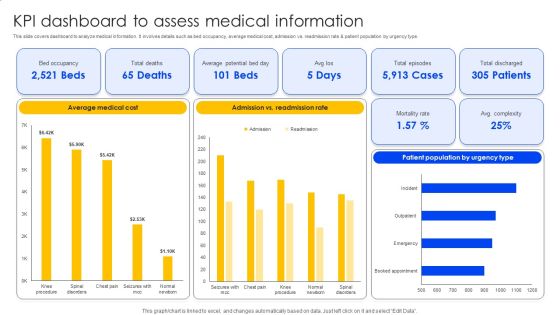
KPI Dashboard To Assess Medical Information Clipart PDF
This slide covers dashboard to analyze medical information. It involves details such as bed occupancy, average medical cost, admission vs. readmission rate and patient population by urgency type. Get a simple yet stunning designed KPI Dashboard To Assess Medical Information Clipart PDF. It is the best one to establish the tone in your meetings. It is an excellent way to make your presentations highly effective. So, download this PPT today from Slidegeeks and see the positive impacts. Our easy to edit KPI Dashboard To Assess Medical Information Clipart PDF can be your go to option for all upcoming conferences and meetings. So, what are you waiting for Grab this template today.

HR Scoreboard KPI To Measure Performance Inspiration PDF
The purpose of this slide is to analyze a wide range of HR metrics and parameters in order to evaluate desired strategic outcomes. The key metrics to measure include training effectiveness, acceptance ratio, absence rate etc. Showcasing this set of slides titled HR Scoreboard KPI To Measure Performance Inspiration PDF. The topics addressed in these templates are Training Effectiveness, Absence Rate, Absence Cost. All the content presented in this PPT design is completely editable. Download it and make adjustments in color, background, font etc. as per your unique business setting.

Business Intelligence Dashboard To Review Employee Performance Pictures PDF
The following slide showcases BI dashboard to drill down major aspects of personnel management for HR department. It includes information about absenteeism, training costs, overtime hours and overall labor effectiveness. Showcasing this set of slides titled Business Intelligence Dashboard To Review Employee Performance Pictures PDF. The topics addressed in these templates are Business Intelligence Dashboard, Review Employee Performance. All the content presented in this PPT design is completely editable. Download it and make adjustments in color, background, font etc. as per your unique business setting.

Connected Devices Network Device Power Management KPI Dashboard Template PDF
Following slide showcases IoT power monitoring dashboard for determining device inefficiency leading to increased cost. It includes elements such as average power usage by devices, hourly energy consumption, current and voltage. Showcasing this set of slides titled Connected Devices Network Device Power Management KPI Dashboard Template PDF. The topics addressed in these templates are Hourly Energy Consumption, Average Power Usage Service, Current. All the content presented in this PPT design is completely editable. Download it and make adjustments in color, background, font etc. as per your unique business setting.

Impact Of Product Corporate Diversification In Improving Business Performance Infographics PDF
This slide shows impact of product corporate diversification on business performance with various key performance indicators. It includes quality, productivity, profitability, market share, brand recognition etc. Showcasing this set of slides titled Impact Of Product Corporate Diversification In Improving Business Performance Infographics PDF. The topics addressed in these templates are Product Transportation Costs, Product Quality, Market Segments. All the content presented in this PPT design is completely editable. Download it and make adjustments in color, background, font etc. as per your unique business setting.

Employee Performance Management KPI Dashboard Structure PDF
The following slide depicts the overview of staff performance management system to achieve goals and evaluate business growth. It includes key elements such as absenteeism rate, overtime hours, training costs, labor effectiveness etc. Take your projects to the next level with our ultimate collection of Employee Performance Management KPI Dashboard Structure PDF. Slidegeeks has designed a range of layouts that are perfect for representing task or activity duration, keeping track of all your deadlines at a glance. Tailor these designs to your exact needs and give them a truly corporate look with your own brand colors they will make your projects stand out from the rest.

Guide To Healthcare Services Administration Dashboard To Evaluate The Hospital Operations Performance Infographics PDF
The following slide showcases dashboard which can be used by the healthcare professionals to measure the performance of operational department. The KPIs covered in the slide are total patients, operational cost, available staff per division etc. If your project calls for a presentation, then Slidegeeks is your go to partner because we have professionally designed, easy to edit templates that are perfect for any presentation. After downloading, you can easily edit Guide To Healthcare Services Administration Dashboard To Evaluate The Hospital Operations Performance Infographics PDF and make the changes accordingly. You can rearrange slides or fill them with different images. Check out all the handy templates
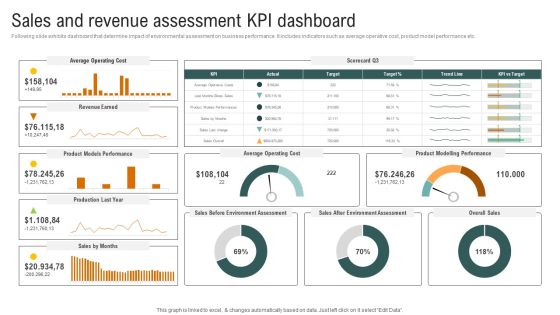
Sales And Revenue Assessment Kpi Dashboard Brochure PDF
Following slide exhibits dashboard that determine impact of environmental assessment on business performance. It includes indicators such as average operative cost, product model performance etc. If your project calls for a presentation, then Slidegeeks is your go-to partner because we have professionally designed, easy-to-edit templates that are perfect for any presentation. After downloading, you can easily edit Sales And Revenue Assessment Kpi Dashboard Brochure PDF and make the changes accordingly. You can rearrange slides or fill them with different images. Check out all the handy templates
KPI Dashboard For Tracking Financial Management Challenges Download PDF
Following slide demonstrates KPI dashboard for monitoring business cash flow management pain points to improve organisation financial performance. It includes elements such as quick ratio, current ration, annual cash balance, monthly cash balance, accounts receivable and payables, etc. Showcasing this set of slides titled KPI Dashboard For Tracking Financial Management Challenges Download PDF. The topics addressed in these templates are Monthly Cash Flow, Account Payable By Days, Annual Revenue, Annual Cost, Annual Net Profits. All the content presented in this PPT design is completely editable. Download it and make adjustments in color, background, font etc. as per your unique business setting.
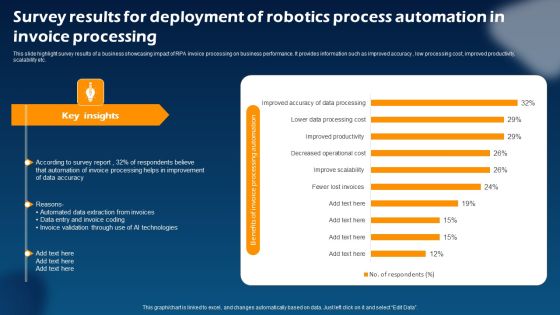
Survey Results For Deployment Of Robotics Process Automation In Invoice Processing Themes PDF
This slide highlight survey results of a business showcasing impact of RPA invoice processing on business performance. It provides information such as improved accuracy , low processing cost, improved productivity, scalability etc. Showcasing this set of slides titled Survey Results For Deployment Of Robotics Process Automation In Invoice Processing Themes PDF. The topics addressed in these templates are According Survey Report, Automated Data Extraction, Data Entry Invoice. All the content presented in this PPT design is completely editable. Download it and make adjustments in color, background, font etc. as per your unique business setting.

Bar Graph Ppt PowerPoint Presentation File Picture
This is a bar graph ppt powerpoint presentation file picture. This is a six stage process. The stages in this process are management, planning, marketing, business, strategy.
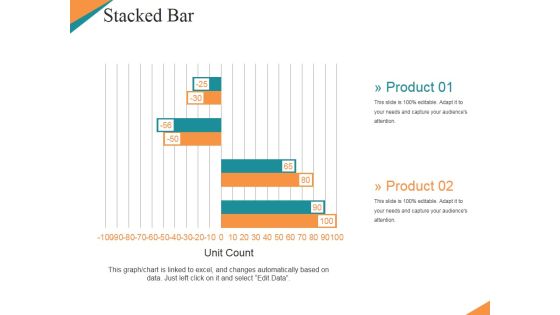
Stacked Bar Ppt PowerPoint Presentation Sample
This is a stacked bar ppt powerpoint presentation sample. This is a four stage process. The stages in this process are planning, management, strategy, marketing, business.

DSS Software Program Benefits Of Augmented Intelligence For Businesses Graphics PDF
This slide describes the benefits of augmented intelligence to make more informed and intelligent decisions quickly. It also includes cost-saving benefits, employee growth and development, a collaborative environment, time-saving, and virtual assistance. Present like a pro with DSS Software Program Benefits Of Augmented Intelligence For Businesses Graphics PDF Create beautiful presentations together with your team, using our easy-to-use presentation slides. Share your ideas in real-time and make changes on the fly by downloading our templates. So whether youre in the office, on the go, or in a remote location, you can stay in sync with your team and present your ideas with confidence. With Slidegeeks presentation got a whole lot easier. Grab these presentations today.

Product Data Insights Analysis Sheet Infographics PDF
The following slide depicts the annual performance of multiple products in terms of profit or loss to track whether they are doing well or not. The analysis sheet includes element such as cost, units, selling price, sales etc. Pitch your topic with ease and precision using this Product Data Insights Analysis Sheet Infographics PDF. This layout presents information on Unit Sold, Selling Price, Total Sales. It is also available for immediate download and adjustment. So, changes can be made in the color, design, graphics or any other component to create a unique layout.


 Continue with Email

 Home
Home


