Cost Improvement

Clustered Bar Risk Estimator Ppt PowerPoint Presentation Layouts Mockup
This is a clustered bar risk estimator ppt powerpoint presentation layouts mockup. This is a four stage process. The stages in this process are business, management, strategy, analysis, marketing.

Open High Low Close Risk Estimator Ppt PowerPoint Presentation Infographics Vector
This is a open high low close risk estimator ppt powerpoint presentation infographics vector. This is a five stage process. The stages in this process are business, management, strategy, analysis, marketing.
Quantitative Risk Analysis Risk Estimator Ppt PowerPoint Presentation Icon Designs
This is a quantitative risk analysis risk estimator ppt powerpoint presentation icon designs. This is a four stage process. The stages in this process are business, management, strategy, analysis, marketing.

Stacked Bar Risk Estimator Ppt PowerPoint Presentation Gallery Design Templates
This is a stacked bar risk estimator ppt powerpoint presentation gallery design templates. This is a four stage process. The stages in this process are business, management, strategy, analysis, marketing.
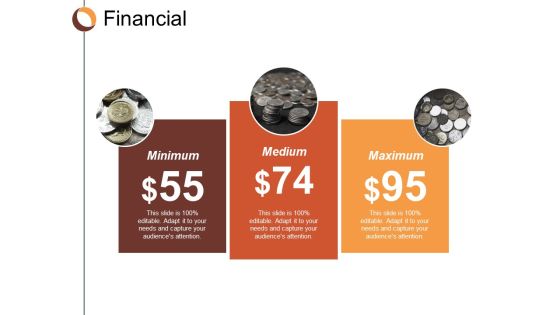
Financial Minimum Medium Maximum Ppt Powerpoint Presentation Infographics Introduction
This is a financial minimum medium maximum ppt powerpoint presentation infographics introduction. This is a three stage process. The stages in this process are financial, minimum, maximum, marketing, strategy.

Project Tasks Status Late On Time Early Completion Ppt PowerPoint Presentation Slides Design Ideas
This is a project tasks status late on time early completion ppt powerpoint presentation slides design ideas. This is a three stage process. The stages in this process are task completion, assignment completion, work completion.
Sample Employee Evaluation Form Ppt PowerPoint Presentation Pictures Deck Cpb
This is a sample employee evaluation form ppt powerpoint presentation pictures deck cpb. This is a three stage process. The stages in this process are sample employee evaluation form.
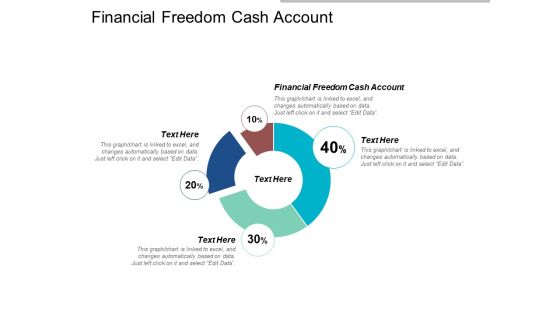
Financial Freedom Cash Account Ppt Powerpoint Presentation Infographics Topics Cpb
This is a financial freedom cash account ppt powerpoint presentation infographics topics cpb. This is a four stage process. The stages in this process are financial freedom cash account.
Saas Sale Paid Users Ppt PowerPoint Presentation Ideas Icon
This is a saas sale paid users ppt powerpoint presentation ideas icon. This is a four stage process. The stages in this process are website users, intent users, paid users, retained users, marketing.
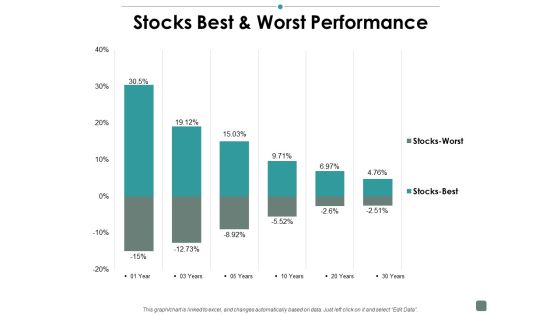
Stocks Best And Worst Performance Contribution Ppt PowerPoint Presentation Gallery Tips
This is a stocks best and worst performance contribution ppt powerpoint presentation gallery tips. This is a two stage process. The stages in this process are finanace, marketing, business, management, strategy.

Computer Screen With Cloud Icon Ppt Powerpoint Presentation Infographics Display
This is a computer screen with cloud icon ppt powerpoint presentation infographics display. This is a three stage process. The stages in this process are data visualization icon, data management icon.

Data Analysis Reports Under Magnifying Glass Ppt Powerpoint Presentation Summary Slideshow
This is a data analysis reports under magnifying glass ppt powerpoint presentation summary slideshow. This is a three stage process. The stages in this process are data visualization icon, data management icon.

Data Analytics Vector Icon Ppt Powerpoint Presentation Icon Designs
This is a data analytics vector icon ppt powerpoint presentation icon designs. This is a four stage process. The stages in this process are data visualization icon, data management icon.

Data Reports Visualization Vector Ppt Powerpoint Presentation Portfolio Grid
This is a data reports visualization vector ppt powerpoint presentation portfolio grid. This is a three stage process. The stages in this process are data visualization icon, data management icon.

Data Representation Vector Icon Ppt Powerpoint Presentation Infographic Template Example File
This is a data representation vector icon ppt powerpoint presentation infographic template example file. This is a four stage process. The stages in this process are data visualization icon, data management icon.
Human Eye Observation And Monitoring Icon Ppt Powerpoint Presentation Slides Background Designs
This is a human eye observation and monitoring icon ppt powerpoint presentation slides background designs. This is a three stage process. The stages in this process are data visualization icon, data management icon.
Personal Data Visualization On Computer Screen Ppt Powerpoint Presentation Infographics Vector
This is a personal data visualization on computer screen ppt powerpoint presentation infographics vector. This is a three stage process. The stages in this process are data visualization icon, data management icon.
Visual Analytics Vector Icon Ppt Powerpoint Presentation Infographics Show
This is a visual analytics vector icon ppt powerpoint presentation infographics show. This is a three stage process. The stages in this process are data visualization icon, data management icon.
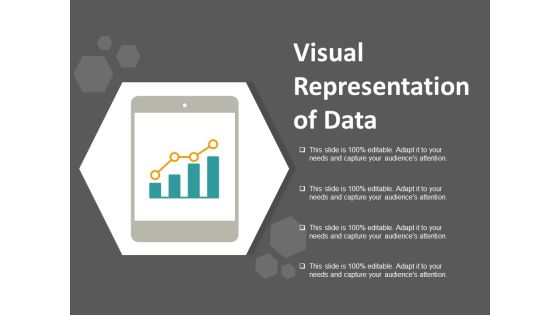
Visual Representation Of Data Ppt Powerpoint Presentation Model Images
This is a visual representation of data ppt powerpoint presentation model images. This is a four stage process. The stages in this process are data visualization icon, data management icon.

Clustered Bar Financial Ppt PowerPoint Presentation Gallery Designs Download
This is a clustered bar financial ppt powerpoint presentation gallery designs download. This is a three stage process. The stages in this process are percentage, product, business, management, marketing.

Cash Flow Working Capital Ppt Powerpoint Presentation Infographic Template Slides Cpb
This is a cash flow working capital ppt powerpoint presentation infographic template slides cpb. This is a five stage process. The stages in this process are cash flow working capital.

Employee Performance Measurement Kpi Ppt PowerPoint Presentation Inspiration Design Inspiration
This is a employee performance measurement kpi ppt powerpoint presentation inspiration design inspiration. This is a four stage process. The stages in this process are financial, business, management, marketing.

Employee Weekly Efficiency Dashboard Ppt PowerPoint Presentation Infographic Template Graphic Images
This is a employee weekly efficiency dashboard ppt powerpoint presentation infographic template graphic images. This is a six stage process. The stages in this process are percentage, product, business, management, marketing.
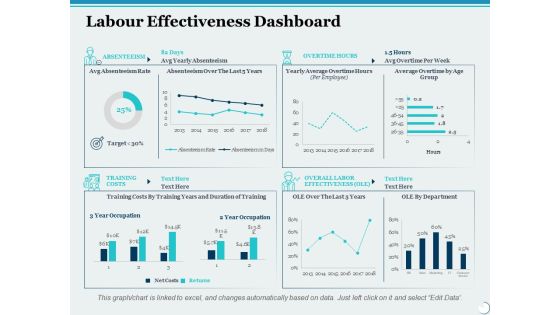
Labour Effectiveness Dashboard Ppt PowerPoint Presentation Slides File Formats
This is a labour effectiveness dashboard ppt powerpoint presentation slides file formats. This is a four stage process. The stages in this process are percentage, product, management, marketing, business.

Clustered Bar Business Product Ppt PowerPoint Presentation Gallery Background
This is a clustered bar business product ppt powerpoint presentation gallery background. This is a three stage process. The stages in this process are business, management, marketing, percentage, product.

Donut Chart Marketing Product Ppt PowerPoint Presentation Slides Background Designs
This is a donut chart marketing product ppt powerpoint presentation slides background designs. This is a three stage process. The stages in this process are business, management, marketing, percentage, product.
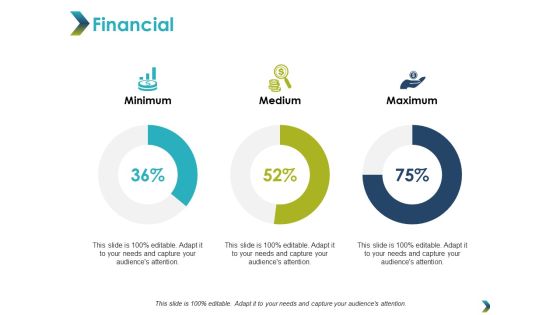
Financial Minimum Maximum Ppt PowerPoint Presentation Infographic Template Picture
This is a financial minimum maximum ppt powerpoint presentation infographic template picture. This is a three stage process. The stages in this process are financial, minimum, maximum, marketing, strategy.
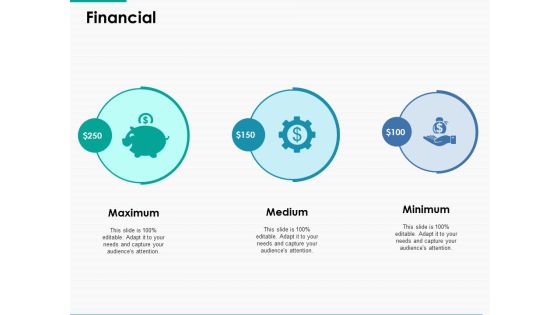
Financial Maximum Medium Ppt Powerpoint Presentation Ideas Graphics Design
This is a financial maximum medium ppt powerpoint presentation ideas graphics design. This is a three stage process. The stages in this process are financial, minimum, maximum, marketing, strategy.

Introduction Financial Management Goals Ppt Powerpoint Presentation File Example
This is a introduction financial management goals ppt powerpoint presentation file example. This is a one stage process. The stages in this process are introduction, financial management goals, business, management, marketing.
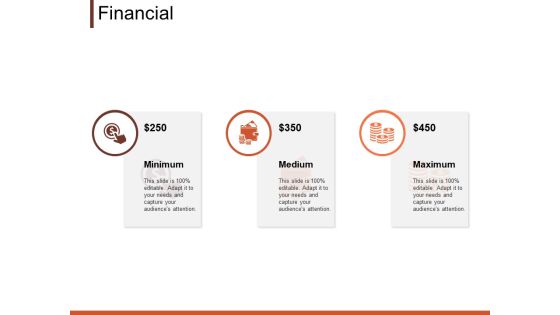
Financial Minimum Medium Ppt PowerPoint Presentation Layouts Graphics Example
This is a financial minimum medium ppt powerpoint presentation layouts graphics example. This is a three stage process. The stages in this process are financial, maximum, medium, minimum, marketing.

Balance Sheet For Cash Management And Liquidity Analysis Ppt PowerPoint Presentation Inspiration Maker
This is a balance sheet for cash management and liquidity analysis ppt powerpoint presentation inspiration maker. This is a two stage process. The stages in this process are liquidity, cash assets, solvency.

Cash Flow Green Drop With Dollar Symbol Ppt PowerPoint Presentation Professional Graphic Tips
This is a cash flow green drop with dollar symbol ppt powerpoint presentation professional graphic tips. This is a four stage process. The stages in this process are liquidity, cash assets, solvency.

Cash Payment Management Flow Chart Ppt PowerPoint Presentation Styles Professional
This is a cash payment management flow chart ppt powerpoint presentation styles professional. This is a seven stage process. The stages in this process are liquidity, cash assets, solvency.
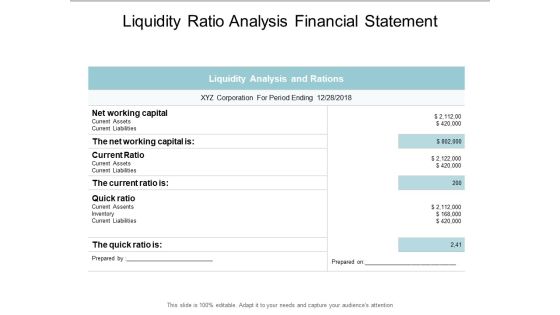
Liquidity Ratio Analysis Financial Statement Ppt PowerPoint Presentation Ideas Layouts
This is a liquidity ratio analysis financial statement ppt powerpoint presentation ideas layouts. This is a four stage process. The stages in this process are liquidity, cash assets, solvency.

Comparison Male And Female Ppt PowerPoint Presentation Professional Skills
This is a comparison male and female ppt powerpoint presentation professional skills. This is a two stage process. The stages in this process are product, percentage, business, management, marketing.

Financial Maximum Medium Ppt Powerpoint Presentation Infographics Slideshow Ppt Powerpoint Presentation Portfolio Ideas
This is a financial maximum medium ppt powerpoint presentation infographics slideshow ppt powerpoint presentation portfolio ideas. This is a three stage process. The stages in this process are financial, minimum, maximum, marketing, strategy.

Area Graph Showing Sales Trends Over Time Ppt PowerPoint Presentation Model Background Designs
This is a area graph showing sales trends over time ppt powerpoint presentation model background designs. This is a three stage process. The stages in this process are financial analysis, quantitative, statistical modelling.

Data Chart For Distribution Of Vehicles By Origin And Type Ppt PowerPoint Presentation Infographics Topics
This is a data chart for distribution of vehicles by origin and type ppt powerpoint presentation infographics topics. This is a four stage process. The stages in this process are financial analysis, quantitative, statistical modelling.

Data Chart For Individual Income Analysis Ppt PowerPoint Presentation Layouts Visual Aids
This is a data chart for individual income analysis ppt powerpoint presentation layouts visual aids. This is a five stage process. The stages in this process are financial analysis, quantitative, statistical modelling.
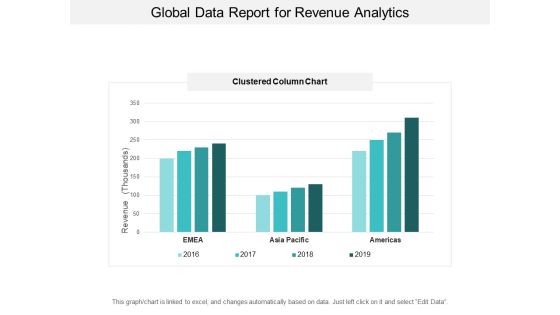
Global Data Report For Revenue Analytics Ppt PowerPoint Presentation Inspiration Visuals
This is a global data report for revenue analytics ppt powerpoint presentation inspiration visuals. This is a four stage process. The stages in this process are financial analysis, quantitative, statistical modelling.

Quantitative Bar Chart For Data Analysis Ppt PowerPoint Presentation Model Graphic Tips
This is a quantitative bar chart for data analysis ppt powerpoint presentation model graphic tips. This is a two stage process. The stages in this process are financial analysis, quantitative, statistical modelling.
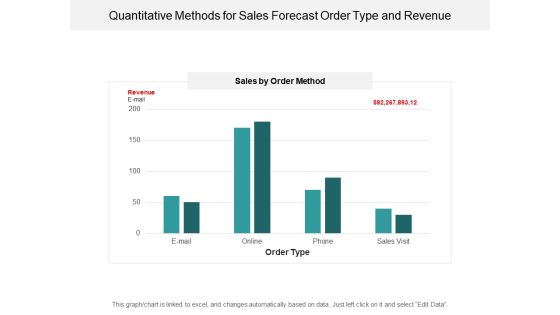
Quantitative Methods For Sales Forecast Order Type And Revenue Ppt PowerPoint Presentation Styles Show
This is a quantitative methods for sales forecast order type and revenue ppt powerpoint presentation styles show. This is a four stage process. The stages in this process are financial analysis, quantitative, statistical modelling.

Quarterly Financial Performance Ratio Analysis Ppt PowerPoint Presentation Model Format Ideas
This is a quarterly financial performance ratio analysis ppt powerpoint presentation model format ideas. This is a four stage process. The stages in this process are financial analysis, quantitative, statistical modelling.
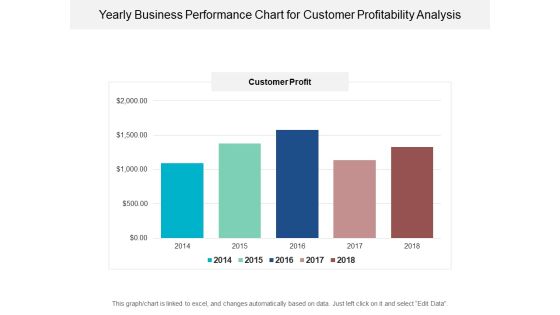
Yearly Business Performance Chart For Customer Profitability Analysis Ppt PowerPoint Presentation Ideas Picture
This is a yearly business performance chart for customer profitability analysis ppt powerpoint presentation ideas picture. This is a five stage process. The stages in this process are financial analysis, quantitative, statistical modelling.
Types Of Common Size Statement Ppt PowerPoint Presentation Model Example
This is a types of common size statement ppt powerpoint presentation model example. This is a three stage process. The stages in this process are business, management, analysis, strategy, marketing.

Bubble Chart Product Ppt PowerPoint Presentation Inspiration Design Ideas
This is a bubble chart product ppt powerpoint presentation inspiration design ideas. This is a one stage process. The stages in this process are business, management, marketing, product, percentage.
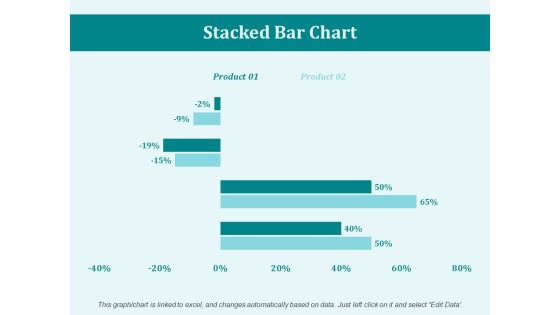
Stacked Bar Chart Percentage Ppt PowerPoint Presentation Portfolio Mockup
This is a stacked bar chart percentage ppt powerpoint presentation portfolio mockup. This is a two stage process. The stages in this process are business, marketing, management, percentage, product.

Key Performance Indicators In Supply Chain Order Accuracy And Cycle Time Ppt PowerPoint Presentation Infographics Slideshow
This is a key performance indicators in supply chain order accuracy and cycle time ppt powerpoint presentation infographics slideshow. This is a two stage process. The stages in this process are logistics performance, logistics dashboard, logistics kpis.

Kpis In Shipping Perfect Order Rate And On Time Shipment Ppt PowerPoint Presentation Show Guide
This is a kpis in shipping perfect order rate and on time shipment ppt powerpoint presentation show guide. This is a six stage process. The stages in this process are logistics performance, logistics dashboard, logistics kpis.
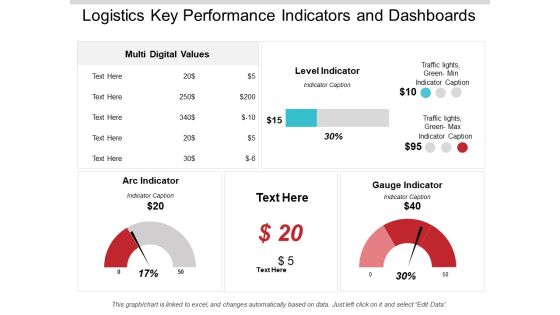
Logistics Key Performance Indicators And Dashboards Ppt PowerPoint Presentation Infographics Background Image
This is a logistics key performance indicators and dashboards ppt powerpoint presentation infographics background image. This is a three stage process. The stages in this process are logistics performance, logistics dashboard, logistics kpis.
Logistics Kpis And Metrics Percentage Of Orders Delivered Ppt PowerPoint Presentation Icon
This is a logistics kpis and metrics percentage of orders delivered ppt powerpoint presentation icon. This is a five stage process. The stages in this process are logistics performance, logistics dashboard, logistics kpis.
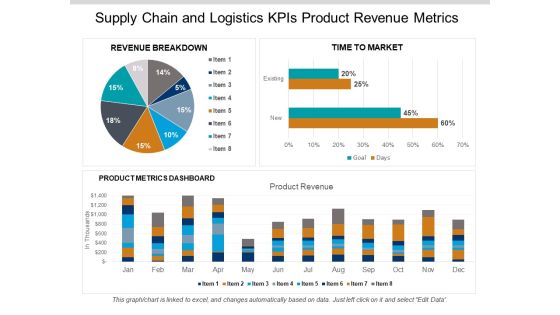
Supply Chain And Logistics Kpis Product Revenue Metrics Ppt PowerPoint Presentation Gallery Aids
This is a supply chain and logistics kpis product revenue metrics ppt powerpoint presentation gallery aids. This is a three stage process. The stages in this process are logistics performance, logistics dashboard, logistics kpis.
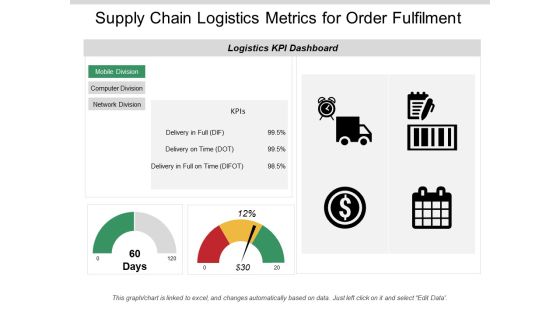
Supply Chain Logistics Metrics For Order Fulfilment Ppt PowerPoint Presentation Infographic Template Information
This is a supply chain logistics metrics for order fulfilment ppt powerpoint presentation infographic template information. This is a two stage process. The stages in this process are logistics performance, logistics dashboard, logistics kpis.

Supply Chain Metrics Fleet Efficiency Loading Time And Weight Ppt PowerPoint Presentation Portfolio Guidelines
This is a supply chain metrics fleet efficiency loading time and weight ppt powerpoint presentation portfolio guidelines. This is a four stage process. The stages in this process are logistics performance, logistics dashboard, logistics kpis.
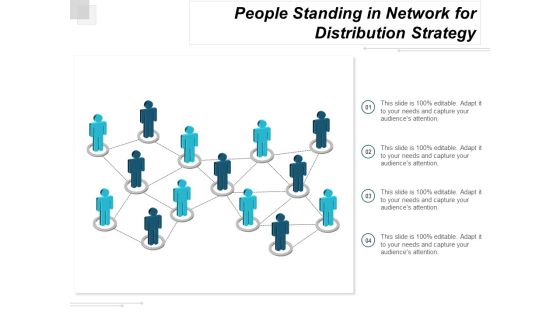
People Standing In Network For Distribution Strategy Ppt Powerpoint Presentation Portfolio Graphics
This is a people standing in network for distribution strategy ppt powerpoint presentation portfolio graphics. This is a four stage process. The stages in this process are retailer, producer, distribution channels, wholesaler, consumer.
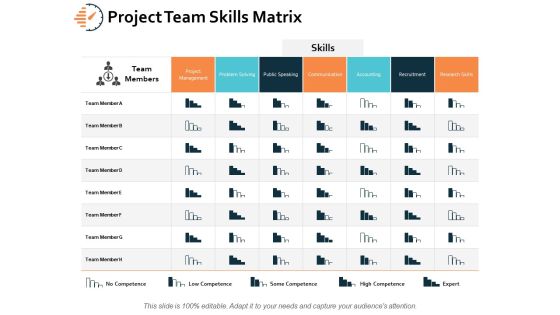
Project Team Skills Matrix Ppt PowerPoint Presentation Styles Example Introduction
This is a project team skills matrix ppt powerpoint presentation styles example introduction. This is a seven stage process. The stages in this process are communication, accounting, problem solving, project management, recruitment.

Calculation Of Return On Capital Employed Ppt PowerPoint Presentation Professional Layouts
This is a calculation of return on capital employed ppt powerpoint presentation professional layouts. This is a four stage process. The stages in this process are accounting ratio, roce, return on capital employed.
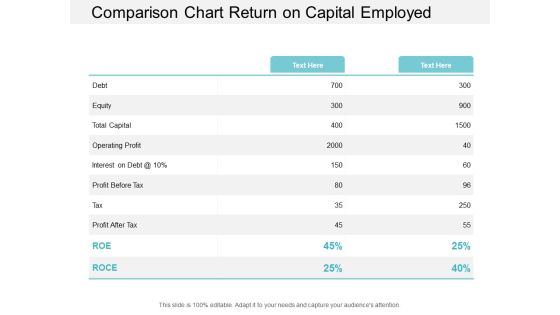
Comparison Chart Return On Capital Employed Ppt PowerPoint Presentation Portfolio Templates
This is a comparison chart return on capital employed ppt powerpoint presentation portfolio templates. This is a two stage process. The stages in this process are accounting ratio, roce, return on capital employed.
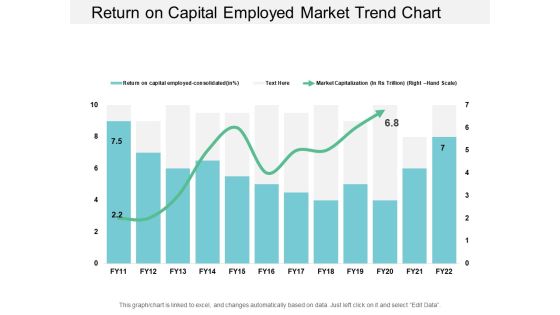
Return On Capital Employed Market Trend Chart Ppt PowerPoint Presentation Styles Examples
This is a return on capital employed market trend chart ppt powerpoint presentation styles examples. This is a two stage process. The stages in this process are accounting ratio, roce, return on capital employed.

Return On Capital Employed Product Performance Chart Ppt PowerPoint Presentation Portfolio Visuals
This is a return on capital employed product performance chart ppt powerpoint presentation portfolio visuals. This is a three stage process. The stages in this process are accounting ratio, roce, return on capital employed.
 Home
Home