Cost Improvement
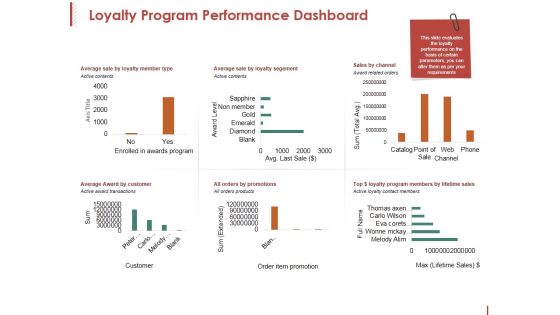
Loyalty Program Performance Dashboard Ppt PowerPoint Presentation Pictures Clipart
This is a loyalty program performance dashboard ppt powerpoint presentation pictures clipart. This is a six stage process. The stages in this process are axis title, award level, sum, active contents, channel.
Sales Kpi Tracker Ppt PowerPoint Presentation Layout
This is a sales kpi tracker ppt powerpoint presentation layout. This is a six stage process. The stages in this process are leads created, sales ratio, opportunities won, top products in revenue, actual.
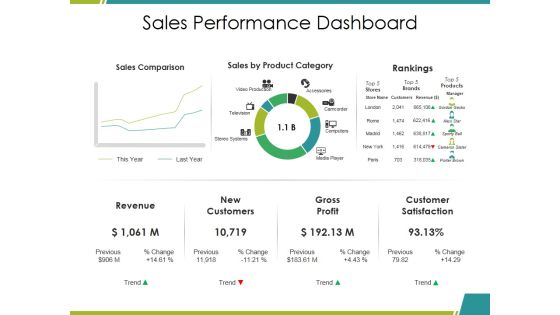
Sales Performance Dashboard Ppt PowerPoint Presentation Infographics Mockup
This is a sales performance dashboard ppt powerpoint presentation infographics mockup. This is a three stage process. The stages in this process are sales comparison, sales by product category, rankings, revenue, gross profit.
Highlights Ppt PowerPoint Presentation Icon Infographics
This is a highlights ppt powerpoint presentation icon infographics. This is a five stage process. The stages in this process are countries, stores worldwide, total revenue, associates, monthly website visitors.

Capital Expenditure Valuation Methods Ppt PowerPoint Presentation File Background Images
This is a capital expenditure valuation methods ppt powerpoint presentation file background images. This is a three stage process. The stages in this process are discounted payback period, net present value method, internal rate of return.
Competitive Analysis Module Ppt PowerPoint Presentation Complete Deck With Slides
This is a competitive analysis module ppt powerpoint presentation complete deck with slides. This is a one stage process. The stages in this process are competition, analysis, marketing, strategy, business.
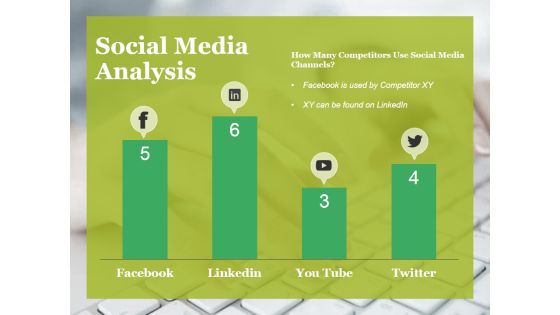
Social Media Analysis Ppt PowerPoint Presentation Infographics Samples
This is a social media analysis ppt powerpoint presentation infographics samples. This is a four stage process. The stages in this process are facebook, linkedin, twitter, you tube, social media.

Radar Chart Ppt PowerPoint Presentation Summary Design Templates
This is a radar chart ppt powerpoint presentation summary design templates. This is a two stage process. The stages in this process are radar chart, product, shapes, business, marketing.

Company Xx Has Wide Range Of Products Services Ppt PowerPoint Presentation Professional Graphics Template
This is a company xx has wide range of products services ppt powerpoint presentation professional graphics template. This is a three stage process. The stages in this process are product segment, customers preferring segment, currency.
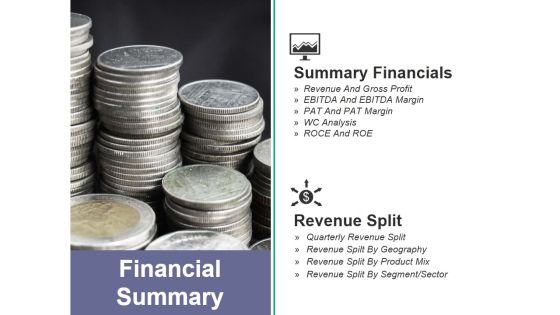
Financial Summary Ppt PowerPoint Presentation Infographic Template Design Inspiration
This is a financial summary ppt powerpoint presentation infographic template design inspiration. This is a two stage process. The stages in this process are summary financials, revenue split, financial summary, revenue and gross profit, wc analysis.

Key Highlights Ppt PowerPoint Presentation Gallery Background Images
This is a key highlights ppt powerpoint presentation gallery background images. This is a eight stage process. The stages in this process are average roce, certified welders, countries, leader in automobile, years.

Competitive Landscape Module Ppt PowerPoint Presentation Complete Deck With Slides
This is a competitive landscape module ppt powerpoint presentation complete deck with slides. This is a one stage process. The stages in this process are competition, marketing, communication, planning, strategy.

Competitor Analysis Ppt PowerPoint Presentation Complete Deck With Slides
This is a competitor analysis ppt powerpoint presentation complete deck with slides. This is a one stage process. The stages in this process are competition, marketing, communication, planning, strategy.

Comparison Ppt PowerPoint Presentation Slides Structure
This is a comparison ppt powerpoint presentation slides structure. This is a three stage process. The stages in this process are pc users in, laptop users in, mobile users in, technology, years.
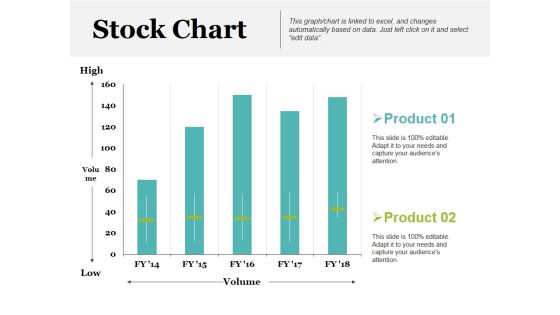
Stock Chart Ppt PowerPoint Presentation Inspiration Example Introduction
This is a stock chart ppt powerpoint presentation inspiration example introduction. This is a two stage process. The stages in this process are product, high, volume, low, stock chart.

Bar Chart Ppt PowerPoint Presentation Model Picture
This is a bar chart ppt powerpoint presentation model picture. This is a two stage process. The stages in this process are product, sales in percentage, financial years, bar chart.
Key Financial Ratios Template 2 Ppt PowerPoint Presentation Slides Ideas
This is a key financial ratios template 2 ppt powerpoint presentation slides ideas. This is a one stage process. The stages in this process are liquidity, profitability, activity, solvency.
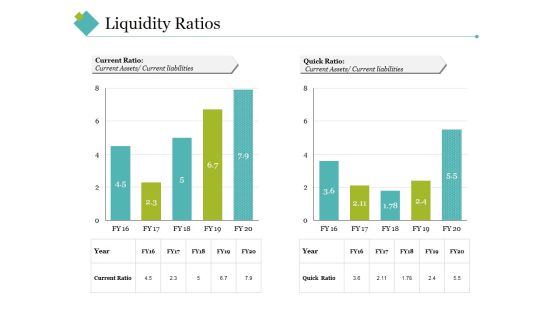
Liquidity Ratios Template 2 Ppt PowerPoint Presentation Gallery Vector
This is a liquidity ratios template 2 ppt powerpoint presentation gallery vector. This is a two stage process. The stages in this process are quick ratio, current ratio, current liabilities, current assets.

Sample Financial Analysis Report Manufacturing Ppt PowerPoint Presentation Complete Deck With Slides
This is a sample financial analysis report manufacturing ppt powerpoint presentation complete deck with slides. This is a one stage process. The stages in this process are sample, financial, analysis, report, manufacturing.

Bar Chart Ppt PowerPoint Presentation Ideas Deck
This is a bar chart ppt powerpoint presentation ideas deck. This is a two stage process. The stages in this process are product, in percentage, in years, financial, business.

Stacked Line Ppt PowerPoint Presentation Pictures Example Topics
This is a stacked line ppt powerpoint presentation pictures example topics. This is a three stage process. The stages in this process are product, in percentage, stacked line, business, marketing.
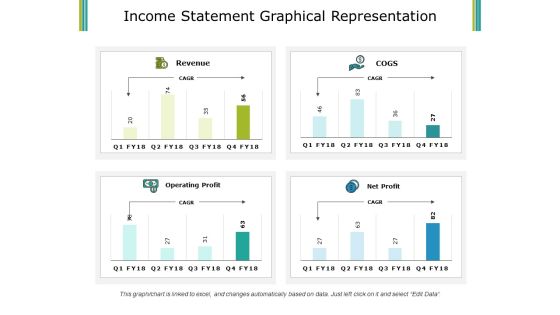
Income Statement Graphical Representation Ppt PowerPoint Presentation Summary Inspiration
This is a income statement graphical representation ppt powerpoint presentation summary inspiration. This is a four stage process. The stages in this process are revenue, cogs, operating profit, net profit.
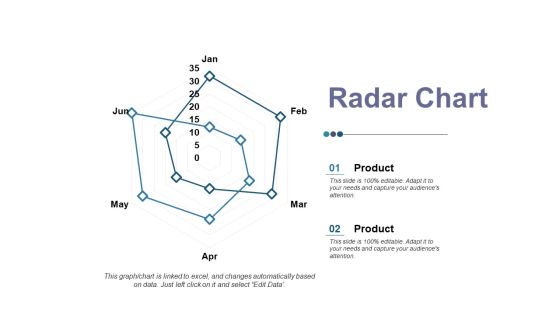
Radar Chart Ppt PowerPoint Presentation Professional Master Slide
This is a radar chart ppt powerpoint presentation professional master slide. This is a two stage process. The stages in this process are product, radar chart, financial, business, shape.

Brand Equity Ppt PowerPoint Presentation Complete Deck With Slides
This is a brand equity ppt powerpoint presentation complete deck with slides. This is a one stage process. The stages in this process are brand, equity, business, financial, technology.
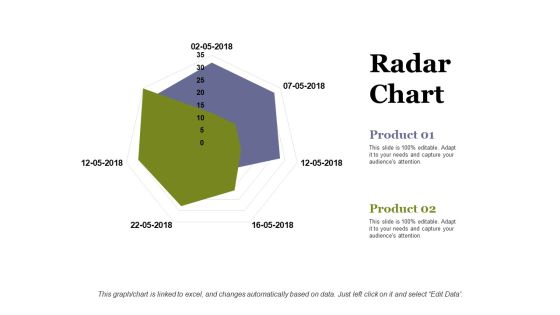
Radar Chart Ppt PowerPoint Presentation Infographic Template Information
This is a radar chart ppt powerpoint presentation infographic template information. This is a two stage process. The stages in this process are radar chart, product, business, marketing, shape.

Stacked Line Ppt PowerPoint Presentation Infographics Vector
This is a stacked line ppt powerpoint presentation infographics vector. This is a three stage process. The stages in this process are product, stacked line, business, marketing, in percentage.

Bar Chart Ppt PowerPoint Presentation Slides Example File
This is a bar chart ppt powerpoint presentation slides example file. This is a two stage process. The stages in this process are product, financial years, sales in percentage.

Marketing Reach By Channels Ppt PowerPoint Presentation Styles Professional
This is a marketing reach by channels ppt powerpoint presentation styles professional. This is a six stage process. The stages in this process are top performing, non scalable, emails, print ads, inline media.

Monetary Benefits Ppt PowerPoint Presentation Ideas Design Inspiration
This is a monetary benefits ppt powerpoint presentation ideas design inspiration. This is a six stage process. The stages in this process are salary, bonuses, stoke options, profit sharing plans, paid time off.

Contingency Plan Template 2 Ppt PowerPoint Presentation Inspiration Icons
This is a contingency plan template 2 ppt powerpoint presentation inspiration icons. This is a four stage process. The stages in this process are scenario, operational support plan, response strategy, implementation plan, refugees.
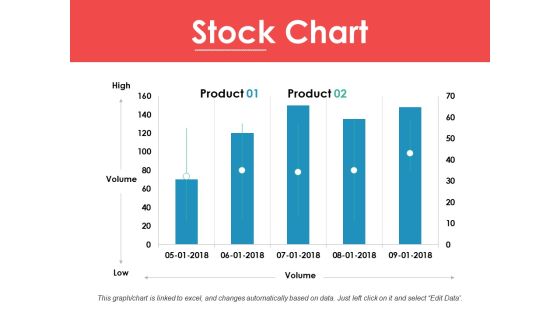
Stock Chart Ppt PowerPoint Presentation Ideas Infographic Template
This is a stock chart ppt powerpoint presentation ideas infographic template. This is a two stage process. The stages in this process are high, volume, low, product, stock chart.

Assets And Revenue Financial Summary Ppt PowerPoint Presentation Diagram Lists
This is a assets and revenue financial summary ppt powerpoint presentation diagram lists. This is a six stage process. The stages in this process are total assets, revenue, deposits, loan, net income.

Sales Performance Dashboard Top Opportunities Ppt PowerPoint Presentation Layouts Template
This is a sales performance dashboard top opportunities ppt powerpoint presentation layouts template. This is a eight stage process. The stages in this process are revenue, new customer, gross profit, customer satisfaction, brand profitability.

Bar Graph Ppt PowerPoint Presentation Infographic Template Demonstration
This is a bar graph ppt powerpoint presentation infographic template demonstration. This is a two stage process. The stages in this process are bar graph, product, sales, percentage, financial.
Volume Open High Low Close Chart Ppt PowerPoint Presentation Icon Design Inspiration
This is a volume open high low close chart ppt powerpoint presentation icon design inspiration. This is a three stage process. The stages in this process are close, high, low, volume, open.

Contingency Plan Scenario Ppt PowerPoint Presentation Summary Samples
This is a contingency plan scenario ppt powerpoint presentation summary samples. This is a one stage process. The stages in this process are scenario, operational support plan, response strategy, preparedness plan, implementation plan.

Business Sales And Revenue Analysis Ppt PowerPoint Presentation Layouts Display
This is a business sales and revenue analysis ppt powerpoint presentation layouts display. This is a four stage process. The stages in this process are goals, results, output, deliverables.

Pie Business Analysis Ppt Powerpoint Presentation Model Graphics
This is a pie business analysis ppt powerpoint presentation model graphics. This is a four stage process. The stages in this process are pie chart, percentage, marketing, business, analysis.

Bull And Bear Trading Balance Ppt Powerpoint Presentation Infographics Designs
This is a bull and bear trading balance ppt powerpoint presentation infographics designs. This is a two stage process. The stages in this process are stock market, financial market, bull market.

Global Stock Trading Industry And Exchange Ppt Powerpoint Presentation Ideas Summary
This is a global stock trading industry and exchange ppt powerpoint presentation ideas summary. This is a five stage process. The stages in this process are stock market, financial market, bull market.
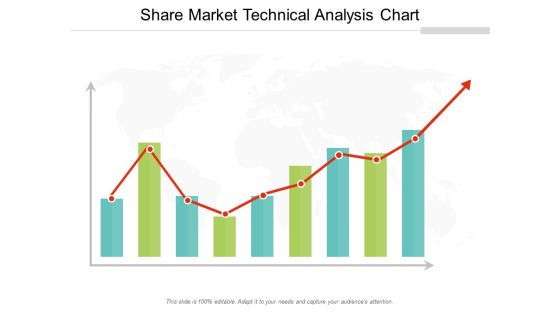
Share Market Technical Analysis Chart Ppt Powerpoint Presentation Professional Rules
This is a share market technical analysis chart ppt powerpoint presentation professional rules. This is a three stage process. The stages in this process are stock market, financial market, bull market.

Stock Market Trends Of Five Countries Ppt Powerpoint Presentation Model Guidelines
This is a stock market trends of five countries ppt powerpoint presentation model guidelines. This is a four stage process. The stages in this process are stock market, financial market, bull market.

Stock Trading Advice News And Analytics Ppt Powerpoint Presentation Show Design Inspiration
This is a stock trading advice news and analytics ppt powerpoint presentation show design inspiration. This is a three stage process. The stages in this process are stock market, financial market, bull market.

Pie Chart For Data Presentation Vector Ppt Powerpoint Presentation Summary Display
This is a pie chart for data presentation vector ppt powerpoint presentation summary display. This is a three stage process. The stages in this process are data visualization icon, data management icon.

Annual Report Vector Icon Ppt Powerpoint Presentation File Gridlines
This is a annual report vector icon ppt powerpoint presentation file gridlines. This is a three stage process. The stages in this process are financial statements icon, accounting ratio icon, balance sheet icon.

Balance Sheet Vector Icon Ppt Powerpoint Presentation Designs Download
This is a balance sheet vector icon ppt powerpoint presentation designs download. This is a three stage process. The stages in this process are financial statements icon, accounting ratio icon, balance sheet icon.

Business Report Vector Icon Ppt Powerpoint Presentation Summary Guidelines
This is a business report vector icon ppt powerpoint presentation summary guidelines. This is a three stage process. The stages in this process are financial statements icon, accounting ratio icon, balance sheet icon.
Financial Document With Euro Symbol Vector Ppt Powerpoint Presentation Inspiration Graphics
This is a financial document with euro symbol vector ppt powerpoint presentation inspiration graphics. This is a four stage process. The stages in this process are financial statements icon, accounting ratio icon, balance sheet icon.
Financial Document With Pen And Dollar Icon Ppt Powerpoint Presentation Summary Slide Portrait
This is a financial document with pen and dollar icon ppt powerpoint presentation summary slide portrait. This is a four stage process. The stages in this process are financial statements icon, accounting ratio icon, balance sheet icon.
Financial Performance Report Vector Icon Ppt Powerpoint Presentation Pictures Background Image
This is a financial performance report vector icon ppt powerpoint presentation pictures background image. This is a four stage process. The stages in this process are financial statements icon, accounting ratio icon, balance sheet icon.
Financial Reporting Icon Computer Screen With Graph And Dollar Ppt Powerpoint Presentation Layouts Model
This is a financial reporting icon computer screen with graph and dollar ppt powerpoint presentation layouts model. This is a four stage process. The stages in this process are financial statements icon, accounting ratio icon, balance sheet icon.
Income Statement And Auditing Vector Icon Ppt Powerpoint Presentation Clipart
This is a income statement and auditing vector icon ppt powerpoint presentation clipart. This is a three stage process. The stages in this process are financial statements icon, accounting ratio icon, balance sheet icon.
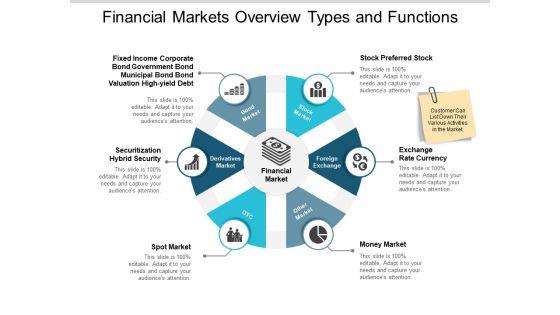
Financial Markets Overview Types And Functions Ppt PowerPoint Presentation Ideas Shapes
This is a financial markets overview types and functions ppt powerpoint presentation ideas shapes. This is a six stage process. The stages in this process are stock market, financial markets, bull market.
Statistical Analysis Of Financial Markets Ppt PowerPoint Presentation Model Graphic Images
This is a statistical analysis of financial markets ppt powerpoint presentation model graphic images. This is a four stage process. The stages in this process are stock market, financial markets, bull market.
Stock Market Analysis Magnifying Glass Over Bar Graph And Dollar Sign Ppt PowerPoint Presentation Icon Visual Aids
This is a stock market analysis magnifying glass over bar graph and dollar sign ppt powerpoint presentation icon visual aids. This is a four stage process. The stages in this process are stock market, financial markets, bull market.
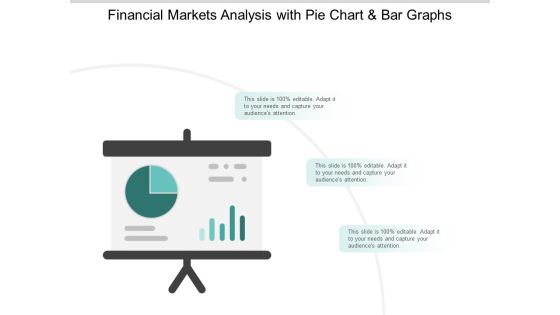
Stock Market Survey Reporting With Pie Chat And Bar Graph Ppt PowerPoint Presentation Infographic Template Example 2015
This is a stock market survey reporting with pie chat and bar graph ppt powerpoint presentation infographic template example 2015. This is a three stage process. The stages in this process are stock market, financial markets, bull market.
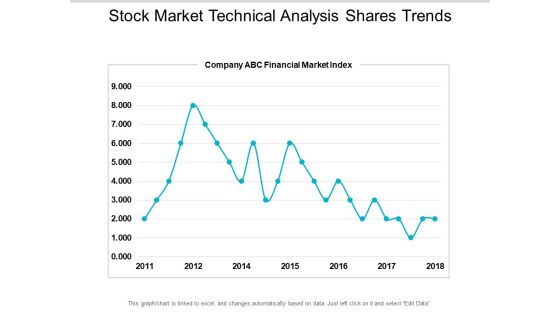
Stock Market Technical Analysis Shares Trends Ppt PowerPoint Presentation Portfolio Introduction
This is a stock market technical analysis shares trends ppt powerpoint presentation portfolio introduction. This is a seven stage process. The stages in this process are stock market, financial markets, bull market.

Social Media Key Statistics Ppt PowerPoint Presentation Show Example File
This is a social media key statistics ppt powerpoint presentation show example file. This is a five stage process. The stages in this process are business, management, marketing, percentage, product.

Channel Intermediaries For Distribution Ppt Powerpoint Presentation Gallery Shapes
This is a channel intermediaries for distribution ppt powerpoint presentation gallery shapes. This is a five stage process. The stages in this process are retailer, producer, distribution channels, wholesaler, consumer.

Distribution Management And Channel Network Ppt Powerpoint Presentation Pictures Model
This is a distribution management and channel network ppt powerpoint presentation pictures model. This is a four stage process. The stages in this process are retailer, producer, distribution channels, wholesaler, consumer.
 Home
Home