AI PPT Maker
Templates
PPT Bundles
Design Services
Business PPTs
Business Plan
Management
Strategy
Introduction PPT
Roadmap
Self Introduction
Timelines
Process
Marketing
Agenda
Technology
Medical
Startup Business Plan
Cyber Security
Dashboards
SWOT
Proposals
Education
Pitch Deck
Digital Marketing
KPIs
Project Management
Product Management
Artificial Intelligence
Target Market
Communication
Supply Chain
Google Slides
Research Services
 One Pagers
All Categories
-
Home
- Customer Favorites
- Cost Icon
Cost Icon
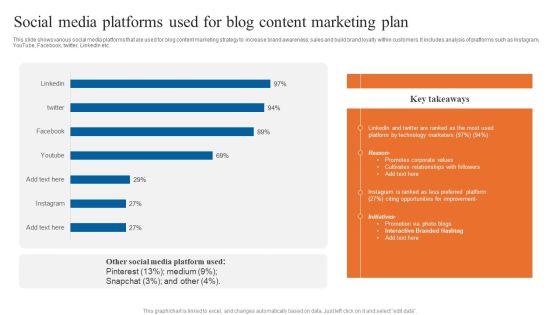
Social Media Platforms Used For Blog Content Marketing Plan Portrait PDF
This slide shows various social media platforms that are used for blog content marketing strategy to increase brand awareness, sales and build brand loyalty within customers. It includes analysis of platforms such as Instagram, YouTube, Facebook, twitter, LinkedIn etc. Pitch your topic with ease and precision using this Social Media Platforms Used For Blog Content Marketing Plan Portrait PDF. This layout presents information on Social Media Platforms, Content Marketing Plan, Promotes Corporate Values. It is also available for immediate download and adjustment. So, changes can be made in the color, design, graphics or any other component to create a unique layout.
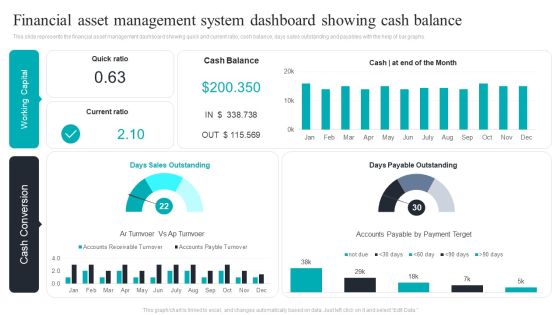
Financial Asset Management System Dashboard Showing Cash Balance Download PDF
This slide represents the financial asset management dashboard showing quick and current ratio, cash balance, days sales outstanding and payables with the help of bar graphs. Pitch your topic with ease and precision using this Financial Asset Management System Dashboard Showing Cash Balance Download PDF. This layout presents information on Financial Asset, Management System, Dashboard Showing, Cash Balance. It is also available for immediate download and adjustment. So, changes can be made in the color, design, graphics or any other component to create a unique layout.

Financial Asset Management System Dashboard Showing Debt And Equity Ratio Graphics PDF
This slide shows the dashboard of financial asset management representing total accounts receivable and payable, equity and debt ratio, profit and loss summary, net working capital etc. Showcasing this set of slides titled Financial Asset Management System Dashboard Showing Debt And Equity Ratio Graphics PDF. The topics addressed in these templates are Financial Asset, Management System, Debt And Equity Ratio. All the content presented in this PPT design is completely editable. Download it and make adjustments in color, background, font etc. as per your unique business setting.

Consumer Risk Assessment Dashboard Reporting Ppt Layouts Ideas PDF
This slide showcases the customer risk assessment dashboard with major kpis. It includes reporting risks summary, risk mitigation, risk profile, and detail. It also reflects the risk score and score distribution across different areas and activities. Pitch your topic with ease and precision using this Consumer Risk Assessment Dashboard Reporting Ppt Layouts Ideas PDF. This layout presents information on Risk Summary, Customer Risk Dashboard, Risk Profile. It is also available for immediate download and adjustment. So, changes can be made in the color, design, graphics or any other component to create a unique layout.
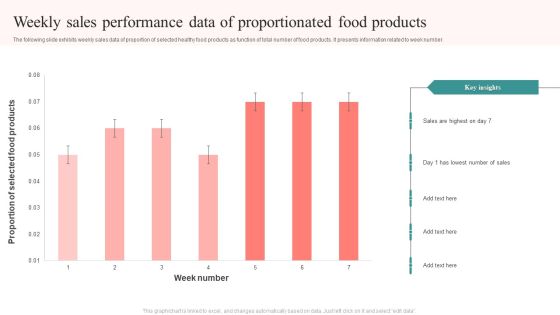
Weekly Sales Performance Data Of Proportionated Food Products Structure PDF
The following slide exhibits weekly sales data of proportion of selected healthy food products as function of total number of food products. It presents information related to week number. Showcasing this set of slides titled Weekly Sales Performance Data Of Proportionated Food Products Structure PDF. The topics addressed in these templates are Proportion Selected, Food Products, Week Number, Sales Highest. All the content presented in this PPT design is completely editable. Download it and make adjustments in color, background, font etc. as per your unique business setting.

Retail Weekly Sales Performance Report Dashboard To Measure Performance Ppt Gallery File Formats PDF
The following slide exhibits dashboard for small-scale retailers and product sales for chosen time period. It presents information related to revenue breakdown, total income, etc. Showcasing this set of slides titled Retail Weekly Sales Performance Report Dashboard To Measure Performance Ppt Gallery File Formats PDF. The topics addressed in these templates are Revenue Breakdown, Total Income, Total Revenue. All the content presented in this PPT design is completely editable. Download it and make adjustments in color, background, font etc. as per your unique business setting.

Business Ecological Footprints Consumption And Biocapacity Analysis Designs PDF
This slide depicts the ecological footprint and biocapacity past trends along with its future predictions. The purpose of this template is to analyze ecological footprint level in present, past and future. It includes information related to the ecological debt, productivity level and usage on yearly basis. Pitch your topic with ease and precision using this Business Ecological Footprints Consumption And Biocapacity Analysis Designs PDF. This layout presents information on Business Ecological Footprints, Consumption Biocapacity Analysis. It is also available for immediate download and adjustment. So, changes can be made in the color, design, graphics or any other component to create a unique layout.

Composition Of Ecological Footprints By Consumption Category Mockup PDF
This slide covers the utilization categories and its contribution to ecological footprint. The purpose of this template is to depict the composition of U.S. footprint by consumption classification. It includes information related to food, housing, government, etc. Pitch your topic with ease and precision using this Composition Of Ecological Footprints By Consumption Category Mockup PDF. This layout presents information on Government, Services, Transportation. It is also available for immediate download and adjustment. So, changes can be made in the color, design, graphics or any other component to create a unique layout.

Dashboard To Analyze City Ecological And Carbon Footprints Consumption Mockup PDF
This slide illustrates the dashboard to analyze ecological and carbon footprint of a city. The purpose of this template is to provide layout to analyze footprint data and define measures to protect environment. It includes metrics related to carbon emissions, usage of air, water and energy. Showcasing this set of slides titled Dashboard To Analyze City Ecological And Carbon Footprints Consumption Mockup PDF. The topics addressed in these templates are Installing Rooftop Photovoltaic, Using Mass Transport, Composting. All the content presented in this PPT design is completely editable. Download it and make adjustments in color, background, font etc. as per your unique business setting.
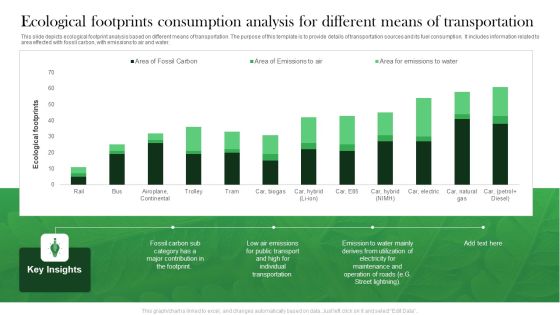
Ecological Footprints Consumption Analysis For Different Means Of Transportation Portrait PDF
This slide depicts ecological footprint analysis based on different means of transportation. The purpose of this template is to provide details of transportation sources and its fuel consumption. It includes information related to area effected with fossil carbon, with emissions to air and water. Showcasing this set of slides titled Ecological Footprints Consumption Analysis For Different Means Of Transportation Portrait PDF. The topics addressed in these templates are Ecological Footprints Consumption, Analysis Different, Means Transportation. All the content presented in this PPT design is completely editable. Download it and make adjustments in color, background, font etc. as per your unique business setting.

Ecological Footprints Consumption Categorization For Different Countries Download PDF
This slide depicts the ecological footprint a method promoted by the global footprint network to measure human demand on natural capital. The purpose of this template is to analyze ecological footprints of different countries. It includes information related to carbon, fishing, etc. Pitch your topic with ease and precision using this Ecological Footprints Consumption Categorization For Different Countries Download PDF. This layout presents information on Ecological Footprints Consumption, Categorization Different Countries. It is also available for immediate download and adjustment. So, changes can be made in the color, design, graphics or any other component to create a unique layout.

Ecological Footprints Consumption For Different Electricity Provision Technologies Topics PDF
This slide covers the ecological footprints based on the different electricity generating alternatives available. The purpose of this template is analyze electricity provision technologies. It includes information related to different fuels biogas, wind, photovoltaics PV and natural gas. Showcasing this set of slides titled Ecological Footprints Consumption For Different Electricity Provision Technologies Topics PDF. The topics addressed in these templates are Ecological Footprints Consumption, Different Electricity, Provision Technologies. All the content presented in this PPT design is completely editable. Download it and make adjustments in color, background, font etc. as per your unique business setting.

World Ecological Footprints Consumption Analysis Based On Land Type Topics PDF
Showcasing this set of slides titled World Ecological Footprints Consumption Analysis Based On Land Type Topics PDF. The topics addressed in these templates are World Ecological Footprints, Consumption Analysis, Based Land Type. All the content presented in this PPT design is completely editable. Download it and make adjustments in color, background, font etc. as per your unique business setting.

Risk Assessment Project Portfolio Roadmap And Health Status Summary Mockup PDF
This slide covers timeline and health status report for risk assessment project. It includes KPIs such as BRMS build, customer support, risk assess, credit research and rules engine. Pitch your topic with ease and precision using this Risk Assessment Project Portfolio Roadmap And Health Status Summary Mockup PDF. This layout presents information on Risk Assessment Project, Portfolio Roadmap, Health Status Summary. It is also available for immediate download and adjustment. So, changes can be made in the color, design, graphics or any other component to create a unique layout.

E Mail Marketing Campaign Outcomes Kpis Result Analysis Mockup PDF
Showcasing this set of slides titled E Mail Marketing Campaign Outcomes Kpis Result Analysis Mockup PDF. The topics addressed in these templates are Marketing Campaign, Outcomes Kpis, Result Analysis. All the content presented in this PPT design is completely editable. Download it and make adjustments in color, background, font etc. as per your unique business setting.

Email Marketing Campaign Outcomes And Social Media Marketing Result Analysis Dashboard Mockup PDF
This slide depicts the dashboard for analyzing the results of email campaign and social media marketing. It includes information related to the comparison, statistics, usage, etc. Pitch your topic with ease and precision using this Email Marketing Campaign Outcomes And Social Media Marketing Result Analysis Dashboard Mockup PDF. This layout presents information on Email Marketing Campaign, Outcomes And Social Media, Marketing Result, Analysis Dashboard. It is also available for immediate download and adjustment. So, changes can be made in the color, design, graphics or any other component to create a unique layout.
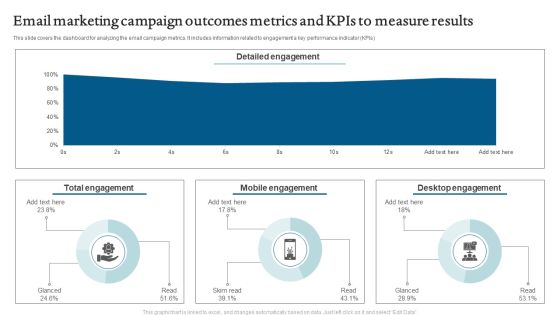
Email Marketing Campaign Outcomes Metrics And Kpis To Measure Results Rules PDF
This slide depicts the dashboard for analyzing the results of email campaign and social media marketing. It includes information related to the comparison, statistics, usage, etc. Showcasing this set of slides titled Email Marketing Campaign Outcomes Metrics And Kpis To Measure Results Rules PDF. The topics addressed in these templates are Detailed Engagement, Mobile Engagement, Desktop Engagement. All the content presented in this PPT design is completely editable. Download it and make adjustments in color, background, font etc. as per your unique business setting.
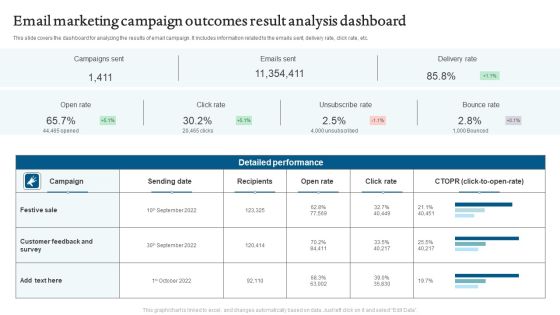
Email Marketing Campaign Outcomes Result Analysis Dashboard Mockup PDF
This slide covers the dashboard for analyzing the email campaign metrics. It includes information related to engagement a key performance indicator KPIs. Pitch your topic with ease and precision using this Email Marketing Campaign Outcomes Result Analysis Dashboard Mockup PDF. This layout presents information on Campaigns Sent, Emails Sent, Delivery Rate. It is also available for immediate download and adjustment. So, changes can be made in the color, design, graphics or any other component to create a unique layout.

Email Marketing Campaign Outcomes Results And Campaign Performance Dashboard Slides PDF
This slide covers the dashboard for analyzing the results of email campaign. It includes information related to the emails sent, delivery rate, click rate, etc. Showcasing this set of slides titled Email Marketing Campaign Outcomes Results And Campaign Performance Dashboard Slides PDF. The topics addressed in these templates are Opens And Clicks Rates, Other Information, Bounces . All the content presented in this PPT design is completely editable. Download it and make adjustments in color, background, font etc. as per your unique business setting.
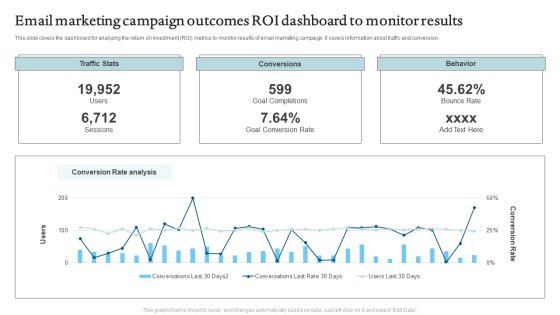
Email Marketing Campaign Outcomes ROI Dashboard To Monitor Results Formats PDF
This slide depicts the dashboard for analyzing the marketing results and campaign performance. It includes information related email sent, delivered, conversions, etc. Pitch your topic with ease and precision using this Email Marketing Campaign Outcomes ROI Dashboard To Monitor Results Formats PDF. This layout presents information on Traffic Stats, Conversions, Behavior. It is also available for immediate download and adjustment. So, changes can be made in the color, design, graphics or any other component to create a unique layout.
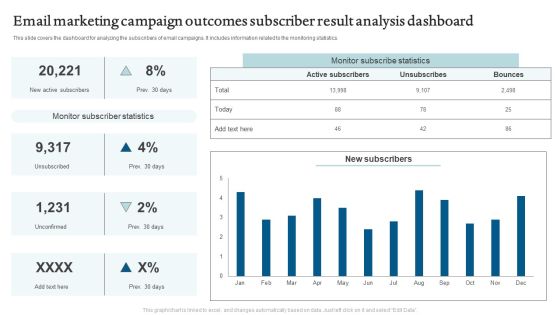
Email Marketing Campaign Outcomes Subscriber Result Analysis Dashboard Professional PDF
This slide covers the dashboard for analyzing the subscribers of email campaigns. It includes information related to the monitoring statistics. Showcasing this set of slides titled Email Marketing Campaign Outcomes Subscriber Result Analysis Dashboard Professional PDF. The topics addressed in these templates are Monitor Subscribe Statistics, Monitor Subscriber Statistics. All the content presented in this PPT design is completely editable. Download it and make adjustments in color, background, font etc. as per your unique business setting.
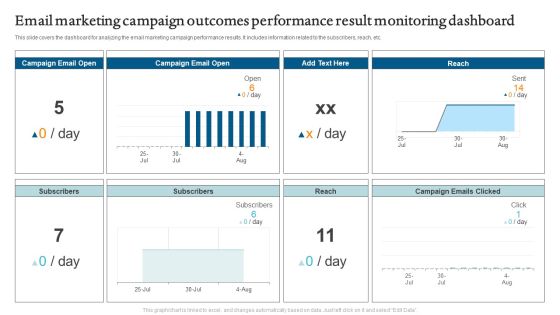
Email Marketing Campaign Outcomes Performance Result Monitoring Dashboard Slides PDF
Showcasing this set of slides titled Email Marketing Campaign Outcomes Performance Result Monitoring Dashboard Slides PDF. The topics addressed in these templates are Email Marketing Campaign, Outcomes Performance, Result Monitoring Dashboard. All the content presented in this PPT design is completely editable. Download it and make adjustments in color, background, font etc. as per your unique business setting.
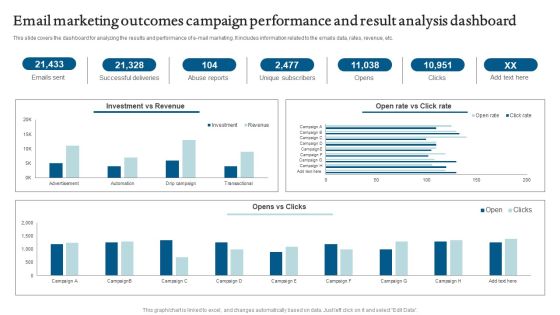
Email Marketing Outcomes Campaign Performance And Result Analysis Dashboard Introduction PDF
Pitch your topic with ease and precision using this Email Marketing Outcomes Campaign Performance And Result Analysis Dashboard Introduction PDF. This layout presents information on Email Marketing Outcomes, Campaign Performance, Result Analysis Dashboard. It is also available for immediate download and adjustment. So, changes can be made in the color, design, graphics or any other component to create a unique layout.
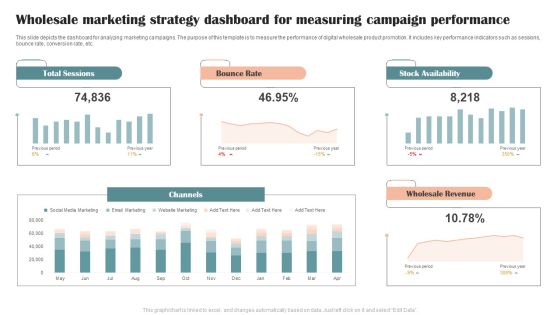
Wholesale Marketing Strategy Dashboard For Measuring Campaign Performance Graphics PDF
This slide depicts the dashboard for analyzing marketing campaigns. The purpose of this template is to measure the performance of digital wholesale product promotion. It includes key performance indicators such as sessions, bounce rate, conversion rate, etc. Showcasing this set of slides titled Wholesale Marketing Strategy Dashboard For Measuring Campaign Performance Graphics PDF. The topics addressed in these templates are Total Sessions, Bounce Rate, Stock Availability. All the content presented in this PPT design is completely editable. Download it and make adjustments in color, background, font etc. as per your unique business setting.
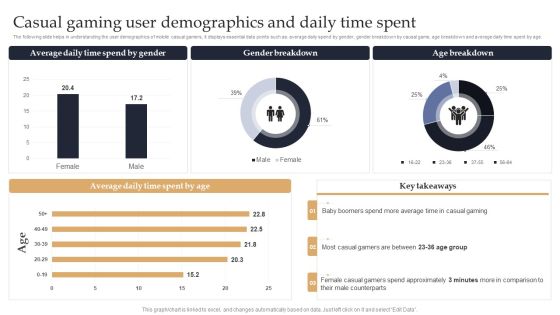
Web 3 0 Blockchain Based P2E Mobile Game Sector Report Promotional Plan Casual Gaming User Demographics Clipart PDF
Want to ace your presentation in front of a live audience. Our Web 3 0 Blockchain Based P2E Mobile Game Sector Report Promotional Plan Casual Gaming User Demographics Clipart PDF can help you do that by engaging all the users towards you. Slidegeeks experts have put their efforts and expertise into creating these impeccable powerpoint presentations so that you can communicate your ideas clearly. Moreover, all the templates are customizable, and easy-to-edit and downloadable. Use these for both personal and commercial use.
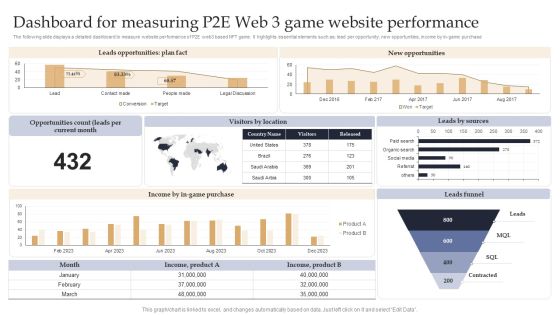
Web 3 0 Blockchain Based P2E Mobile Game Sector Report Promotional Plan Dashboard For Measuring P2E Web 3 Game Introduction PDF
The following slide displays a detailed dashboard to measure website performance of P2E web3 based NFT game. It highlights essential elements such as lead per opportunity, new opportunities, income by in-game purchase. There are so many reasons you need a Web 3 0 Blockchain Based P2E Mobile Game Sector Report Promotional Plan Dashboard For Measuring P2E Web 3 Game Introduction PDF. The first reason is you cant spend time making everything from scratch, Thus, Slidegeeks has made presentation templates for you too. You can easily download these templates from our website easily.

Web 3 0 Blockchain Based P2E Mobile Game Sector Report Promotional Plan Dashboard For Measuring Unique Visitors Topics PDF
The following slide displays a detailed dashboard to measure website performance of P2E web3 based NFT game. It highlights essential elements such as session frequency, visit frequency, content origin etc. Do you have to make sure that everyone on your team knows about any specific topic. I yes, then you should give Web 3 0 Blockchain Based P2E Mobile Game Sector Report Promotional Plan Dashboard For Measuring Unique Visitors Information PDF a try. Our experts have put a lot of knowledge and effort into creating this impeccable Web 3 0 Blockchain Based P2E Mobile Game Sector Report Promotional Plan Dashboard For Measuring Unique Visitors Topics PDF. You can use this template for your upcoming presentations, as the slides are perfect to represent even the tiniest detail. You can download these templates from the Slidegeeks website and these are easy to edit. So grab these today.
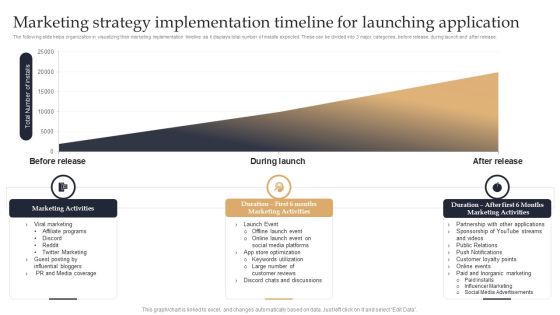
Web 3 0 Blockchain Based P2E Mobile Game Sector Report Promotional Plan Marketing Strategy Implementation Structure PDF
Crafting an eye-catching presentation has never been more straightforward. Let your presentation shine with this tasteful yet straightforward Web 3 0 Blockchain Based P2E Mobile Game Sector Report Promotional Plan Marketing Strategy Implementation Structure PDF template. It offers a minimalistic and classy look that is great for making a statement. The colors have been employed intelligently to add a bit of playfulness while still remaining professional. Construct the ideal Web 3 0 Blockchain Based P2E Mobile Game Sector Report Promotional Plan Marketing Strategy Implementation Structure PDF that effortlessly grabs the attention of your audience. Begin now and be certain to wow your customers.
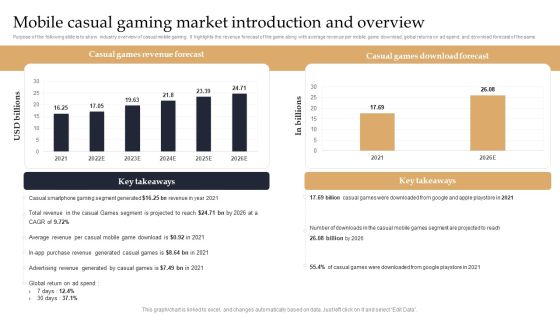
Web 3 0 Blockchain Based P2E Mobile Game Sector Report Promotional Plan Mobile Casual Gaming Market Introduction Elements PDF
Purpose of the following slide is to show industry overview of casual mobile gaming. It highlights the revenue forecast of the game along with average revenue per mobile game download, global returns on ad spend, and download forecast of the same. Make sure to capture your audiences attention in your business displays with our gratis customizableWeb 3 0 Blockchain Based P2E Mobile Game Sector Report Promotional Plan Mobile Casual Gaming Market Introduction Elements PDF. These are great for business strategies, office conferences, capital raising or task suggestions. If you desire to acquire more customers for your tech business and ensure they stay satisfied, create your own sales presentation with these plain slides.
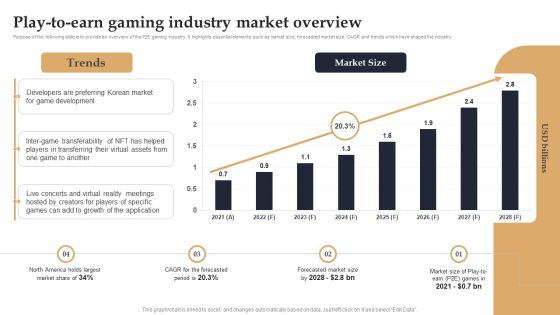
Web 3 0 Blockchain Based P2E Mobile Game Sector Report Promotional Plan Play To Earn Gaming Industry Market Overview Guidelines PDF
Purpose of the following slide is to provide an overview of the P2E gaming industry. It highlights essential elements such as market size, forecasted market size, CAGR and trends which have shaped the industry. Formulating a presentation can take up a lot of effort and time, so the content and message should always be the primary focus. The visuals of the PowerPoint can enhance the presenters message, so our Web 3 0 Blockchain Based P2E Mobile Game Sector Report Promotional Plan Play To Earn Gaming Industry Market Overview Guidelines PDF was created to help save time. Instead of worrying about the design, the presenter can concentrate on the message while our designers work on creating the ideal templates for whatever situation is needed. Slidegeeks has experts for everything from amazing designs to valuable content, we have put everything into Web 3 0 Blockchain Based P2E Mobile Game Sector Report Promotional Plan Play To Earn Gaming Industry Market Overview Guidelines PDF
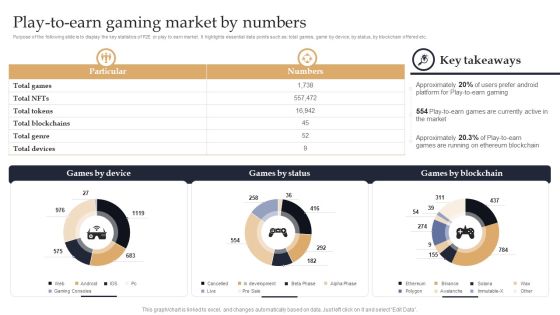
Web 3 0 Blockchain Based P2E Mobile Game Sector Report Promotional Plan Play To Earn Gaming Market By Numbers Summary PDF
Purpose of the following slide is to display the key statistics of P2E or play to earn market. It highlights essential data points such as total games, game by device, by status, by blockchain offered etc. Coming up with a presentation necessitates that the majority of the effort goes into the content and the message you intend to convey. The visuals of a PowerPoint presentation can only be effective if it supplements and supports the story that is being told. Keeping this in mind our experts created Web 3 0 Blockchain Based P2E Mobile Game Sector Report Promotional Plan Play To Earn Gaming Market By Numbers Summary PDF to reduce the time that goes into designing the presentation. This way, you can concentrate on the message while our designers take care of providing you with the right template for the situation.
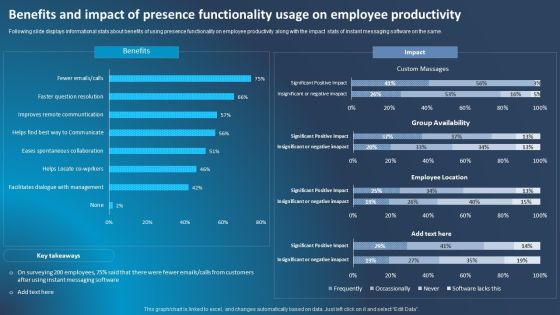
Improving Corporate Performance Benefits And Impact Of Presence Functionality Usage Portrait PDF
Following slide displays informational stats about benefits of using presence functionality on employee productivity along with the impact stats of instant messaging software on the same. Create an editable Improving Corporate Performance Benefits And Impact Of Presence Functionality Usage Portrait PDF that communicates your idea and engages your audience. Whether youre presenting a business or an educational presentation, pre-designed presentation templates help save time. Improving Corporate Performance Benefits And Impact Of Presence Functionality Usage Portrait PDF is highly customizable and very easy to edit, covering many different styles from creative to business presentations. Slidegeeks has creative team members who have crafted amazing templates. So, go and get them without any delay.

Improving Corporate Performance Determining Customer Lifetime Value And Churn Rate Microsoft PDF
This slide shows informational statistics about customer lifetime value and churn rate in FY20. It also shows that average customer lifetime for 2020 was 21 months. From laying roadmaps to briefing everything in detail, our templates are perfect for you. You can set the stage with your presentation slides. All you have to do is download these easy-to-edit and customizable templates. Improving Corporate Performance Determining Customer Lifetime Value And Churn Rate Microsoft PDF will help you deliver an outstanding performance that everyone would remember and praise you for. Do download this presentation today.
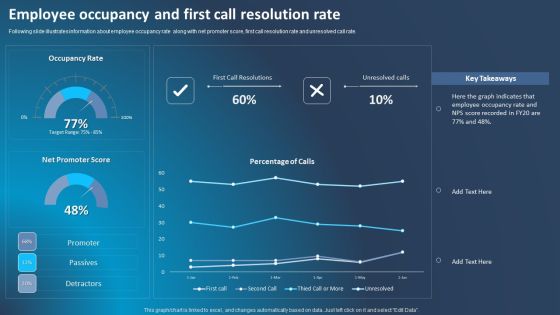
Improving Corporate Performance Employee Occupancy And First Call Resolution Rate Information PDF
Following slide illustrates information about employee occupancy rate along with net promoter score, first call resolution rate and unresolved call rate. Present like a pro with Improving Corporate Performance Employee Occupancy And First Call Resolution Rate Information PDF Create beautiful presentations together with your team, using our easy-to-use presentation slides. Share your ideas in real-time and make changes on the fly by downloading our templates. So whether youre in the office, on the go, or in a remote location, you can stay in sync with your team and present your ideas with confidence. With Slidegeeks presentation got a whole lot easier. Grab these presentations today.
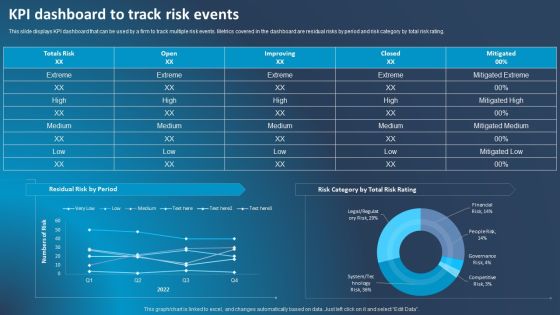
Improving Corporate Performance KPI Dashboard To Track Risk Events Sample PDF
This slide displays KPI dashboard that can be used by a firm to track multiple risk events. Metrics covered in the dashboard are residual risks by period and risk category by total risk rating. Are you in need of a template that can accommodate all of your creative concepts This one is crafted professionally and can be altered to fit any style. Use it with Google Slides or PowerPoint. Include striking photographs, symbols, depictions, and other visuals. Fill, move around, or remove text boxes as desired. Test out color palettes and font mixtures. Edit and save your work, or work with colleagues. Download Improving Corporate Performance KPI Dashboard To Track Risk Events Sample PDF and observe how to make your presentation outstanding. Give an impeccable presentation to your group and make your presentation unforgettable.

Improving Corporate Performance Overview Of Financial Loss Incurred By The Firm Due Ideas PDF
Mentioned slide displays informational stats about financial loss incurred by the firm caused due to risk events. Risk event categories covered in the slide are sales practices, fraud activities, technology failure and natural disaster. Make sure to capture your audiences attention in your business displays with our gratis customizable Improving Corporate Performance Overview Of Financial Loss Incurred By The Firm Due Ideas PDF. These are great for business strategies, office conferences, capital raising or task suggestions. If you desire to acquire more customers for your tech business and ensure they stay satisfied, create your own sales presentation with these plain slides.
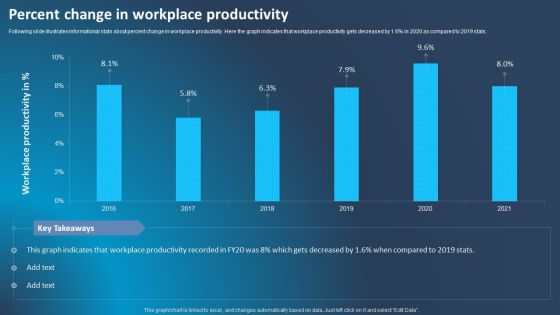
Improving Corporate Performance Percent Change In Workplace Productivity Inspiration PDF
Following slide illustrates informational stats about percent change in workplace productivity. Here the graph indicates that workplace productivity gets decreased by 1.6 percent in 2020 as compared to 2019 stats. Formulating a presentation can take up a lot of effort and time, so the content and message should always be the primary focus. The visuals of the PowerPoint can enhance the presenters message, so our Improving Corporate Performance Percent Change In Workplace Productivity Inspiration PDF was created to help save time. Instead of worrying about the design, the presenter can concentrate on the message while our designers work on creating the ideal templates for whatever situation is needed. Slidegeeks has experts for everything from amazing designs to valuable content, we have put everything into Improving Corporate Performance Percent Change In Workplace Productivity Inspiration PDF.
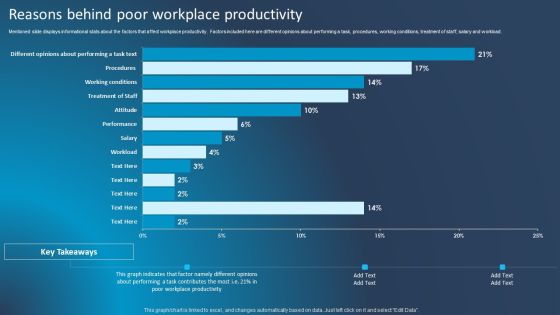
Improving Corporate Performance Reasons Behind Poor Workplace Productivity Designs PDF
Mentioned slide displays informational stats about the factors that affect workplace productivity. Factors included here are different opinions about performing a task, procedures, working conditions, treatment of staff, salary and workload. Coming up with a presentation necessitates that the majority of the effort goes into the content and the message you intend to convey. The visuals of a PowerPoint presentation can only be effective if it supplements and supports the story that is being told. Keeping this in mind our experts created Improving Corporate Performance Reasons Behind Poor Workplace Productivity Designs PDF to reduce the time that goes into designing the presentation. This way, you can concentrate on the message while our designers take care of providing you with the right template for the situation.

Improving Corporate Performance Risk Incidents Encountered And Mitigated By The Firm Topics PDF
Mentioned slide displays status about risk encountered and resolved by the firm in FY20. It includes metrics such as total risks, open, improvising, closed and mitigated. This Improving Corporate Performance Risk Incidents Encountered And Mitigated By The Firm Topics PDF is perfect for any presentation, be it in front of clients or colleagues. It is a versatile and stylish solution for organizing your meetings. The Improving Corporate Performance Risk Incidents Encountered And Mitigated By The Firm Topics PDF features a modern design for your presentation meetings. The adjustable and customizable slides provide unlimited possibilities for acing up your presentation. Slidegeeks has done all the homework before launching the product for you. So, dont wait, grab the presentation templates today.

Deploying And Managing Recurring Customer Churn Rate For Recurring Revenue Introduction PDF
The purpose of the following slide is to show churn rate of the organization of the next 4 years and highlight the strategies that can be used to reduce the churn rate. From laying roadmaps to briefing everything in detail, our templates are perfect for you. You can set the stage with your presentation slides. All you have to do is download these easy-to-edit and customizable templates. Deploying And Managing Recurring Customer Churn Rate For Recurring Revenue Introduction PDF will help you deliver an outstanding performance that everyone would remember and praise you for. Do download this presentation today.

Deploying And Managing Recurring Recurring Revenue Dashboard Designs PDF
The following slide display recurring revenue generated over the year, the following dashboard displays MRR, churn rate net recurring revenue and growth rate. Make sure to capture your audiences attention in your business displays with our gratis customizable Deploying And Managing Recurring Recurring Revenue Dashboard Designs PDF. These are great for business strategies, office conferences, capital raising or task suggestions. If you desire to acquire more customers for your tech business and ensure they stay satisfied, create your own sales presentation with these plain slides.

Deploying And Managing Recurring Subscriber Count Projections Topics PDF
The purpose of the following slide is to provide the projections for the subscriber count for the next 3 years. Welcome to our selection of the Deploying And Managing Recurring Subscriber Count Projections Topics PDF. These are designed to help you showcase your creativity and bring your sphere to life. Planning and Innovation are essential for any business that is just starting out. This collection contains the designs that you need for your everyday presentations. All of our PowerPoints are 100 percent editable, so you can customize them to suit your needs. This multi-purpose template can be used in various situations. Grab these presentation templates today.
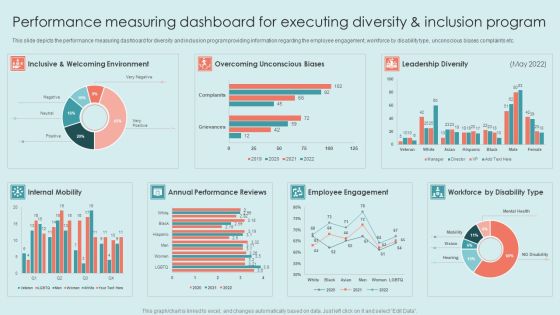
Executing Diversity Performance Measuring Dashboard For Executing Diversity And Inclusion Brochure PDF
This slide depicts the performance measuring dashboard for diversity and inclusion program providing information regarding the employee engagement, workforce by disability type, unconscious biases complaints etc. Crafting an eye-catching presentation has never been more straightforward. Let your presentation shine with this tasteful yet straightforward Executing Diversity Performance Measuring Dashboard For Executing Diversity And Inclusion Brochure PDF template. It offers a minimalistic and classy look that is great for making a statement. The colors have been employed intelligently to add a bit of playfulness while still remaining professional. Construct the ideal Executing Diversity Performance Measuring Dashboard For Executing Diversity And Inclusion Brochure PDF that effortlessly grabs the attention of your audience Begin now and be certain to wow your customers.

Executing Diversity Statistics Of Existing Workplace Executing Diversity Guidelines PDF
This slide illustrates the statistics of existing workplace diversity in terms gender representation overall and department wise, ethnicity in leadership roles, promotion rate etc. This Executing Diversity Statistics Of Existing Workplace Executing Diversity Guidelines PDF is perfect for any presentation, be it in front of clients or colleagues. It is a versatile and stylish solution for organizing your meetings. The Executing Diversity Statistics Of Existing Workplace Executing Diversity Guidelines PDF features a modern design for your presentation meetings. The adjustable and customizable slides provide unlimited possibilities for acing up your presentation. Slidegeeks has done all the homework before launching the product for you. So, dont wait, grab the presentation templates today.

Executing Diversity Workforce Diversity Dashboard Based On Gender And Ethnicity Distribution Rules PDF
This slide represents the diversity dashboard providing information regarding work force distribution on gender and ethnicity. It also includes details of year wise involuntary and voluntary turnover rates. The Executing Diversity Workforce Diversity Dashboard Based On Gender And Ethnicity Distribution Rules PDF is a compilation of the most recent design trends as a series of slides. It is suitable for any subject or industry presentation, containing attractive visuals and photo spots for businesses to clearly express their messages. This template contains a variety of slides for the user to input data, such as structures to contrast two elements, bullet points, and slides for written information. Slidegeeks is prepared to create an impression.

Executing Diversity KPI Dashboard To Monitor Workforce Executing Diversity Structure PDF
This slide illustrates the KPI dashboard for workforce diversity providing details regarding headcount by seniority, gender and gender. It also provides information regarding monthly median age by gender and women at senior level forecast. Presenting this PowerPoint presentation, titled Executing Diversity KPI Dashboard To Monitor Workforce Executing Diversity Structure PDF, with topics curated by our researchers after extensive research. This editable presentation is available for immediate download and provides attractive features when used. Download now and captivate your audience. Presenting this Executing Diversity KPI Dashboard To Monitor Workforce Executing Diversity Structure PDF. Our researchers have carefully researched and created these slides with all aspects taken into consideration. This is a completely customizable Executing Diversity KPI Dashboard To Monitor Workforce Executing Diversity Structure PDF that is available for immediate downloading. Download now and make an impact on your audience. Highlight the attractive features available with our PPTs.
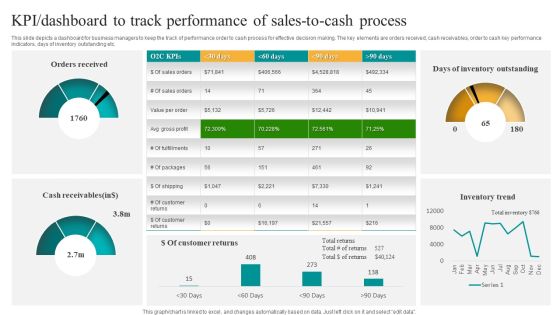
KPI Dashboard To Track Performance Of Sales To Cash Process Download PDF
This slide depicts a dashboard for business managers to keep the track of performance order to cash process for effective decision making. The key elements are orders received, cash receivables, order to cash key performance indicators, days of inventory outstanding etc. Showcasing this set of slides titled KPI Dashboard To Track Performance Of Sales To Cash Process Download PDF. The topics addressed in these templates are Orders Received, Cash Receivables, Days Inventory Outstanding. All the content presented in this PPT design is completely editable. Download it and make adjustments in color, background, font etc. as per your unique business setting.
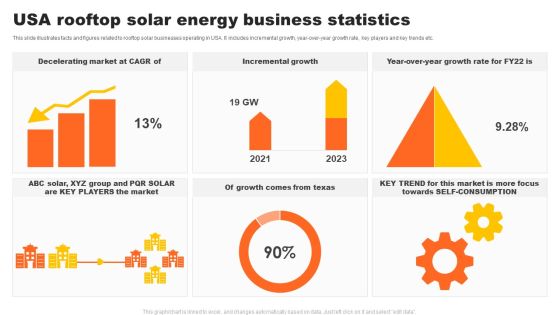
USA Rooftop Solar Energy Business Statistics Brochure PDF
This slide illustrates facts and figures related to rooftop solar businesses operating in USA. It includes incremental growth, year-over-year growth rate, key players and key trends etc. Showcasing this set of slides titled USA Rooftop Solar Energy Business Statistics Brochure PDF. The topics addressed in these templates are Decelerating Market, Incremental Growth, More Focus. All the content presented in this PPT design is completely editable. Download it and make adjustments in color, background, font etc. as per your unique business setting.

Cloud Computing Scalability Cloud Performance Tracking Dashboard Clipart PDF
This slide covers the Key performance indicators for tracking performance of the cloud such as violations break down, sources, rules and severity Present like a pro with Cloud Computing Scalability Cloud Performance Tracking Dashboard Clipart PDF Create beautiful presentations together with your team, using our easy-to-use presentation slides. Share your ideas in real-time and make changes on the fly by downloading our templates. So whether youre in the office, on the go, or in a remote location, you can stay in sync with your team and present your ideas with confidence. With Slidegeeks presentation got a whole lot easier. Grab these presentations today.

Cloud Computing Scalability Model For Workload Placement For On And Off Premises Elements PDF
This slide covers the workload placement such as Workloads shown on the left are marked as off-premises which are more suitable for a public cloud where as those on the right are for on-premises appropriate for a private cloud and those in the middle are for a hybrid cloud. Formulating a presentation can take up a lot of effort and time, so the content and message should always be the primary focus. The visuals of the PowerPoint can enhance the presenters message, so our Cloud Computing Scalability Model For Workload Placement For On And Off Premises Elements PDF was created to help save time. Instead of worrying about the design, the presenter can concentrate on the message while our designers work on creating the ideal templates for whatever situation is needed. Slidegeeks has experts for everything from amazing designs to valuable content, we have put everything into Cloud Computing Scalability Model For Workload Placement For On And Off Premises Elements PDF.

KPI Dashboard To Track Recruitment Process Outsourcing Performance Information PDF
This slide shows KPI dashboard to monitor performance of recruitment process outsourcing. It includes metrics such as total applicants, shortlisted applicants, hired candidates, positions available, etc. Showcasing this set of slides titled KPI Dashboard To Track Recruitment Process Outsourcing Performance Information PDF. The topics addressed in these templates are Shortlisted Candidates, Hired Candidates, Rejected Candidates. All the content presented in this PPT design is completely editable. Download it and make adjustments in color, background, font etc. as per your unique business setting.

USA Recruitment Process Outsourcing Market Size Graph Topics PDF
This slide shows market size of RPO in US market. It includes size of enterprise, on-demand and function based. Showcasing this set of slides titled USA Recruitment Process Outsourcing Market Size Graph Topics PDF. The topics addressed in these templates are RPO Enterprises, Largest Market Size. All the content presented in this PPT design is completely editable. Download it and make adjustments in color, background, font etc. as per your unique business setting.

Deploying SDN System Dashboard For Software Defined Networking SDN Brochure PDF
This slide depicts the dashboard for the software-defined network by covering details of bandwidth administrator, traffic quality, active flows, development tools, completed tasks, wide-area network bandwidth, and G drive. There are so many reasons you need a Deploying SDN System Dashboard For Software Defined Networking SDN Brochure PDF. The first reason is you cant spend time making everything from scratch, Thus, Slidegeeks has made presentation templates for you too. You can easily download these templates from our website easily.

Application Internet Of Things Industry Forecast And Growth Analysis Brochure PDF
The following slide displays application internet of things market review with growth estimates to analyze potential opportunities and threats for the company. It includes estimation on the basis of region, technology, top. Showcasing this set of slides titled Application Internet Of Things Industry Forecast And Growth Analysis Brochure PDF. The topics addressed in these templates are Application Internet, Things Industry, Forecast And Growth Analysis. All the content presented in this PPT design is completely editable. Download it and make adjustments in color, background, font etc. as per your unique business setting.
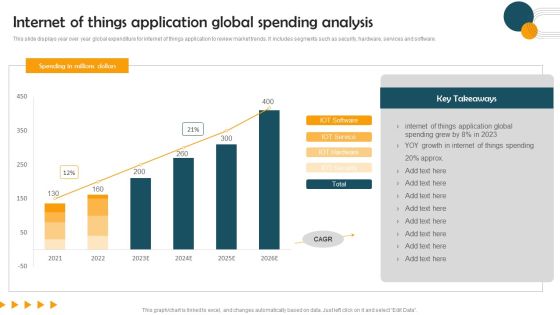
Internet Of Things Application Global Spending Analysis Guidelines PDF
This slide displays year over year global expenditure for internet of things application to review market trends. It includes segments such as security, hardware, services and software. Showcasing this set of slides titled Internet Of Things Application Global Spending Analysis Guidelines PDF. The topics addressed in these templates are Internet Of Things Application, Global Spending Analysis. All the content presented in this PPT design is completely editable. Download it and make adjustments in color, background, font etc. as per your unique business setting.
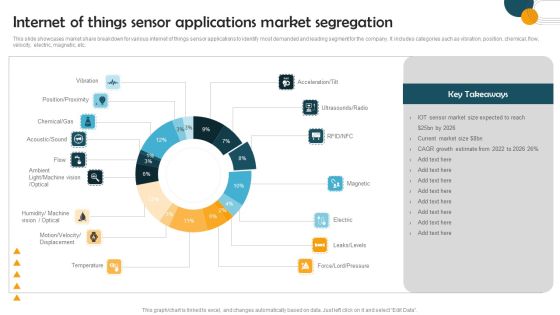
Internet Of Things Sensor Applications Market Segregation Sample PDF
This slide showcases market share breakdown for various internet of things sensor applications to identify most demanded and leading segment for the company. It includes categories such as vibration, position, chemical, flow, velocity, electric, magnetic, etc. Showcasing this set of slides titled Internet Of Things Sensor Applications Market Segregation Sample PDF. The topics addressed in these templates are Internet Things Sensor, Applications Market Segregation. All the content presented in this PPT design is completely editable. Download it and make adjustments in color, background, font etc. as per your unique business setting.
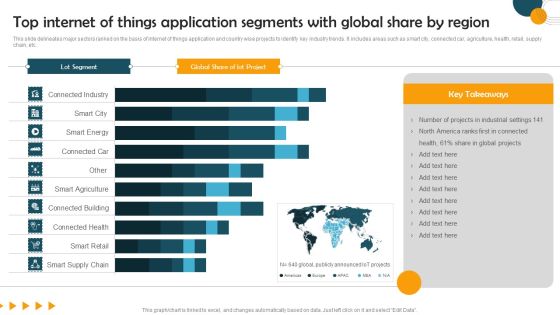
Top Internet Of Things Application Segments With Global Share By Region Formats PDF
This slide delineates major sectors ranked on the basis of internet of things application and country wise projects to identify key industry trends. It includes areas such as smart city, connected car, agriculture, health, retail, supply chain, etc. Pitch your topic with ease and precision using this Top Internet Of Things Application Segments With Global Share By Region Formats PDF. This layout presents information on Lot Segment, Global Share, lot Project. It is also available for immediate download and adjustment. So, changes can be made in the color, design, graphics or any other component to create a unique layout.
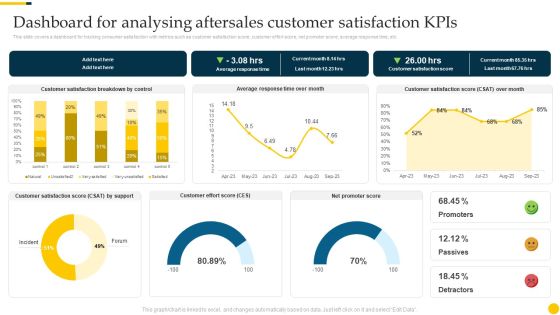
Increasing Customer Dashboard For Analysing Aftersales Customer Satisfaction Kpis Elements PDF
This slide covers a dashboard for tracking consumer satisfaction with metrics such as customer satisfaction score, customer effort score, net promoter score, average response time, etc. The Increasing Customer Dashboard For Analysing Aftersales Customer Satisfaction Kpis Elements PDF is a compilation of the most recent design trends as a series of slides. It is suitable for any subject or industry presentation, containing attractive visuals and photo spots for businesses to clearly express their messages. This template contains a variety of slides for the user to input data, such as structures to contrast two elements, bullet points, and slides for written information. Slidegeeks is prepared to create an impression.

Increasing Customer Impact Of Good Customer Experience On Loyalty Slides PDF
This slide covers the graphical representation of the effect of excellent support services on customer loyalty. It impacts the percentage of customers likely to purchase more, recommend the company, forgive a bad experience, etc. Slidegeeks has constructed Increasing Customer Impact Of Good Customer Experience On Loyalty Slides PDF after conducting extensive research and examination. These presentation templates are constantly being generated and modified based on user preferences and critiques from editors. Here, you will find the most attractive templates for a range of purposes while taking into account ratings and remarks from users regarding the content. This is an excellent jumping-off point to explore our content and will give new users an insight into our top-notch PowerPoint Templates.
Increasing Customer Kpi Dashboard For Tracking Customer Retention Download PDF
This slide covers the dashboard for analyzing customer loyalty with metrics such as NPS, loyal customer rate, premium users, CLV, customer churn, revenue churn, net retention, MRR growth, etc. From laying roadmaps to briefing everything in detail, our templates are perfect for you. You can set the stage with your presentation slides. All you have to do is download these easy-to-edit and customizable templates. Increasing Customer Kpi Dashboard For Tracking Customer Retention Download PDF will help you deliver an outstanding performance that everyone would remember and praise you for. Do download this presentation today.

Client Acquisition Journey Plan Impact 1 Increased Customer Churn Rate Pictures PDF
This slide showcases the negative impact of customer onboarding challenges on the business. The challenges covered are increased user churn rate and number of onboarding support tickets. Make sure to capture your audiences attention in your business displays with our gratis customizable Client Acquisition Journey Plan Impact 1 Increased Customer Churn Rate Pictures PDF. These are great for business strategies, office conferences, capital raising or task suggestions. If you desire to acquire more customers for your tech business and ensure they stay satisfied, create your own sales presentation with these plain slides.

Client Acquisition Journey Plan Impact 2 Decreased Customer Response Topics PDF
This slide showcases the negative impact of customer onboarding challenges on the business. The challenges covered are decreased product adoption and customer response rate. Formulating a presentation can take up a lot of effort and time, so the content and message should always be the primary focus. The visuals of the PowerPoint can enhance the presenters message, so our Client Acquisition Journey Plan Impact 2 Decreased Customer Response Topics PDF was created to help save time. Instead of worrying about the design, the presenter can concentrate on the message while our designers work on creating the ideal templates for whatever situation is needed. Slidegeeks has experts for everything from amazing designs to valuable content, we have put everything into Client Acquisition Journey Plan Impact 2 Decreased Customer Response Topics PDF.

Client Acquisition Journey Plan Impact Of Efficient Customer Onboarding Template PDF
This slide showcases positive impact of proper customer onboarding process. It includes reduced customer churn rate and onboarding support tickets. Coming up with a presentation necessitates that the majority of the effort goes into the content and the message you intend to convey. The visuals of a PowerPoint presentation can only be effective if it supplements and supports the story that is being told. Keeping this in mind our experts created Client Acquisition Journey Plan Impact Of Efficient Customer Onboarding Template PDF to reduce the time that goes into designing the presentation. This way, you can concentrate on the message while our designers take care of providing you with the right template for the situation.

Comprehensive Market Research Guide Analyzing Customer Demographics Through Demonstration PDF
The following slide outlines key performance indicator KPI dashboard outlining customer demographics. Information covered in this slide is related to metrics such as gender, education level, technology adoption life cycle, and brand innovation consent. Create an editable Comprehensive Market Research Guide Analyzing Customer Demographics Through Demonstration PDF that communicates your idea and engages your audience. Whether youre presenting a business or an educational presentation, pre-designed presentation templates help save time. Comprehensive Market Research Guide Analyzing Customer Demographics Through Demonstration PDF is highly customizable and very easy to edit, covering many different styles from creative to business presentations. Slidegeeks has creative team members who have crafted amazing templates. So, go and get them without any delay.

Comprehensive Market Research Guide Fictional Representation Of Our Customer Persona Demonstration PDF
Find highly impressive Comprehensive Market Research Guide Fictional Representation Of Our Customer Persona Demonstration PDF on Slidegeeks to deliver a meaningful presentation. You can save an ample amount of time using these presentation templates. No need to worry to prepare everything from scratch because Slidegeeks experts have already done a huge research and work for you. You need to download Comprehensive Market Research Guide Fictional Representation Of Our Customer Persona Demonstration PDF for your upcoming presentation. All the presentation templates are 100 percent editable and you can change the color and personalize the content accordingly. Download now.
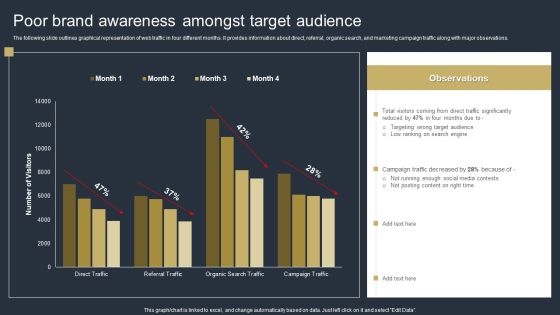
Comprehensive Market Research Guide Poor Brand Awareness Amongst Target Audience Template PDF
The following slide outlines graphical representation of web traffic in four different months. It provides information about direct, referral, organic search, and marketing campaign traffic along with major observations. Do you have to make sure that everyone on your team knows about any specific topic I yes, then you should give Comprehensive Market Research Guide Poor Brand Awareness Amongst Target Audience Template PDF a try. Our experts have put a lot of knowledge and effort into creating this impeccable Comprehensive Market Research Guide Poor Brand Awareness Amongst Target Audience Template PDF. You can use this template for your upcoming presentations, as the slides are perfect to represent even the tiniest detail. You can download these templates from the Slidegeeks website and these are easy to edit. So grab these today.

Customer Support Services Customer Support Service Analysis Dashboard Rules PDF
This slide exhibits customer service dashboard to improve visibility. The dashboard includes resolved and active cases, incoming cases by subject, priority, SLA status and age, CSAT and escalated case volume. Make sure to capture your audiences attention in your business displays with our gratis customizable Customer Support Services Customer Support Service Analysis Dashboard Rules PDF. These are great for business strategies, office conferences, capital raising or task suggestions. If you desire to acquire more customers for your tech business and ensure they stay satisfied, create your own sales presentation with these plain slides.

Customer Support Services Dashboard Depicting Performance Metrics Of Customer Designs PDF
This slide showcases dashboard depicting major customer service KPIs. The performance metrics covered are search exit rate, CSAT, average first response time, tickets solved, etc. Coming up with a presentation necessitates that the majority of the effort goes into the content and the message you intend to convey. The visuals of a PowerPoint presentation can only be effective if it supplements and supports the story that is being told. Keeping this in mind our experts created Customer Support Services Dashboard Depicting Performance Metrics Of Customer Designs PDF to reduce the time that goes into designing the presentation. This way, you can concentrate on the message while our designers take care of providing you with the right template for the situation.

Customer Support Services Impact 1 Decline In Average Response Time Portrait PDF
This slide showcases the impact of good support service on the company. The metrics covered are average response time and first call resolution. This Customer Support Services Impact 1 Decline In Average Response Time Portrait PDF is perfect for any presentation, be it in front of clients or colleagues. It is a versatile and stylish solution for organizing your meetings. The Customer Support Services Impact 1 Decline In Average Response Time Portrait PDF features a modern design for your presentation meetings. The adjustable and customizable slides provide unlimited possibilities for acing up your presentation. Slidegeeks has done all the homework before launching the product for you. So, dont wait, grab the presentation templates today

Customer Support Services Impact 3 Increase In Customer Retention Rate Sample PDF
This slide showcases the impact of good support service on the company. The metrics covered are customer satisfaction and retention. Explore a selection of the finest Customer Support Services Impact 3 Increase In Customer Retention Rate Sample PDF here. With a plethora of professionally designed and pre-made slide templates, you can quickly and easily find the right one for your upcoming presentation. You can use our Customer Support Services Impact 3 Increase In Customer Retention Rate Sample PDF to effectively convey your message to a wider audience. Slidegeeks has done a lot of research before preparing these presentation templates. The content can be personalized and the slides are highly editable. Grab templates today from Slidegeeks.
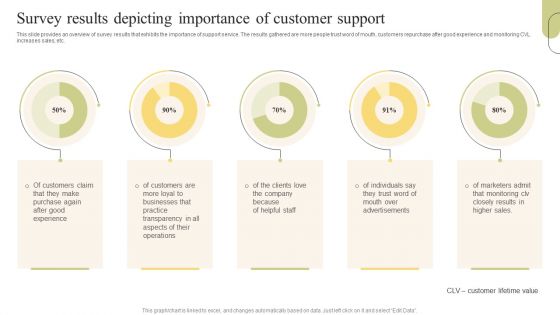
Customer Support Services Survey Results Depicting Importance Of Customer Support Professional PDF
This slide provides an overview of survey results that exhibits the importance of support service. The results gathered are more people trust word of mouth, customers repurchase after good experience and monitoring CVL increases sales, etc. Want to ace your presentation in front of a live audience Our Customer Support Services Survey Results Depicting Importance Of Customer Support Professional PDF can help you do that by engaging all the users towards you. Slidegeeks experts have put their efforts and expertise into creating these impeccable powerpoint presentations so that you can communicate your ideas clearly. Moreover, all the templates are customizable, and easy-to-edit and downloadable. Use these for both personal and commercial use.

Deployment Of Business Process Customer Churn Rate For Last Four Years Formats PDF
This slide shows the customer churn rate for last four consecutive years due to poor customer service, insufficient inventory, etc. that results in losing customers which in turn impact company goodwill. Want to ace your presentation in front of a live audience Our Deployment Of Business Process Customer Churn Rate For Last Four Years Formats PDF can help you do that by engaging all the users towards you.. Slidegeeks experts have put their efforts and expertise into creating these impeccable powerpoint presentations so that you can communicate your ideas clearly. Moreover, all the templates are customizable, and easy-to-edit and downloadable. Use these for both personal and commercial use.

Deployment Of Business Process Dashboard To Measure Business Financial Performance Microsoft PDF
This slide shows the dashboard to measure business financial performance which focuses on revenues, debt to equity, net profit margin, gross profit margin and return on equity. Do you have to make sure that everyone on your team knows about any specific topic I yes, then you should give Deployment Of Business Process Dashboard To Measure Business Financial Performance Microsoft PDF a try. Our experts have put a lot of knowledge and effort into creating this impeccable Deployment Of Business Process Dashboard To Measure Business Financial Performance Microsoft PDF. You can use this template for your upcoming presentations, as the slides are perfect to represent even the tiniest detail. You can download these templates from the Slidegeeks website and these are easy to edit. So grab these today.

Guide For Systematic Performance Metrics Dashboard To Track Overall Rebranding Background PDF
This slide provides information regarding essential characteristics of co-branding in terms of strategic partnership, build credibility, developing marketing strategy, develop innovation and value addition, etc. Formulating a presentation can take up a lot of effort and time, so the content and message should always be the primary focus. The visuals of the PowerPoint can enhance the presenters message, so our Guide For Systematic Performance Metrics Dashboard To Track Overall Rebranding Background PDF was created to help save time. Instead of worrying about the design, the presenter can concentrate on the message while our designers work on creating the ideal templates for whatever situation is needed. Slidegeeks has experts for everything from amazing designs to valuable content, we have put everything into Guide For Systematic Performance Metrics Dashboard To Track Overall Rebranding Background PDF.
Strengthen Customer Relation Overall Brand Performance Tracking Dashboard Portrait PDF
This slide provides information regarding brand performance tracking dashboard capturing KPIs such as brand metric, brand commitment, advertising metrics, and purchase metrics. Find a pre-designed and impeccable Strengthen Customer Relation Overall Brand Performance Tracking Dashboard Portrait PDF. The templates can ace your presentation without additional effort. You can download these easy-to-edit presentation templates to make your presentation stand out from others. So, what are you waiting for Download the template from Slidegeeks today and give a unique touch to your presentation.

Chief Executive Dashboards With Financial Topics PDF
This slide represents the dashboard for the CEO to track the global financial performance of the organization. It includes key performance indicators such as revenue, quick ratio, short term assets etc. Showcasing this set of slides titled Chief Executive Dashboards With Financial Topics PDF. The topics addressed in these templates are Short Term Assets, Global Financial Performance, Debt Equity. All the content presented in this PPT design is completely editable. Download it and make adjustments in color, background, font etc. as per your unique business setting.

Executive Dashboards To Track Sales Performance Guidelines PDF
This slide represents the CEO dashboard for tracking the sales performance of the organization. It includes key performance indicators such as gross, operating and net profit, sales amount by category, income statement etc. Pitch your topic with ease and precision using this Executive Dashboards To Track Sales Performance Guidelines PDF. This layout presents information on Income Statement, Monthly Sales Growth, Days Receivable Outstanding. It is also available for immediate download and adjustment. So, changes can be made in the color, design, graphics or any other component to create a unique layout.
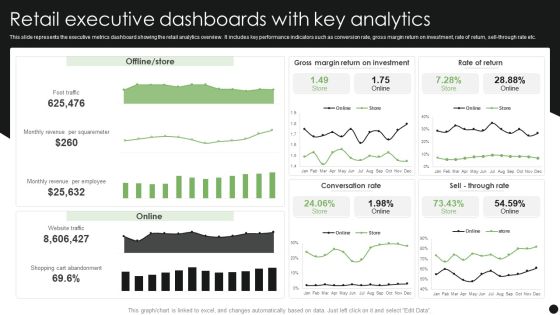
Retail Executive Dashboards With Key Analytics Guidelines PDF
Pitch your topic with ease and precision using this Retail Executive Dashboards With Key Analytics Guidelines PDF. This layout presents information on Retail Executive Dashboards, Key Analytics. It is also available for immediate download and adjustment. So, changes can be made in the color, design, graphics or any other component to create a unique layout.

Deploying Cyber Security Incident Response Administration Consequences Of Data Breaches Portrait PDF
This slide represents the impact of data breaches experienced by an enterprise. It includes data breaches of hacking, unintended disclosure, physical loss, payment card fraud etc. Do you have to make sure that everyone on your team knows about any specific topic I yes, then you should give Deploying Cyber Security Incident Response Administration Consequences Of Data Breaches Portrait PDF a try. Our experts have put a lot of knowledge and effort into creating this impeccable Deploying Cyber Security Incident Response Administration Consequences Of Data Breaches Portrait PDF. You can use this template for your upcoming presentations, as the slides are perfect to represent even the tiniest detail. You can download these templates from the Slidegeeks website and these are easy to edit. So grab these today.

Deploying Cyber Security Incident Response Administration Cyber Attacks Faced By The Company Sample PDF
This slide represents the attacks faced by the organization which led to theft of confidential data and sensitive information of the organization. It represents the increase in ransomware and phishing attacks experienced by the enterprise within 5 years. Get a simple yet stunning designed Deploying Cyber Security Incident Response Administration Cyber Attacks Faced By The Company Sample PDF. It is the best one to establish the tone in your meetings. It is an excellent way to make your presentations highly effective. So, download this PPT today from Slidegeeks and see the positive impacts. Our easy to edit Deploying Cyber Security Incident Response Administration Cyber Attacks Faced By The Company Sample PDF can be your go to option for all upcoming conferences and meetings. So, what are you waiting for Grab this template today.

Deploying Cyber Security Incident Response Administration Cyber Security Risk Assessment Portrait PDF
This slide represents the dashboard to assess, analyze and manage the cyber security risks within an organization. It includes details related to directories with direct access, inactive accounts etc. Present like a pro with Deploying Cyber Security Incident Response Administration Cyber Security Risk Assessment Portrait PDF Create beautiful presentations together with your team, using our easy to use presentation slides. Share your ideas in real time and make changes on the fly by downloading our templates. So whether you are in the office, on the go, or in a remote location, you can stay in sync with your team and present your ideas with confidence. With Slidegeeks presentation got a whole lot easier. Grab these presentations today.

Deploying Cyber Security Incident Response Administration Cyber Security Systems Monitoring Report Microsoft PDF
This slide represents the report to effectively monitor the networks and systems of the organization. It includes KPIs such as total intrusion attempts, mean detect team, mean resolve time etc. Slidegeeks is here to make your presentations a breeze with Deploying Cyber Security Incident Response Administration Cyber Security Systems Monitoring Report Microsoft PDF With our easy to use and customizable templates, you can focus on delivering your ideas rather than worrying about formatting. With a variety of designs to choose from, you are sure to find one that suits your needs. And with animations and unique photos, illustrations, and fonts, you can make your presentation pop. So whether you are giving a sales pitch or presenting to the board, make sure to check out Slidegeeks first.

Information Security Risk Evaluation Dashboard For Data Privacy Introduction PDF
This slide depicts the risk evaluation dashboard for data privacy based on audits with open findings, GDPR processing per region, control and measure trends, average response time. There are so many reasons you need a Information Security Risk Evaluation Dashboard For Data Privacy Introduction PDF. The first reason is you can not spend time making everything from scratch, Thus, Slidegeeks has made presentation templates for you too. You can easily download these templates from our website easily.
Tracking Social Media Content Reach For Better Campaign Results Inspiration PDF
This slide covers an overview of social media content reach to identify the number of people who see your content, either ads or posts. It also includes improvement strategies such as producing high-quality content, increasing the number of images, etc. If your project calls for a presentation, then Slidegeeks is your go to partner because we have professionally designed, easy to edit templates that are perfect for any presentation. After downloading, you can easily edit Tracking Social Media Content Reach For Better Campaign Results Inspiration PDF and make the changes accordingly. You can rearrange slides or fill them with different images. Check out all the handy templates.
KPI Dashboard For Tracking Email Marketing Campaign Performance Microsoft PDF
This slide covers the dashboard for analysing email marketing metrics such as overall open rate, click-through rate, click to open ratio, unsubscribe rate, hard bounce rate, soft rate, monthly open rate, total monthly subscribers, etc. Presenting this PowerPoint presentation, titled KPI Dashboard For Tracking Email Marketing Campaign Performance Microsoft PDF, with topics curated by our researchers after extensive research. This editable presentation is available for immediate download and provides attractive features when used. Download now and captivate your audience. Presenting this KPI Dashboard For Tracking Email Marketing Campaign Performance Microsoft PDF. Our researchers have carefully researched and created these slides with all aspects taken into consideration. This is a completely customizable KPI Dashboard For Tracking Email Marketing Campaign Performance Microsoft PDF that is available for immediate downloading. Download now and make an impact on your audience. Highlight the attractive features available with our PPTs.
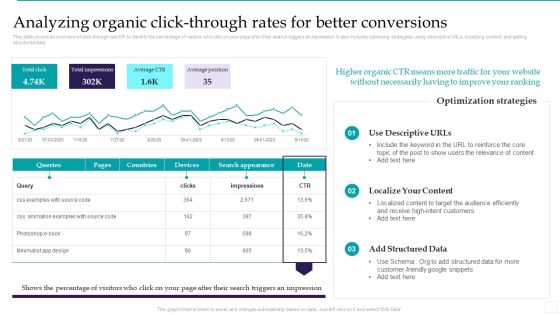
Optimizing Marketing Analytics To Enhance Organizational Growth Analyzing Organic Click Through Rates Elements PDF
This slide covers an overview of click through rate KPI to identify the percentage of visitors who click on your page after their search triggers an impression. It also includes optimizing strategies, using descriptive URLs, localizing content, and adding structured data. This Optimizing Marketing Analytics To Enhance Organizational Growth Analyzing Organic Click Through Rates Elements PDF from Slidegeeks makes it easy to present information on your topic with precision. It provides customization options, so you can make changes to the colors, design, graphics, or any other component to create a unique layout. It is also available for immediate download, so you can begin using it right away. Slidegeeks has done good research to ensure that you have everything you need to make your presentation stand out. Make a name out there for a brilliant performance.
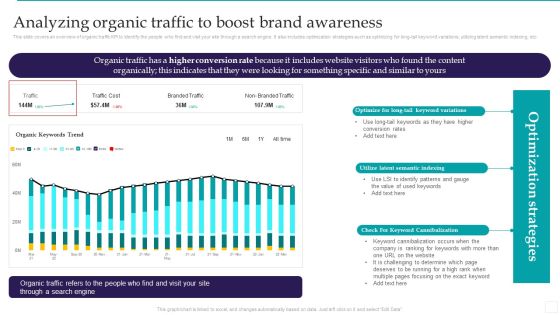
Optimizing Marketing Analytics To Enhance Organizational Growth Analyzing Organic Traffic To Boost Brand Ideas PDF
This slide covers an overview of organic traffic KPI to identify the people who find and visit your site through a search engine. It also includes optimization strategies such as optimizing for long tail keyword variations, utilizing latent semantic indexing, etc. Take your projects to the next level with our ultimate collection of Optimizing Marketing Analytics To Enhance Organizational Growth Analyzing Organic Traffic To Boost Brand Ideas PDF. Slidegeeks has designed a range of layouts that are perfect for representing task or activity duration, keeping track of all your deadlines at a glance. Tailor these designs to your exact needs and give them a truly corporate look with your own brand colors they will make your projects stand out from the rest.
Optimizing Marketing Analytics To Enhance Organizational Growth KPI Dashboard For Tracking Paid Ad Campaign Template PDF
This slide covers the KPI dashboard for analyzing SEO metrics such as authority score, organic traffic, organic keywords, paid keywords, ref. Domains, site audit, link-building tool, organic traffic, on-page SEO checker, backlink audit, etc. There are so many reasons you need a Optimizing Marketing Analytics To Enhance Organizational Growth KPI Dashboard For Tracking Paid Ad Campaign Template PDF. The first reason is you can not spend time making everything from scratch, Thus, Slidegeeks has made presentation templates for you too. You can easily download these templates from our website easily.

Optimizing Marketing Analytics To Enhance Organizational Growth Pre And Post Market Analytics Microsoft PDF
This slide covers a graphical representation of marketing analytics impact on various business aspects such as customer lifetime value, employee engagement, improvement in customer effort score, and average profit margin per customer. Get a simple yet stunning designed Optimizing Marketing Analytics To Enhance Organizational Growth Pre And Post Market Analytics Microsoft PDF. It is the best one to establish the tone in your meetings. It is an excellent way to make your presentations highly effective. So, download this PPT today from Slidegeeks and see the positive impacts. Our easy to edit Optimizing Marketing Analytics To Enhance Organizational Growth Pre And Post Market Analytics Microsoft PDF can be your go to option for all upcoming conferences and meetings. So, what are you waiting for Grab this template today.

Optimizing Marketing Analytics To Enhance Organizational Growth Social Media Analytics KPI Dashboard Graphics PDF
This slide covers a dashboard for tracking social media KPIs such as face engagements, total likes, followers, audience growth, YouTube subscribers, views, Instagram reach and , likes, LinkedIn impressions, etc. From laying roadmaps to briefing everything in detail, our templates are perfect for you. You can set the stage with your presentation slides. All you have to do is download these easy to edit and customizable templates. Optimizing Marketing Analytics To Enhance Organizational Growth Social Media Analytics KPI Dashboard Graphics PDF will help you deliver an outstanding performance that everyone would remember and praise you for. Do download this presentation today.

Optimizing Marketing Analytics To Enhance Organizational Growth Top Marketing Analytics Challenges Topics PDF
This slide covers significant issues faced by organizations while using marketing analytics. It includes problems such as collecting the correct data, determining how to use data, identifying the correct KPIs, converting leads to revenue, and identifying market trends. Present like a pro with Optimizing Marketing Analytics To Enhance Organizational Growth Top Marketing Analytics Challenges Topics PDF Create beautiful presentations together with your team, using our easy to use presentation slides. Share your ideas in real time and make changes on the fly by downloading our templates. So whether you are in the office, on the go, or in a remote location, you can stay in sync with your team and present your ideas with confidence. With Slidegeeks presentation got a whole lot easier. Grab these presentations today.
Optimizing Marketing Analytics To Enhance Organizational Growth Tracking Social Media Engagement Rate Sample PDF
This slide covers an overview of the social media engagement rate to identify if the content is reaching the target audience. It also includes improvement strategies such as having a consistent, authentic voice, knowing your algorithms, and creating shareable content. Slidegeeks is here to make your presentations a breeze with Optimizing Marketing Analytics To Enhance Organizational Growth Tracking Social Media Engagement Rate Sample PDF With our easy to use and customizable templates, you can focus on delivering your ideas rather than worrying about formatting. With a variety of designs to choose from, you are sure to find one that suits your needs. And with animations and unique photos, illustrations, and fonts, you can make your presentation pop. So whether you are giving a sales pitch or presenting to the board, make sure to check out Slidegeeks first.
Optimizing Marketing Analytics To Enhance Organizational Growth Website Landing Page KPI Tracking Dashboard Graphics PDF
This slide covers a dashboard for analysing the metrics of the website landing page. It includes KPIs such as conversions, conversion rate, sessions, bounce rate, engagement sickness, etc. Do you have an important presentation coming up Are you looking for something that will make your presentation stand out from the rest Look no further than Optimizing Marketing Analytics To Enhance Organizational Growth Website Landing Page KPI Tracking Dashboard Graphics PDF. With our professional designs, you can trust that your presentation will pop and make delivering it a smooth process. And with Slidegeeks, you can trust that your presentation will be unique and memorable. So why wait Grab Optimizing Marketing Analytics To Enhance Organizational Growth Website Landing Page KPI Tracking Dashboard Graphics PDF today and make your presentation stand out from the rest.
Predictive Analytics Model Performance Tracking Dashboard Forward Looking Analysis IT Introduction PDF
This slide represents the predictive analytics model performance tracking dashboard, and it covers the details of total visitors, total buyers, total products added to the cart, filters by date and category, visitors to clients conversion rate, and so on.The Predictive Analytics Model Performance Tracking Dashboard Forward Looking Analysis IT Introduction PDF is a compilation of the most recent design trends as a series of slides. It is suitable for any subject or industry presentation, containing attractive visuals and photo spots for businesses to clearly express their messages. This template contains a variety of slides for the user to input data, such as structures to contrast two elements, bullet points, and slides for written information. Slidegeeks is prepared to create an impression.

Dashboard To Track Product Sales Performance Gaining Competitive Advantage And Capturing Sample PDF
This slide showcases dashboard that can help organization to analyse the sales of product after entering into niche market. Its key elements are sales, sales target, sales growth, sales by channel, inventory days outstanding etc. Crafting an eye-catching presentation has never been more straightforward. Let your presentation shine with this tasteful yet straightforward Dashboard To Track Product Sales Performance Gaining Competitive Advantage And Capturing Sample PDF template. It offers a minimalistic and classy look that is great for making a statement. The colors have been employed intelligently to add a bit of playfulness while still remaining professional. Construct the ideal Dashboard To Track Product Sales Performance Gaining Competitive Advantage And Capturing Sample PDF that effortlessly grabs the attention of your audience Begin now and be certain to wow your customers.

Dashboard To Track Website And Application Traffic Gaining Competitive Advantage And Capturing Guidelines PDF
This slide showcases dashboard that can help organization to evaluate the traffic of website and application after entering into niche market. Its key elements are users, conversions, conversion by event type and engagement rate.Make sure to capture your audiences attention in your business displays with our gratis customizable Dashboard To Track Website And Application Traffic Gaining Competitive Advantage And Capturing Guidelines PDF. These are great for business strategies, office conferences, capital raising or task suggestions. If you desire to acquire more customers for your tech business and ensure they stay satisfied, create your own sales presentation with these plain slides.

Growth Rate Of Market In Target Geography Gaining Competitive Advantage And Capturing Slides PDF
This slide showcases market growth rate in target geography which can help organization to estimate profit potential. It also showcases potential growth for next two financial years. Explore a selection of the finest Growth Rate Of Market In Target Geography Gaining Competitive Advantage And Capturing Slides PDF here. With a plethora of professionally designed and pre-made slide templates, you can quickly and easily find the right one for your upcoming presentation. You can use our Growth Rate Of Market In Target Geography Gaining Competitive Advantage And Capturing Slides PDF to effectively convey your message to a wider audience. Slidegeeks has done a lot of research before preparing these presentation templates. The content can be personalized and the slides are highly editable. Grab templates today from Slidegeeks.

Target Market Growth Across Different Geographies Gaining Competitive Advantage Summary PDF
This slide showcases growth of target market in different geographies which can help organization to estimate growth potential. Its key elements are region, market growth and amount.From laying roadmaps to briefing everything in detail, our templates are perfect for you. You can set the stage with your presentation slides. All you have to do is download these easy-to-edit and customizable templates. Target Market Growth Across Different Geographies Gaining Competitive Advantage Summary PDF will help you deliver an outstanding performance that everyone would remember and praise you for. Do download this presentation today.

Sample Box And Whisker Plot For Two Year Quality Control Planning Templates Set 1 Download PDF
Following slide illustrates sample two-year sales comparison box and whisker plot along with key takeaways. Users can edit it as per their requirement.Find highly impressive Sample Box And Whisker Plot For Two Year Quality Control Planning Templates Set 1 Download PDF on Slidegeeks to deliver a meaningful presentation. You can save an ample amount of time using these presentation templates. No need to worry to prepare everything from scratch because Slidegeeks experts have already done a huge research and work for you. You need to download Sample Box And Whisker Plot For Two Year Quality Control Planning Templates Set 1 Download PDF for your upcoming presentation. All the presentation templates are 100precent editable and you can change the color and personalize the content accordingly. Download now,
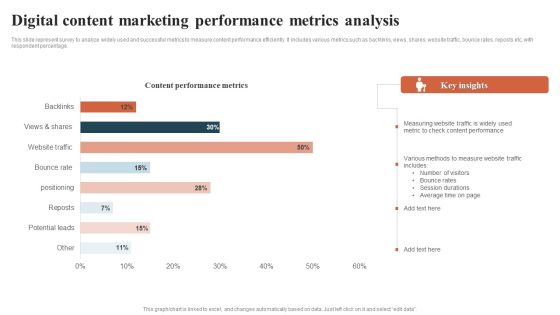
Digital Content Marketing Performance Metrics Analysis Introduction PDF
This slide represent survey to analyze widely used and successful metrics to measure content performance efficiently. It includes various metrics such as backlinks, views, shares, website traffic, bounce rates, reposts etc. with respondent percentage. Showcasing this set of slides titled Digital Content Marketing Performance Metrics Analysis Introduction PDF. The topics addressed in these templates are Digital Content Marketing, Performance Metrics Analysis. All the content presented in this PPT design is completely editable. Download it and make adjustments in color, background, font etc. as per your unique business setting.
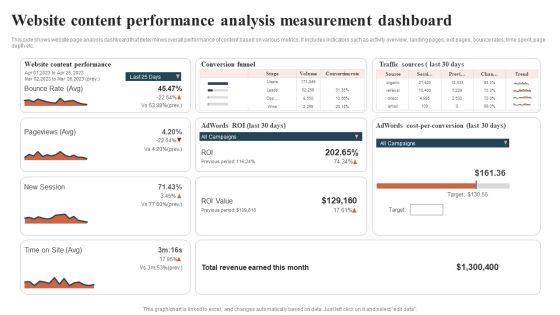
Website Content Performance Analysis Measurement Dashboard Guidelines PDF
This side shows website page analysis dashboard that determines overall performance of content based on various metrics. It includes indicators such as activity overview, landing pages, exit pages, bounce rates, time spent, page depth etc. Showcasing this set of slides titled Website Content Performance Analysis Measurement Dashboard Guidelines PDF. The topics addressed in these templates are Conversion Funnel, Traffic Sources, Total Revenue. All the content presented in this PPT design is completely editable. Download it and make adjustments in color, background, font etc. as per your unique business setting.

Business Project Risk Management KPI Dashboard Inspiration PDF
This slide depicts risk management dashboard for business projects. It provides information about compliant, non-compliant, business units, applications, project management office, etc. Showcasing this set of slides titled Business Project Risk Management KPI Dashboard Inspiration PDF. The topics addressed in these templates areProject Risk Compliance, Project Risk Status, Business Units . All the content presented in this PPT design is completely editable. Download it and make adjustments in color, background, font etc. as per your unique business setting.
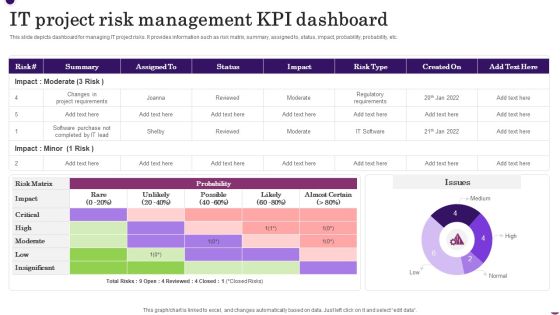
IT Project Risk Management KPI Dashboard Clipart PDF
This slide depicts dashboard for managing IT project risks. It provides information such as risk matrix, summary, assigned to, status, impact, probability, probability, etc. Pitch your topic with ease and precision using this IT Project Risk Management KPI Dashboard Clipart PDF. This layout presents information on Regulatory Requirements, Changes In Project Requirements. It is also available for immediate download and adjustment. So, changes can be made in the color, design, graphics or any other component to create a unique layout.
Project Management Risk Tracking KPI Dashboard Pictures PDF
Showcasing this set of slides titled Project Management Risk Tracking KPI Dashboard Pictures PDF. The topics addressed in these templates are Overdue Risk, Average Age, Number Of Risk. All the content presented in this PPT design is completely editable. Download it and make adjustments in color, background, font etc. as per your unique business setting.
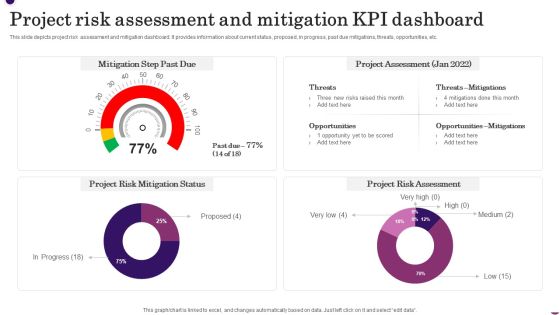
Project Risk Assessment And Mitigation KPI Dashboard Summary PDF
Pitch your topic with ease and precision using this Project Risk Assessment And Mitigation KPI Dashboard Summary PDF. This layout presents information on Mitigation Step Past Due, Project Assessment, Mitigation Status, Project Risk Assessment. It is also available for immediate download and adjustment. So, changes can be made in the color, design, graphics or any other component to create a unique layout.

Project Risk Management Progress KPI Dashboard Template PDF
This slide depicts project risk management progress dashboard. It provides information about key performance indicators, risks, issues, planned and actual hours spent, etc. Pitch your topic with ease and precision using this Project Risk Management Progress KPI Dashboard Template PDF. This layout presents information on Current Progress, Risk And Issues. It is also available for immediate download and adjustment. So, changes can be made in the color, design, graphics or any other component to create a unique layout.

Statistical Presentation Of Staff Engagement Plan Inspiration PDF
The following slide showcases statistics for building employee engagement and ensuring that everything they do is infused with purpose. It presents information related to recognition, technology, etc. Showcasing this set of slides titled Statistical Presentation Of Staff Engagement Plan Inspiration PDF. The topics addressed in these templates are Communications Are Effective, Engagement Plan All the content presented in this PPT design is completely editable. Download it and make adjustments in color, background, font etc. as per your unique business setting.

Software Application Marketing Data Analytics Report Mockup PDF
This slide shows app marketing analytics dashboard to gauge how well the marketing efforts are performing. It includes parameters like non organic content, organic content attribution,reengegement. Showcasing this set of slides titled Software Application Marketing Data Analytics Report Mockup PDF. The topics addressed in these templates are Software Application, Marketing Data, Analytics Report. All the content presented in this PPT design is completely editable. Download it and make adjustments in color, background, font etc. as per your unique business setting.

Competitive Analysis Of Major Players Existing Across Marketplace Demonstration PDF
This slide provides information regarding comparative analysis of potential players existing across marketplace. The points of differentiation include financial parameters, critical success factors such as product variety, customer services, email marketing, etc. There are so many reasons you need a Competitive Analysis Of Major Players Existing Across Marketplace Demonstration PDF. The first reason is you can not spend time making everything from scratch, Thus, Slidegeeks has made presentation templates for you too. You can easily download these templates from our website easily.

Amazon Business Strategies To Gain Competitive Advantage Assessing Consumer Traffic Across Clipart PDF
This slide provides information regarding user traffic analysis across Amazon by tracking traffic trends, desktop and mobile traffic share and traffic generation strategy. Here you can discover an assortment of the finest PowerPoint and Google Slides templates. With these templates, you can create presentations for a variety of purposes while simultaneously providing your audience with an eye catching visual experience. Download Amazon Business Strategies To Gain Competitive Advantage Assessing Consumer Traffic Across Clipart PDF to deliver an impeccable presentation. These templates will make your job of preparing presentations much quicker, yet still, maintain a high level of quality. Slidegeeks has experienced researchers who prepare these templates and write high quality content for you. Later on, you can personalize the content by editing the Amazon Business Strategies To Gain Competitive Advantage Assessing Consumer Traffic Across Clipart PDF.

Amazon Business Strategies To Gain Competitive Advantage KPI Dashboard To Track Amazon Background PDF
This slide provides information regarding dashboard to monitor Amazon performance. The KPIs include tracking of product sales, conversion rate, advertising spends, session, organic sales, etc. Do you have to make sure that everyone on your team knows about any specific topic I yes, then you should give Amazon Business Strategies To Gain Competitive Advantage KPI Dashboard To Track Amazon Background PDF a try. Our experts have put a lot of knowledge and effort into creating this impeccable Amazon Business Strategies To Gain Competitive Advantage KPI Dashboard To Track Amazon Background PDF. You can use this template for your upcoming presentations, as the slides are perfect to represent even the tiniest detail. You can download these templates from the Slidegeeks website and these are easy to edit. So grab these today.

Amazon Business Strategies To Gain Competitive Advantage Performance Report Mockup PDF
This slide provides information regarding Amazon platform growth performance analysis report. The progress is determined by products sold on platform, increase in ad spend, active sellers, advertising growth, etc. Get a simple yet stunning designed Amazon Business Strategies To Gain Competitive Advantage Performance Report Mockup PDF. It is the best one to establish the tone in your meetings. It is an excellent way to make your presentations highly effective. So, download this PPT today from Slidegeeks and see the positive impacts. Our easy to edit Amazon Business Strategies To Gain Competitive Advantage Performance Report Mockup PDF can be your go to option for all upcoming conferences and meetings. So, what are you waiting for Grab this template today.

Financial Assessment Growth In Revenues Across Amazon Infographics PDF
This slide provides information regarding the financial analysis of Amazon in terms of growth in revenues. The firm focused on launching offerings across various markets in order to increase sales and better conversions. Slidegeeks is here to make your presentations a breeze with Financial Assessment Growth In Revenues Across Amazon Infographics PDF With our easy to use and customizable templates, you can focus on delivering your ideas rather than worrying about formatting. With a variety of designs to choose from, you are sure to find one that suits your needs. And with animations and unique photos, illustrations, and fonts, you can make your presentation pop. So whether you are giving a sales pitch or presenting to the board, make sure to check out Slidegeeks first.
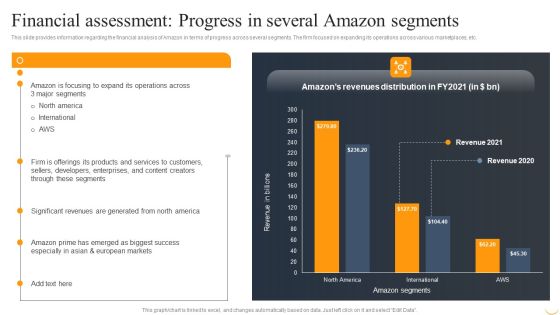
Financial Assessment Progress In Several Amazon Segments Summary PDF
This slide provides information regarding the financial analysis of Amazon in terms of progress across several segments. The firm focused on expanding its operations across various marketplaces, etc. Do you have an important presentation coming up Are you looking for something that will make your presentation stand out from the rest Look no further than Financial Assessment Progress In Several Amazon Segments Summary PDF. With our professional designs, you can trust that your presentation will pop and make delivering it a smooth process. And with Slidegeeks, you can trust that your presentation will be unique and memorable. So why wait Grab Financial Assessment Progress In Several Amazon Segments Summary PDF today and make your presentation stand out from the rest.
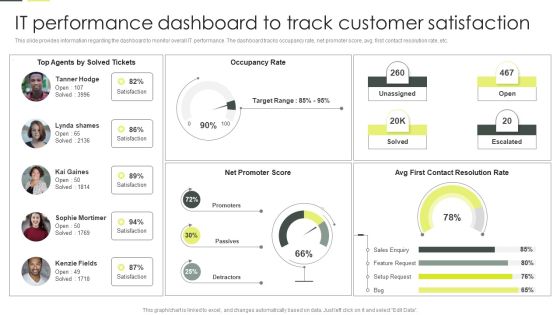
Building An IT Strategy Plan For Business Expansion IT Performance Dashboard To Track Customer Satisfaction Download PDF
This slide provides information regarding the dashboard to monitor overall IT performance. The dashboard tracks occupancy rate, net promoter score, avg. first contact resolution rate, etc. Find a pre designed and impeccable Building An IT Strategy Plan For Business Expansion IT Performance Dashboard To Track Customer Satisfaction Download PDF. The templates can ace your presentation without additional effort. You can download these easy to edit presentation templates to make your presentation stand out from others. So, what are you waiting for Download the template from Slidegeeks today and give a unique touch to your presentation.

B2b Ecommerce Dashboard To Track Website Performance Comprehensive Guide For Developing Sample PDF
This slide represents metric dashboard to track and analyze b2b ecommerce website performance. It covers total user visits, sales, average return per user etc.Find a pre-designed and impeccable B2b Ecommerce Dashboard To Track Website Performance Comprehensive Guide For Developing Sample PDF. The templates can ace your presentation without additional effort. You can download these easy-to-edit presentation templates to make your presentation stand out from others. So, what are you waiting for Download the template from Slidegeeks today and give a unique touch to your presentation.

B2b Ecommerce Market Segmentation By Product Type Comprehensive Guide For Developing Formats PDF
This slide represents b2b ecommerce market division on the basis of type of product. it covers consumer electronics, automotive, personal care, clothing, sports etc.Want to ace your presentation in front of a live audience Our B2b Ecommerce Market Segmentation By Product Type Comprehensive Guide For Developing Formats PDF can help you do that by engaging all the users towards you.. Slidegeeks experts have put their efforts and expertise into creating these impeccable powerpoint presentations so that you can communicate your ideas clearly. Moreover, all the templates are customizable, and easy-to-edit and downloadable. Use these for both personal and commercial use.
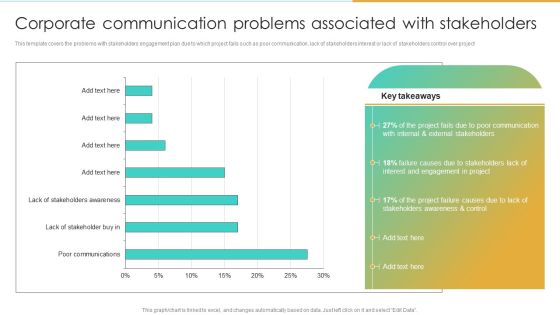
Corporate Communication Problems Associated With Stakeholders Professional PDF
This template covers the problems with stakeholders engagement plan due to which project fails such as poor communication, lack of stakeholders interest or lack of stakeholders control over project.Slidegeeks is here to make your presentations a breeze with Corporate Communication Problems Associated With Stakeholders Professional PDF With our easy-to-use and customizable templates, you can focus on delivering your ideas rather than worrying about formatting. With a variety of designs to choose from, you are sure to find one that suits your needs. And with animations and unique photos, illustrations, and fonts, you can make your presentation pop. So whether you are giving a sales pitch or presenting to the board, make sure to check out Slidegeeks first.
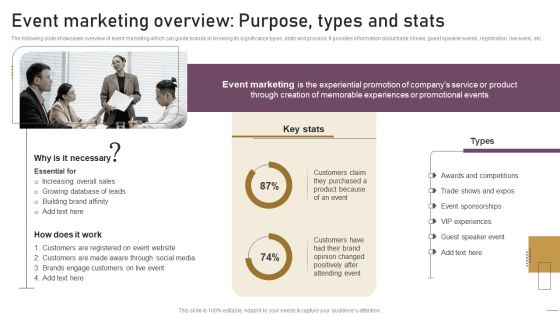
Implementing Experimental Marketing Event Marketing Overview Purpose Types And Stats Pictures PDF
The following slide showcases overview of event marketing which can guide brands in knowing its significance types, stats and process. It provides information about trade shows, guest speaker events, registration, live event, etc.Formulating a presentation can take up a lot of effort and time, so the content and message should always be the primary focus. The visuals of the PowerPoint can enhance the presenters message, so our Implementing Experimental Marketing Event Marketing Overview Purpose Types And Stats Pictures PDF was created to help save time. Instead of worrying about the design, the presenter can concentrate on the message while our designers work on creating the ideal templates for whatever situation is needed. Slidegeeks has experts for everything from amazing designs to valuable content, we have put everything into Implementing Experimental Marketing Event Marketing Overview Purpose Types And Stats Pictures PDF.

Implementing Experimental Marketing Experiential Marketing Statistics For Brands And Professionals Demonstration PDF
This slide showcases experiential marketing statistics which can be referred by branding stores and professionals. It provides information about digital ads, public relations, sponsorships, content sharing, live shows, events, etc.The Implementing Experimental Marketing Experiential Marketing Statistics For Brands And Professionals Demonstration PDF is a compilation of the most recent design trends as a series of slides. It is suitable for any subject or industry presentation, containing attractive visuals and photo spots for businesses to clearly express their messages. This template contains a variety of slides for the user to input data, such as structures to contrast two elements, bullet points, and slides for written information. Slidegeeks is prepared to create an impression.
