AI PPT Maker
Templates
PPT Bundles
Design Services
Business PPTs
Business Plan
Management
Strategy
Introduction PPT
Roadmap
Self Introduction
Timelines
Process
Marketing
Agenda
Technology
Medical
Startup Business Plan
Cyber Security
Dashboards
SWOT
Proposals
Education
Pitch Deck
Digital Marketing
KPIs
Project Management
Product Management
Artificial Intelligence
Target Market
Communication
Supply Chain
Google Slides
Research Services
 One Pagers
All Categories
-
Home
- Customer Favorites
- Cost Icon
Cost Icon
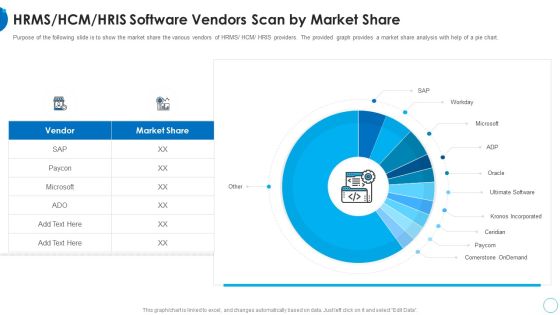
RMS HCM HRIS Software Vendors Scan By Market Share HR Change Management Tools Introduction PDF
Purpose of the following slide is to show the market share the various vendors of HRMS or HCM or HRIS providers. The provided graph provides a market share analysis with help of a pie chart. Deliver and pitch your topic in the best possible manner with this rms hcm hris software vendors scan by market share hr change management tools introduction pdf. Use them to share invaluable insights on hrms or hcm or hris software vendors scan by market share and impress your audience. This template can be altered and modified as per your expectations. So, grab it now.
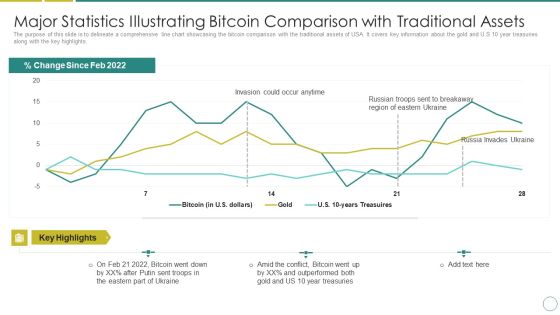
Russia Ukraine Major Statistics Illustrating Bitcoin Comparison With Traditional Assets Guidelines PDF
The purpose of this slide is to delineate a comprehensive line chart showcasing the bitcoin comparison with the traditional assets of USA. It covers key information about the gold and U.S 10 year treasuries along with the key highlights. Deliver an awe inspiring pitch with this creative russia ukraine major statistics illustrating bitcoin comparison with traditional assets guidelines pdf bundle. Topics like invasion could occur anytime, percent change since feb 2022 can be discussed with this completely editable template. It is available for immediate download depending on the needs and requirements of the user.

Risk Assessment And Mitigation Plan Impact Assessment Of Risk Mitigation Initiatives Ppt Layouts Influencers PDF
This slide illustrates graphs and charts for assessing the impact of risk mitigation initiatives taken to improve personal skills, boost motivation and enhance project deadline meeting capability. Deliver and pitch your topic in the best possible manner with this risk assessment and mitigation plan impact assessment of risk mitigation initiatives ppt layouts influencers pdf. Use them to share invaluable insights on project activities, planning, construction, commissioning and impress your audience. This template can be altered and modified as per your expectations. So, grab it now.
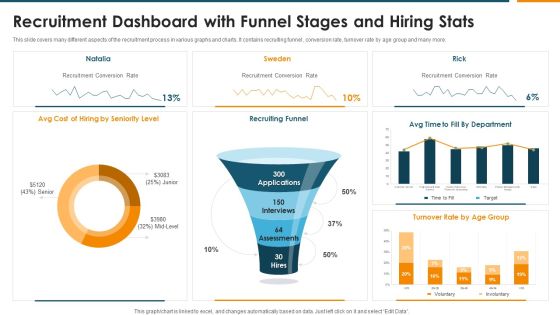
Recruitment Dashboard With Funnel Stages And Hiring Stats Rules PDF
This slide covers many different aspects of the recruitment process in various graphs and charts. It contains recruiting funnel , conversion rate, turnover rate by age group and many more. Pitch your topic with ease and precision using this Recruitment Dashboard With Funnel Stages And Hiring Stats Rules PDF. This layout presents information on Recruiting Funnel, Recruitment Conversion Rate, Seniority Level. It is also available for immediate download and adjustment. So, changes can be made in the color, design, graphics or any other component to create a unique layout.
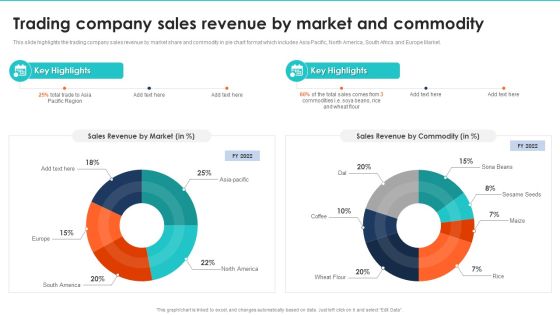
Export Management Company Profile Trading Company Sales Revenue By Market And Commodity Background PDF
This slide highlights the trading company sales revenue by market share and commodity in pie chart format which includes Asia Pacific, North America, South Africa and Europe Market. Deliver and pitch your topic in the best possible manner with this Export Management Company Profile Trading Company Sales Revenue By Market And Commodity Background PDF. Use them to share invaluable insights on Sales Revenue By Market, Sales Revenue By Commodity and impress your audience. This template can be altered and modified as per your expectations. So, grab it now.

Average Reduction In Injuries After Health And Safety Performance Measurements Check Template PDF
This slide covers the 7 year chart that is showing the number of injuries reduced during the timeframe by taking some measures or training employees on the usage of equipment they are using. Showcasing this set of slides titled Average Reduction In Injuries After Health And Safety Performance Measurements Check Template PDF The topics addressed in these templates are Employees Safety Measures, Workstation Ergonomics, Workplace Paying Attention All the content presented in this PPT design is completely editable. Download it and make adjustments in color, background, font etc. as per your unique business setting.

Agile Techniques For Data Migration Determining The Most Commonly Used Agile Methodologies Graphics PDF
Mentioned pie chart illustrates informational statistics about most commonly used agile methodologies. Here the slide shows that most of the organization prefers scrum process. Deliver and pitch your topic in the best possible manner with this Agile Techniques For Data Migration Determining The Most Commonly Used Agile Methodologies Graphics PDF. Use them to share invaluable insights on Iterative Development, Spotify Model, Lean Startup, Extreme Programming, Scrumban and impress your audience. This template can be altered and modified as per your expectations. So, grab it now.

Automobile Sales Scorecard Percentage Scorecard For Auto Sales Based On Fuel Usage Graphics PDF
This graph or chart is linked to excel, and changes automatically based on data. Just left click on it and select Edit Data. Deliver and pitch your topic in the best possible manner with this Automobile Sales Scorecard Percentage Scorecard For Auto Sales Based On Fuel Usage Graphics PDF. Use them to share invaluable insights on Petrol Engine Vehicles, Diesel Engine Vehicles, Electric Vehicles Sales and impress your audience. This template can be altered and modified as per your expectations. So, grab it now.

Shipment Supplier Scorecard With Total Spend And Ontime Delivery Ppt Slides Templates PDF
This graph or chart is linked to excel, and changes automatically based on data. Just left click on it and select Edit Data. Deliver and pitch your topic in the best possible manner with this Shipment Supplier Scorecard With Total Spend And Ontime Delivery Ppt Slides Templates PDF. Use them to share invaluable insights on Shipping Vendor Avg, Time Delivery Goal, Spend Over Time, OTD Delivery Percent and impress your audience. This template can be altered and modified as per your expectations. So, grab it now.

Commercial Real Estate Project Risk Management Impact Assessment Of Risk Mitigation Initiatives Project Formats PDF
This slide illustrates graphs and charts for assessing the impact of risk mitigation initiatives taken to improve personal skills, boost motivation and enhance project deadline meeting capability. Deliver and pitch your topic in the best possible manner with this Commercial Real Estate Project Risk Management Impact Assessment Of Risk Mitigation Initiatives Project Formats PDF. Use them to share invaluable insights on Project Activities, Planning, Construction and impress your audience. This template can be altered and modified as per your expectations. So, grab it now.
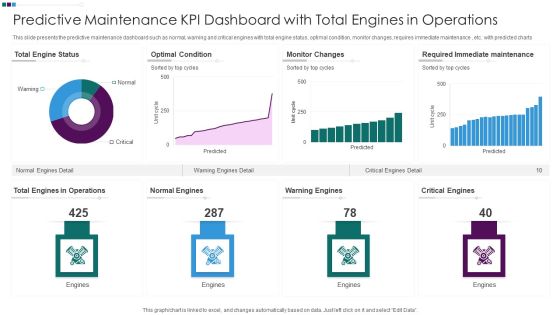
Predictive Maintenance KPI Dashboard With Total Engines In Operations Ppt Professional Inspiration PDF
This slide presents the predictive maintenance dashboard such as normal, warning and critical engines with total engine status, optimal condition, monitor changes, requires immediate maintenance , etc. with predicted charts. Pitch your topic with ease and precision using this Predictive Maintenance KPI Dashboard With Total Engines In Operations Ppt Professional Inspiration PDF. This layout presents information on Total Engine Status, Optimal Condition Monitor, Changes Warning Engines, Required Immediate Maintenance. It is also available for immediate download and adjustment. So, changes can be made in the color, design, graphics or any other component to create a unique layout.

Evaluating New Commodity Impact On Market Total Revenues Generated By The Product Topics PDF
Purpose of the following slide is to show the total revenues generated by the product, the provided bar chart displays the various months and the total revenues generated by the product in each. Deliver an awe inspiring pitch with this creative Evaluating New Commodity Impact On Market Total Revenues Generated By The Product Topics PDF bundle. Topics like Key Highlights, Revenues Generated, Generated Product can be discussed with this completely editable template. It is available for immediate download depending on the needs and requirements of the user.
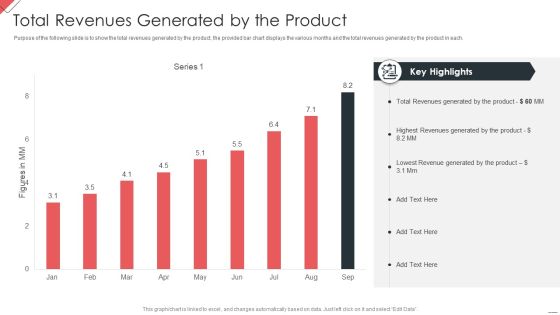
New Commodity Market Viability Review Total Revenues Generated By The Product Information PDF
Purpose of the following slide is to show the total revenues generated by the product, the provided bar chart displays the various months and the total revenues generated by the product in each. Deliver an awe inspiring pitch with this creative New Commodity Market Viability Review Total Revenues Generated By The Product Information PDF bundle. Topics like Revenues Generated, Highest Revenues, Lowest Revenue can be discussed with this completely editable template. It is available for immediate download depending on the needs and requirements of the user.
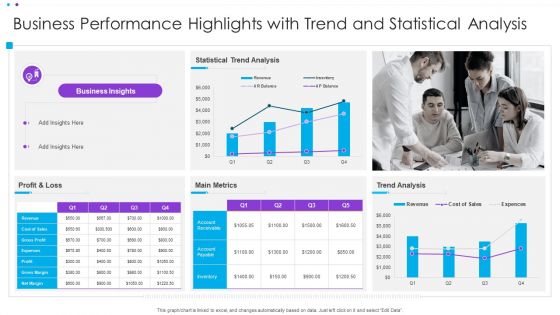
Business Performance Highlights With Trend And Statistical Analysis Ppt Infographic Template Display PDF
This graph or chart is linked to excel, and changes automatically based on data. Just left click on it and select Edit Data. Pitch your topic with ease and precision using this Business Performance Highlights With Trend And Statistical Analysis Ppt Infographic Template Display PDF. This layout presents information on Statistical Trend Analysis, Main Metrics, Profit And Loss. It is also available for immediate download and adjustment. So, changes can be made in the color, design, graphics or any other component to create a unique layout.
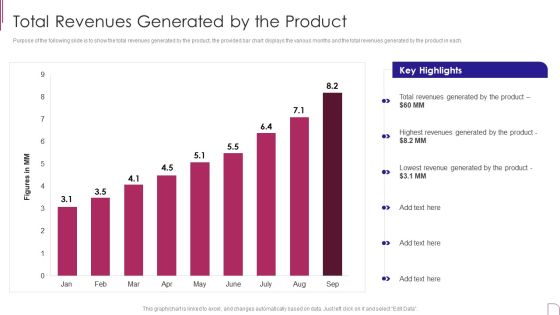
Yearly Product Performance Assessment Repor Total Revenues Generated By The Product Background PDF
Purpose of the following slide is to show the total revenues generated by the product, the provided bar chart displays the various months and the total revenues generated by the product in each. Deliver and pitch your topic in the best possible manner with this Yearly Product Performance Assessment Repor Total Revenues Generated By The Product Background PDF Use them to share invaluable insights on Key Highlights, Revenues Generated, Lowest Revenue and impress your audience. This template can be altered and modified as per your expectations. So, grab it now.

Building Design Firm Details Total Projects Completed In 2022 Ppt Infographic Template Graphics Pictures PDF
This slide highlights the total projects completed by architecture company through pie chart. It includes data of residential single and multi family homes, commercial, public, interiors, small projects and heritage projects. Deliver an awe inspiring pitch with this creative Building Design Firm Details Total Projects Completed In 2022 Ppt Infographic Template Graphics Pictures PDF bundle. Topics like Urban Design, Residential Single, Commercial, Interiors, Small Projects can be discussed with this completely editable template. It is available for immediate download depending on the needs and requirements of the user.

Client Helpline Dashboard At Valet Information Dsk Ppt Gallery Slide Portrait PDF
This graph or chart is linked to excel, and changes automatically based on data. Just left click on it and select Edit Data. Pitch your topic with ease and precision using this Client Helpline Dashboard At Valet Information Dsk Ppt Gallery Slide Portrait PDF. This layout presents information on Valet Damage Claims, Valet Wait Times, Information Desk. It is also available for immediate download and adjustment. So, changes can be made in the color, design, graphics or any other component to create a unique layout.

Firm KPI Dashboard With Average Click Through Rate Ppt Inspiration Sample PDF
This graph or chart is linked to excel, and changes automatically based on data. Just left click on it and select Edit Data. Pitch your topic with ease and precision using this Firm KPI Dashboard With Average Click Through Rate Ppt Inspiration Sample PDF. This layout presents information on Total Clicks, Total Impressive, Average CTR, Average Position. It is also available for immediate download and adjustment. So, changes can be made in the color, design, graphics or any other component to create a unique layout.

Quarterly Declining Graph Of A Manufacturing Plant Ppt PowerPoint Presentation File Example Topics PDF
This chart shows how the production of the manufacturing plan is declining in every quarter because of some critical reasons and how it is effecting the companys growth and goodwill. Showcasing this set of slides titled Quarterly Declining Graph Of A Manufacturing Plant Ppt PowerPoint Presentation File Example Topics PDF. The topics addressed in these templates are Production Declined, Lack Of Technology, Unskilled Laborers. All the content presented in this PPT design is completely editable. Download it and make adjustments in color, background, font etc. as per your unique business setting.

Yearly Net Income Statement Graph With Revenue And Operating Profit Margin Download PDF
This slide showcases chart that can help organization compare and analyze the operating profits generated by organization in different financial years. It also showcases yearly comparison of net income, revenue and operating profit margin. Pitch your topic with ease and precision using this Yearly Net Income Statement Graph With Revenue And Operating Profit Margin Download PDF. This layout presents information on Revenue, Net Income, Operating Profit Margin. It is also available for immediate download and adjustment. So, changes can be made in the color, design, graphics or any other component to create a unique layout.

Stakeholder Evaluation Plan Dashboard With Acceptance Level Of New Reforms Background PDF
This slide illustrates statistical analysis of key stakeholders of the corporation. It includes pie chart of key stakeholders and bar graph of their level of acceptance of new reforms. Showcasing this set of slides titled Stakeholder Evaluation Plan Dashboard With Acceptance Level Of New Reforms Background PDF. The topics addressed in these templates are Level Acceptance, Key Stakeholders, Critical Stakeholder. All the content presented in this PPT design is completely editable. Download it and make adjustments in color, background, font etc. as per your unique business setting.
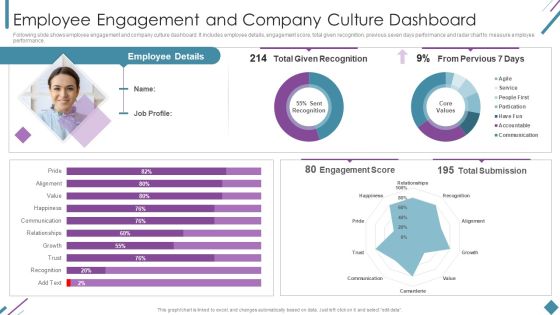
Metrics To Measure Business Performance Employee Engagement And Company Culture Demonstration PDF
Following slide shows employee engagement and company culture dashboard. It includes employee details, engagement score, total given recognition, previous seven days performance and radar chart to measure employee performance. Deliver and pitch your topic in the best possible manner with this Metrics To Measure Business Performance Employee Engagement And Company Culture Demonstration PDF. Use them to share invaluable insights on Employee Details, Total Given Recognition, Engagement Score and impress your audience. This template can be altered and modified as per your expectations. So, grab it now.

Service Level Agreement KPI Dashboard With Current Risk Statistics Topics PDF
This graph or chart is linked to excel, and changes automatically based on data. Just left click on it and select Edit Data. Pitch your topic with ease and precision using this Service Level Agreement KPI Dashboard With Current Risk Statistics Topics PDF. This layout presents information on Current Risk SLAS, Current Breached Slas, Personal Active SLA It is also available for immediate download and adjustment. So, changes can be made in the color, design, graphics or any other component to create a unique layout.
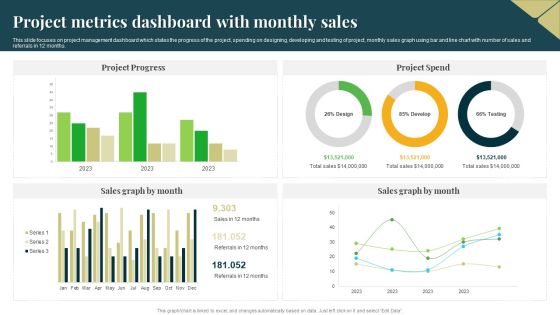
Project Metrics Dashboard With Monthly Sales Professional PDF
This slide focuses on project management dashboard which states the progress of the project, spending on designing, developing and testing of project, monthly sales graph using bar and line chart with number of sales and referrals in 12 months. Pitch your topic with ease and precision using this Project Metrics Dashboard With Monthly Sales Professional PDF. This layout presents information on Project Progress, Project Spend, Sales Graph. It is also available for immediate download and adjustment. So, changes can be made in the color, design, graphics or any other component to create a unique layout.
New Staff Onboarding Process KPI Tracking Dashboard Inspiration PDF
This slide showcase the KPI dashboard for tracking new hire onboarding completion progress. It includes KPIs such as onboarding completion status, employees per office, progress chart, hires starting in current and next week. Showcasing this set of slides titled New Staff Onboarding Process KPI Tracking Dashboard Inspiration PDF. The topics addressed in these templates are New Staff Onboarding Process, KPI Tracking Dashboard. All the content presented in this PPT design is completely editable. Download it and make adjustments in color, background, font etc. as per your unique business setting.

Company Financial Performance Indicators Dashboard With Liquidity And Turnover Ratios Formats PDF
This graph or chart is linked to excel, and changes automatically based on data. Just left click on it and select Edit Data. Pitch your topic with ease and precision using this Company Financial Performance Indicators Dashboard With Liquidity And Turnover Ratios Formats PDF. This layout presents information on Cash Balance, Days Inventory Outstanding, Days Payable Outstanding. It is also available for immediate download and adjustment. So, changes can be made in the color, design, graphics or any other component to create a unique layout.
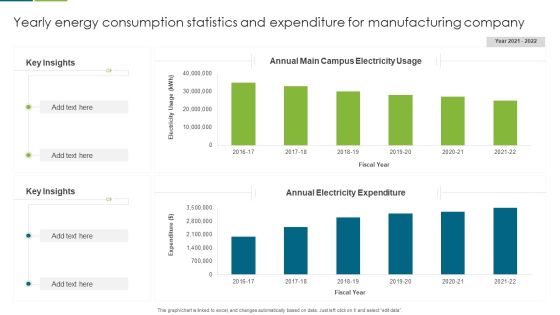
Yearly Energy Consumption Statistics And Expenditure For Manufacturing Company Guidelines PDF
This graph or chart is linked to excel, and changes automatically based on data. Just left click on it and select edit data. Pitch your topic with ease and precision using this Yearly Energy Consumption Statistics And Expenditure For Manufacturing Company Guidelines PDF. This layout presents information on Key Insights, Annual Electricity Expenditure, Annual Main Campus, Electricity Usage. It is also available for immediate download and adjustment. So, changes can be made in the color, design, graphics or any other component to create a unique layout.

Business Profitability And Growth Dashboard For Capital Fundraising Ppt Slides Guide PDF
This slide illustrates graphical representation of company growth journey for investors. It includes profitability graph of 15 years, cash usage pie-chart, and share performance line graph. Showcasing this set of slides titled Business Profitability And Growth Dashboard For Capital Fundraising Ppt Slides Guide PDF. The topics addressed in these templates are Judicious Cash Usage, Share Performance, Respect To Benchmark. All the content presented in this PPT design is completely editable. Download it and make adjustments in color, background, font etc. as per your unique business setting.

IT Security Automation Tools Integration Current State Of Security Automation With Projected Introduction PDF
This slide highlights the current state of security automation in the pie chart format. It includes projected development of security automation and state of security automation. Deliver and pitch your topic in the best possible manner with this IT Security Automation Tools Integration Current State Of Security Automation With Projected Introduction PDF. Use them to share invaluable insights on State Security, Automation Organizations, Projected Development, Security Automation and impress your audience. This template can be altered and modified as per your expectations. So, grab it now.
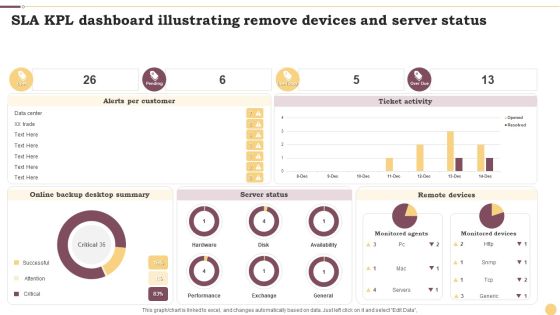
SLA KPL Dashboard Illustrating Remove Devices And Server Status Ppt Inspiration Layout Ideas PDF
This graph or chart is linked to excel, and changes automatically based on data. Just left click on it and select Edit Data. Showcasing this set of slides titled SLA KPL Dashboard Illustrating Remove Devices And Server Status Ppt Inspiration Layout Ideas PDF. The topics addressed in these templates are Alerts Per Customer, Ticket Activity, Server Status. All the content presented in this PPT design is completely editable. Download it and make adjustments in color, background, font etc. as per your unique business setting.

SLA KPL Dashboard Illustrating Risk And Active Services Ppt Portfolio Design Inspiration PDF
This graph or chart is linked to excel, and changes automatically based on data. Just left click on it and select Edit Data. Pitch your topic with ease and precision using this SLA KPL Dashboard Illustrating Risk And Active Services Ppt Portfolio Design Inspiration PDF. This layout presents information on My Active SLAs, Database Group, Priority. It is also available for immediate download and adjustment. So, changes can be made in the color, design, graphics or any other component to create a unique layout.
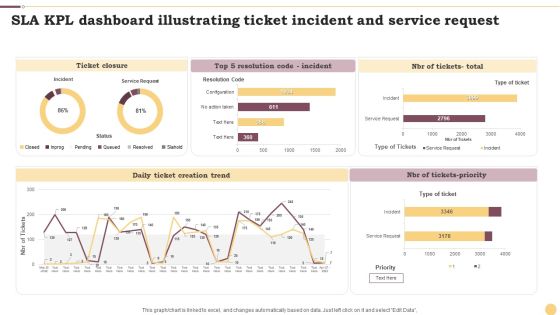
SLA KPL Dashboard Illustrating Ticket Incident And Service Request Ppt File Portrait PDF
This graph or chart is linked to excel, and changes automatically based on data. Just left click on it and select Edit Data. Showcasing this set of slides titled SLA KPL Dashboard Illustrating Ticket Incident And Service Request Ppt File Portrait PDF. The topics addressed in these templates are Ticket Closure, Daily Ticket, Creation Trend, NBR Tickets Priority. All the content presented in this PPT design is completely editable. Download it and make adjustments in color, background, font etc. as per your unique business setting.
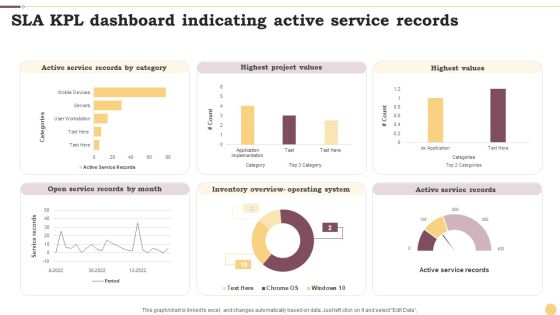
SLA KPL Dashboard Indicating Active Service Records Ppt Professional Graphics Example PDF
This graph or chart is linked to excel, and changes automatically based on data. Just left click on it and select Edit Data. Pitch your topic with ease and precision using this SLA KPL Dashboard Indicating Active Service Records Ppt Professional Graphics Example PDF. This layout presents information on Active Service Records, Highest Project Values, Highest Values. It is also available for immediate download and adjustment. So, changes can be made in the color, design, graphics or any other component to create a unique layout.

Kanban Structure To Track Proposed Active And Completed Activities Ppt Outline Slide Portrait PDF
This graph or chart is linked to excel, and changes automatically based on data. Just left click on it and select Edit Data. Pitch your topic with ease and precision using this Kanban Structure To Track Proposed Active And Completed Activities Ppt Outline Slide Portrait PDF. This layout presents information on Project Lead Time, Cycle Time, Completed. It is also available for immediate download and adjustment. So, changes can be made in the color, design, graphics or any other component to create a unique layout.

Kanban Structure With Task Count And Cycle Time Ppt Layouts Background Designs PDF
This graph or chart is linked to excel, and changes automatically based on data. Just left click on it and select Edit Data. Pitch your topic with ease and precision using this Kanban Structure With Task Count And Cycle Time Ppt Layouts Background Designs PDF. This layout presents information on Required Project Design, Project Design Approval, Construct. It is also available for immediate download and adjustment. So, changes can be made in the color, design, graphics or any other component to create a unique layout.

Competitors Global Market Share And Earnings Comparative Analysis Report Slides PDF
This slide covers comparison matrix of company and competitors market share and revenue. It also includes pie chart depicting the total global revenue market share. Showcasing this set of slides titled Competitors Global Market Share And Earnings Comparative Analysis Report Slides PDF. The topics addressed in these templates are Revenue, Global Market Share, Earnings Comparative Analysis Report. All the content presented in this PPT design is completely editable. Download it and make adjustments in color, background, font etc. as per your unique business setting.
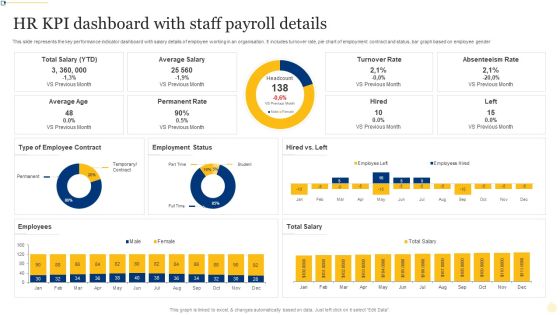
HR KPI Dashboard With Staff Payroll Details Ppt PowerPoint Presentation File Layout Ideas PDF
This slide represents the key performance indicator dashboard with salary details of employee working in an organisation. It includes turnover rate, pie chart of employment contract and status, bar graph based on employee gender. Showcasing this set of slides titled HR KPI Dashboard With Staff Payroll Details Ppt PowerPoint Presentation File Layout Ideas PDF. The topics addressed in these templates are Turnover Rate, Absenteeism Rate, Permanent Rate. All the content presented in this PPT design is completely editable. Download it and make adjustments in color, background, font etc. as per your unique business setting.

Human Capital Metrics With Employee Turnover Rate Ppt File Mockup PDF
This graph or chart is linked to excel, and changes automatically based on data. Just left click on it and select Edit Data. Showcasing this set of slides titled Human Capital Metrics With Employee Turnover Rate Ppt File Mockup PDF. The topics addressed in these templates are Employee Turnover Rate, Turnover Rate Division, Turnover Rate Year, Over Year. All the content presented in this PPT design is completely editable. Download it and make adjustments in color, background, font etc. as per your unique business setting.
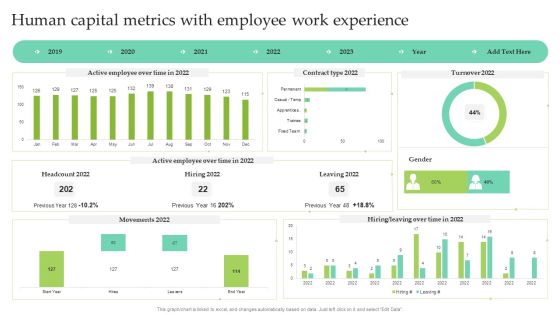
Human Capital Metrics With Employee Work Experience Ppt Show Images PDF
This graph or chart is linked to excel, and changes automatically based on data. Just left click on it and select Edit Data. Pitch your topic with ease and precision using this Human Capital Metrics With Employee Work Experience Ppt Show Images PDF. This layout presents information on Active Employee, Over Time, Contract Type 2022, Leaving 2022. It is also available for immediate download and adjustment. So, changes can be made in the color, design, graphics or any other component to create a unique layout.
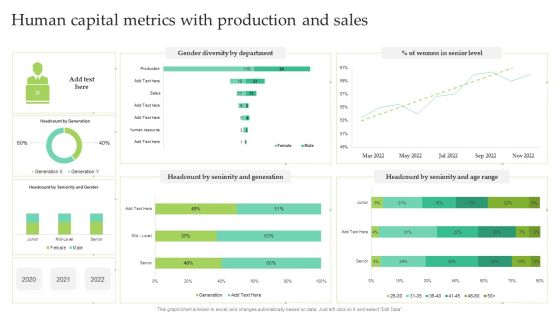
Human Capital Metrics With Production And Sales Ppt Infographic Template Summary PDF
This graph or chart is linked to excel, and changes automatically based on data. Just left click on it and select Edit Data. Showcasing this set of slides titled Human Capital Metrics With Production And Sales Ppt Infographic Template Summary PDF. The topics addressed in these templates are Women Senior Level, Gender Diversity Department, Seniority And Generation. All the content presented in this PPT design is completely editable. Download it and make adjustments in color, background, font etc. as per your unique business setting.

Architecture Engineering Planning Services Company Total Projects Completed In 2022 Formats PDF
This slide highlights the total projects completed by architecture company through pie chart. It includes data of residential single and multi family homes, commercial, public, interiors, small projects and heritage projects. Find a pre designed and impeccable Architecture Engineering Planning Services Company Total Projects Completed In 2022 Formats PDF. The templates can ace your presentation without additional effort. You can download these easy to edit presentation templates to make your presentation stand out from others. So, what are you waiting for Download the template from Slidegeeks today and give a unique touch to your presentation.

Software Development Project Weekly Status Update Summary Document Inspiration PDF
This slide represents a dashboard showing the weekly status of the software development projects of the IT department. It represents pie chart showing failed login rate, status of projects and aborted connects. Pitch your topic with ease and precision using this Software Development Project Weekly Status Update Summary Document Inspiration PDF. This layout presents information on High Failed, Login Rate, Abort Connects, Failed Login. It is also available for immediate download and adjustment. So, changes can be made in the color, design, graphics or any other component to create a unique layout.
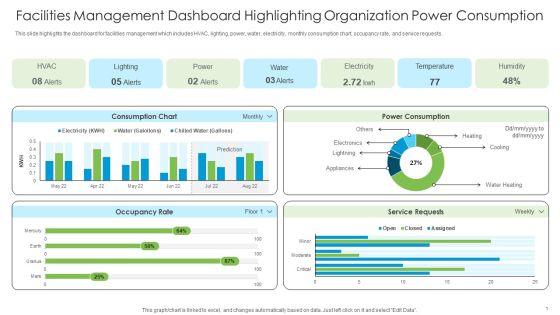
Facilities Management Dashboard Highlighting Organization Power Consumption Sample PDF
This slide highlights the dashboard for facilities management which includes HVAC, lighting, power, water, electricity, monthly consumption chart, occupancy rate, and service requests.From laying roadmaps to briefing everything in detail, our templates are perfect for you. You can set the stage with your presentation slides. All you have to do is download these easy-to-edit and customizable templates. Facilities Management Dashboard Highlighting Organization Power Consumption Sample PDF will help you deliver an outstanding performance that everyone would remember and praise you for. Do download this presentation today.

Brand Awareness Plan Product Marketing Dashboard For Pay Per Click Campaign Template PDF
This graph or chart is linked to excel, and changes automatically based on data. Just left click on it and select Edit Data. Get a simple yet stunning designed Brand Awareness Plan Product Marketing Dashboard For Pay Per Click Campaign Template PDF. It is the best one to establish the tone in your meetings. It is an excellent way to make your presentations highly effective. So, download this PPT today from Slidegeeks and see the positive impacts. Our easy-to-edit Brand Awareness Plan Product Marketing Dashboard For Pay Per Click Campaign Template PDF can be your go-to option for all upcoming conferences and meetings. So, what are you waiting for Grab this template today.

Brand Equity Valuation Of Top 10 IT Companies Ppt Portfolio Rules PDF
This slide showcase top 10 information technology companies brand value comparison chart understanding their position in market. It includes elements such as companies name, brand value, and key insights. Pitch your topic with ease and precision using this Brand Equity Valuation Of Top 10 IT Companies Ppt Portfolio Rules PDF. This layout presents information on Highest Market Value, Total Value, Brand Valuation. It is also available for immediate download and adjustment. So, changes can be made in the color, design, graphics or any other component to create a unique layout.

Facilities Management Dashboard Highlighting Organization Power Consumption Background PDF
This slide highlights the dashboard for facilities management which includes HVAC, lighting, power, water, electricity, monthly consumption chart, occupancy rate, and service requests. This Facilities Management Dashboard Highlighting Organization Power Consumption Background PDF from Slidegeeks makes it easy to present information on your topic with precision. It provides customization options, so you can make changes to the colors, design, graphics, or any other component to create a unique layout. It is also available for immediate download, so you can begin using it right away. Slidegeeks has done good research to ensure that you have everything you need to make your presentation stand out. Make a name out there for a brilliant performance.
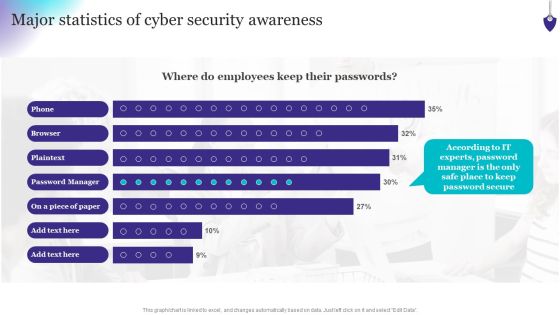
Organizing Security Awareness Major Statistics Of Cyber Security Awareness Formats PDF
This graph or chart is linked to excel, and changes automatically based on data. Just left click on it and select Edit Data. Welcome to our selection of the Organizing Security Awareness Major Statistics Of Cyber Security Awareness Formats PDF. These are designed to help you showcase your creativity and bring your sphere to life. Planning and Innovation are essential for any business that is just starting out. This collection contains the designs that you need for your everyday presentations. All of our PowerPoints are 100 percent editable, so you can customize them to suit your needs. This multi-purpose template can be used in various situations. Grab these presentation templates today.

Financial Business Application Development Playbook Pictures PDF
If you are looking for a format to display your unique thoughts, then the professionally designed Financial Business Application Development Playbook Pictures PDF is the one for you. You can use it as a Google Slides template or a PowerPoint template. Incorporate impressive visuals, symbols, images, and other charts. Modify or reorganize the text boxes as you desire. Experiment with shade schemes and font pairings. Alter, share or cooperate with other people on your work. Download Financial Business Application Development Playbook Pictures PDF and find out how to give a successful presentation. Present a perfect display to your team and make your presentation unforgettable.

Car Types Used In Usa Stacked Percentage Graph Sample PDF
This slide shows car use percentage chart in USA to compare vehicle buying decisions. It includes types of cars and car use percentage. Pitch your topic with ease and precision using this Car Types Used In Usa Stacked Percentage Graph Sample PDF. This layout presents information on Limited Space In City, Less Parking Space, Easy To Commute. It is also available for immediate download and adjustment. So, changes can be made in the color, design, graphics or any other component to create a unique layout.

Insurance Policy Usage Stacked Percentage Graph Template PDF
This slide illustrates use of insurance policy types percentage chart in USA to determine total number of insurances taken. It includes cities and insurance policy percentage. Pitch your topic with ease and precision using this Insurance Policy Usage Stacked Percentage Graph Template PDF. This layout presents information on Motor Vehicle Policies, More Population, Migration Of People. It is also available for immediate download and adjustment. So, changes can be made in the color, design, graphics or any other component to create a unique layout.
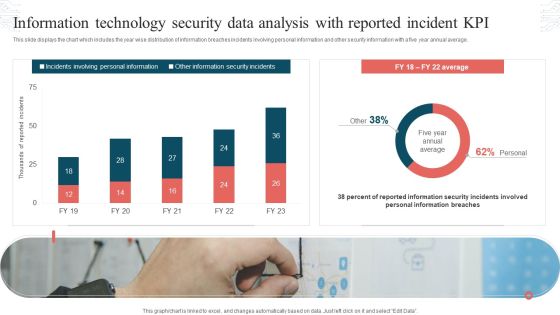
Information Technology Security Data Analysis With Reported Incident KPI Download PDF
This slide displays the chart which includes the year wise distribution of information breaches incidents involving personal information and other security information with a five year annual average. Showcasing this set of slides titled Information Technology Security Data Analysis With Reported Incident KPI Download PDF. The topics addressed in these templates are Incidents Involving, Personal Information, Other Information, Security Incidents. All the content presented in this PPT design is completely editable. Download it and make adjustments in color, background, font etc. as per your unique business setting.

Strategic FM Services Facilities Management Dashboard Highlighting Organization Power Consumption Brochure PDF
This slide highlights the dashboard for facilities management which includes HVAC, lighting, power, water, electricity, monthly consumption chart, occupancy rate, and service requests. Make sure to capture your audiences attention in your business displays with our gratis customizable Strategic FM Services Facilities Management Dashboard Highlighting Organization Power Consumption Brochure PDF. These are great for business strategies, office conferences, capital raising or task suggestions. If you desire to acquire more customers for your tech business and ensure they stay satisfied, create your own sales presentation with these plain slides.
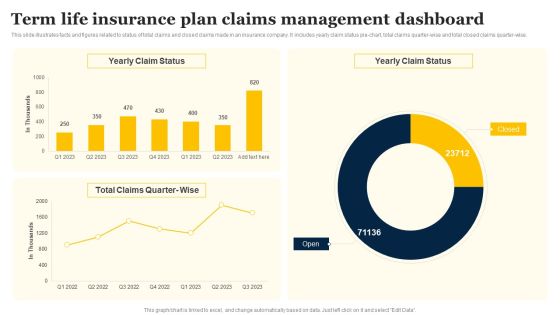
Term Life Insurance Plan Claims Management Dashboard Portrait PDF
This slide illustrates facts and figures related to status of total claims and closed claims made in an insurance company. It includes yearly claim status pie-chart, total claims quarter-wise and total closed claims quarter-wise. Pitch your topic with ease and precision using this Term Life Insurance Plan Claims Management Dashboard Portrait PDF. This layout presents information on Yearly Claim Status, Total Claims, Quarter Wise. It is also available for immediate download and adjustment. So, changes can be made in the color, design, graphics or any other component to create a unique layout.

Monetary Planning And Evaluation Guide Forecasting The Revenue And Growth Of Organization Ppt Slides Outline PDF
The following slide outlines a comprehensive chart highlighting the estimated company revenue. The forecasted revenue is shown from 2023 to 2025 with key highlights. Make sure to capture your audiences attention in your business displays with our gratis customizable Monetary Planning And Evaluation Guide Forecasting The Revenue And Growth Of Organization Ppt Slides Outline PDF. These are great for business strategies, office conferences, capital raising or task suggestions. If you desire to acquire more customers for your tech business and ensure they stay satisfied, create your own sales presentation with these plain slides.

Monthly KPI Work Performance Monitoring By Category Microsoft PDF
This slide shows the monthly key performance indicators report on various categories with a line chart . the categories includes financial, customer success , new business activities, HR and other metrics. Pitch your topic with ease and precision using this Monthly KPI Work Performance Monitoring By Category Microsoft PDF. This layout presents information on Metrics, Financial, Customer Success. It is also available for immediate download and adjustment. So, changes can be made in the color, design, graphics or any other component to create a unique layout.

Support Center Report On Customer Executive Performance Evaluation Background PDF
This slide signifies the call center KPI dashboard on customer support executive performance. It includes daily and weekly volume, CSAT score, pie chart on service level agreement. Pitch your topic with ease and precision using this Support Center Report On Customer Executive Performance Evaluation Background PDF. This layout presents information on Weekly Call Volume, Response Time, Service Level Agreement. It is also available for immediate download and adjustment. So, changes can be made in the color, design, graphics or any other component to create a unique layout.

Support Center Report On Customer Support Executive Performance Sample PDF
This slide signifies the pie chart on performance of customer support executive in call centre. It includes the name of various employee and the strategies they implemented for there achievement. Showcasing this set of slides titled Support Center Report On Customer Support Executive Performance Sample PDF. The topics addressed in these templates are Use Of Personalise Telecalling, Provide Good Customer Service, Provide Offers And Discounts. All the content presented in this PPT design is completely editable. Download it and make adjustments in color, background, font etc. as per your unique business setting.

Support Center Report With Activity And Statistics Guidelines PDF
This slide signifies the report on call centre with activities and statistics. It includes agent activity sum, pie chart based on group calls, abandonment rate, service level and average queue time. Pitch your topic with ease and precision using this Support Center Report With Activity And Statistics Guidelines PDF. This layout presents information on Support Center Report, Activity And Statistics. It is also available for immediate download and adjustment. So, changes can be made in the color, design, graphics or any other component to create a unique layout.

Prevention Of Information Key Statistics Showing The Impact Of Security Awareness Infographics PDF
This graph or chart is linked to excel, and changes automatically based on data. Just left click on it and select Edit Data. This modern and well-arranged Prevention Of Information Key Statistics Showing The Impact Of Security Awareness Infographics PDF provides lots of creative possibilities. It is very simple to customize and edit with the Powerpoint Software. Just drag and drop your pictures into the shapes. All facets of this template can be edited with Powerpoint, no extra software is necessary. Add your own material, put your images in the places assigned for them, adjust the colors, and then you can show your slides to the world, with an animated slide included.

Improving Corporate Performance Sales Opportunity Monitoring Dashboard Portrait PDF
This graph or chart is linked to excel, and changes automatically based on data. Just left click on it and select Edit Data. Welcome to our selection of the Improving Corporate Performance Sales Opportunity Monitoring Dashboard Portrait PDF. These are designed to help you showcase your creativity and bring your sphere to life. Planning and Innovation are essential for any business that is just starting out. This collection contains the designs that you need for your everyday presentations. All of our PowerPoints are 100 percent editable, so you can customize them to suit your needs. This multi-purpose template can be used in various situations. Grab these presentation templates today.

Product And Services Promotion Major Goals Of Social Media Marketing Slides PDF
This graph or chart is linked to excel, and changes automatically based on data. Just left click on it and select Edit Data. From laying roadmaps to briefing everything in detail, our templates are perfect for you. You can set the stage with your presentation slides. All you have to do is download these easy-to-edit and customizable templates. Product And Services Promotion Major Goals Of Social Media Marketing Slides PDF will help you deliver an outstanding performance that everyone would remember and praise you for. Do download this presentation today.

Product And Services Promotion Marketing Performance Dashboard With Advertisement Graphics PDF
This graph or chart is linked to excel, and changes automatically based on data. Just left click on it and select Edit Data. Slidegeeks is here to make your presentations a breeze with Product And Services Promotion Marketing Performance Dashboard With Advertisement Graphics PDF With our easy-to-use and customizable templates, you can focus on delivering your ideas rather than worrying about formatting. With a variety of designs to choose from, youre sure to find one that suits your needs. And with animations and unique photos, illustrations, and fonts, you can make your presentation pop. So whether youre giving a sales pitch or presenting to the board, make sure to check out Slidegeeks first.

Product Marketing And Awareness Programs Major Goals Of Social Media Marketing Mockup PDF
This graph or chart is linked to excel, and changes automatically based on data. Just left click on it and select Edit Data. Find a pre-designed and impeccable Product Marketing And Awareness Programs Major Goals Of Social Media Marketing Mockup PDF. The templates can ace your presentation without additional effort. You can download these easy-to-edit presentation templates to make your presentation stand out from others. So, what are you waiting for Download the template from Slidegeeks today and give a unique touch to your presentation.
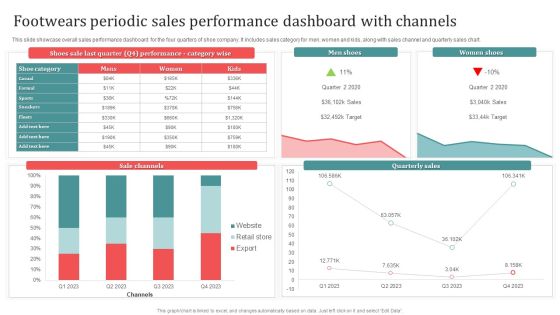
Footwears Periodic Sales Performance Dashboard With Channels Download PDF
This slide showcase overall sales performance dashboard for the four quarters of shoe company. It includes sales category for men, women and kids, along with sales channel and quarterly sales chart. Showcasing this set of slides titled Footwears Periodic Sales Performance Dashboard With Channels Download PDF. The topics addressed in these templates are Men Shoes, Women Shoes, Sale Channels. All the content presented in this PPT design is completely editable. Download it and make adjustments in color, background, font etc. as per your unique business setting.

Product Marketing For Generating Product Marketing Dashboard With Sales Trend Designs PDF
This graph or chart is linked to excel, and changes automatically based on data. Just left click on it and select Edit Data. From laying roadmaps to briefing everything in detail, our templates are perfect for you. You can set the stage with your presentation slides. All you have to do is download these easy-to-edit and customizable templates. Product Marketing For Generating Product Marketing Dashboard With Sales Trend Designs PDF will help you deliver an outstanding performance that everyone would remember and praise you for. Do download this presentation today.

Implementing Digital Marketing Leading Social Media Platforms Used By Retailers In 2022 Structure PDF
This graph or chart is linked to excel, and changes automatically based on data. Just left click on it and select Edit Data. From laying roadmaps to briefing everything in detail, our templates are perfect for you. You can set the stage with your presentation slides. All you have to do is download these easy-to-edit and customizable templates. Implementing Digital Marketing Leading Social Media Platforms Used By Retailers In 2022 Structure PDF will help you deliver an outstanding performance that everyone would remember and praise you for. Do download this presentation today.

Comprehensive Guide For Launch Sales By Lead Source Performance Indicator Inspiration PDF
This graph or chart is linked to excel, and changes automatically based on data. Just left click on it and select Edit Data. The Comprehensive Guide For Launch Sales By Lead Source Performance Indicator Inspiration PDF is a compilation of the most recent design trends as a series of slides. It is suitable for any subject or industry presentation, containing attractive visuals and photo spots for businesses to clearly express their messages. This template contains a variety of slides for the user to input data, such as structures to contrast two elements, bullet points, and slides for written information. Slidegeeks is prepared to create an impression.

Comprehensive Guide To Enhance Competitive Landscape Analysis Based On Market Ideas PDF
Mentioned pie chart illustrates companys global and domestic market share. Company A has a larger market share in both the global and domestic markets. If your project calls for a presentation, then Slidegeeks is your go-to partner because we have professionally designed, easy-to-edit templates that are perfect for any presentation. After downloading, you can easily edit Comprehensive Guide To Enhance Competitive Landscape Analysis Based On Market Ideas PDF and make the changes accordingly. You can rearrange slides or fill them with different images. Check out all the handy templates.

Dashboard To Monitor Business Process Outsourcing Performance Based On Industry Standards Infographics PDF
This slide depicts the dashboard to monitor performance of business process outsourcing enterprise with reference to industry standards. The key elements covered in the slide are total calls, average answer speed, abandon rate, average calls per minute and agent performanc. Showcasing this set of slides titled Dashboard To Monitor Business Process Outsourcing Performance Based On Industry Standards Infographics PDF. The topics addressed in these templates are Industry Standards, Chart By Agent, Call Abandon Rate, Total Calls. All the content presented in this PPT design is completely editable. Download it and make adjustments in color, background, font etc. as per your unique business setting.
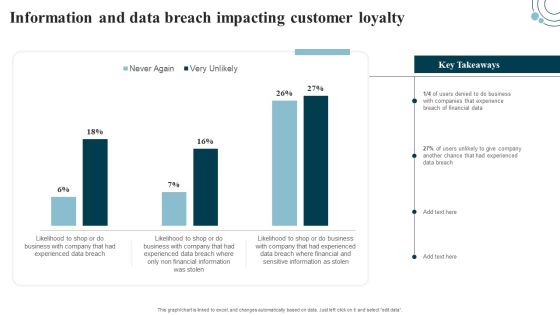
Developing IT Security Strategy Information And Data Breach Impacting Customer Loyalty Template PDF
This graph or chart is linked to excel, and changes automatically based on data. Just left click on it and select edit data. Get a simple yet stunning designed Developing IT Security Strategy Information And Data Breach Impacting Customer Loyalty Template PDF. It is the best one to establish the tone in your meetings. It is an excellent way to make your presentations highly effective. So, download this PPT today from Slidegeeks and see the positive impacts. Our easy-to-edit Developing IT Security Strategy Information And Data Breach Impacting Customer Loyalty Template PDF can be your go-to option for all upcoming conferences and meetings. So, what are you waiting for Grab this template today.
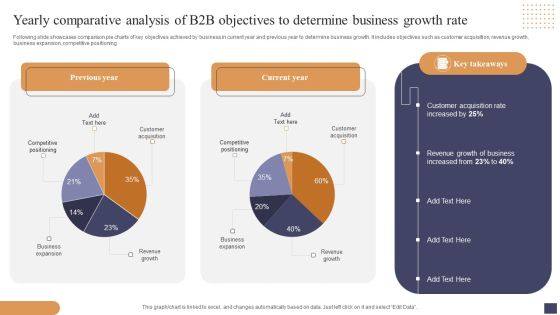
Yearly Comparative Analysis Of B2b Objectives To Determine Business Growth Rate Mockup PDF
Following slide showcases comparison pie charts of key objectives achieved by business in current year and previous year to determine business growth. It includes objectives such as customer acquisition, revenue growth, business expansion, competitive positioning. Showcasing this set of slides titled Yearly Comparative Analysis Of B2b Objectives To Determine Business Growth Rate Mockup PDF. The topics addressed in these templates are Customer Acquisition, Revenue Growth Business, Business Expansion. All the content presented in this PPT design is completely editable. Download it and make adjustments in color, background, font etc. as per your unique business setting.
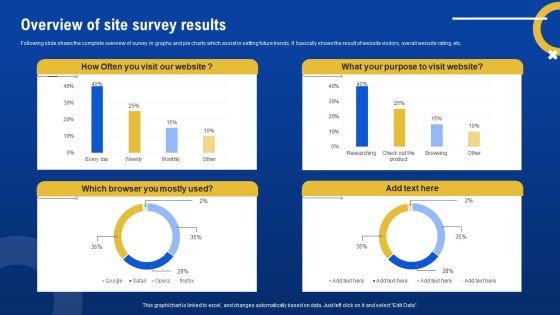
Overview Of Site Survey Results Survey SS
Following slide shows the complete overview of survey in graphs and pie charts which assist in setting future trends. It basically shows the result of website visitors, overall website rating, etc. Pitch your topic with ease and precision using this Overview Of Site Survey Results Survey SS. This layout presents information on Overview, Site Survey Results. It is also available for immediate download and adjustment. So, changes can be made in the color, design, graphics or any other component to create a unique layout.

Clustered Column Comprehensive Plan For IT And Business Integration Brochure PDF
If you are looking for a format to display your unique thoughts, then the professionally designed Clustered Column Comprehensive Plan For IT And Business Integration Brochure PDF is the one for you. You can use it as a Google Slides template or a PowerPoint template. Incorporate impressive visuals, symbols, images, and other charts. Modify or reorganize the text boxes as you desire. Experiment with shade schemes and font pairings. Alter, share or cooperate with other people on your work. Download Clustered Column Comprehensive Plan For IT And Business Integration Brochure PDF and find out how to give a successful presentation. Present a perfect display to your team and make your presentation unforgettable.

Robotic Automation In Workplace Top Industrial Robot Manufacturing Companies Ideas PDF
If you are looking for a format to display your unique thoughts, then the professionally designed Robotic Automation In Workplace Top Industrial Robot Manufacturing Companies Ideas PDF is the one for you. You can use it as a Google Slides template or a PowerPoint template. Incorporate impressive visuals, symbols, images, and other charts. Modify or reorganize the text boxes as you desire. Experiment with shade schemes and font pairings. Alter, share or cooperate with other people on your work. Download Robotic Automation In Workplace Top Industrial Robot Manufacturing Companies Ideas PDF and find out how to give a successful presentation. Present a perfect display to your team and make your presentation unforgettable.
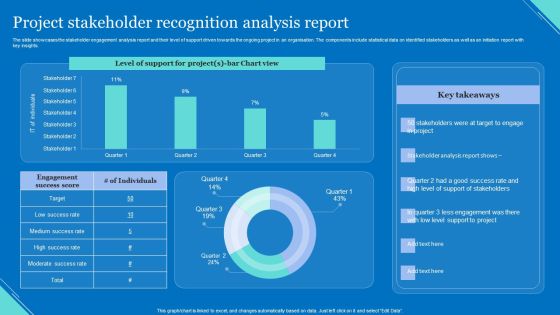
Project Stakeholder Recognition Analysis Report Elements PDF
The slide showcases the stakeholder engagement analysis report and their level of support driven towards the ongoing project in an organisation. The components include statistical data on identified stakeholders as well as an initiation report with key insights. Showcasing this set of slides titled Project Stakeholder Recognition Analysis Report Elements PDF. The topics addressed in these templates are Level Support, Chart View, Support Stakeholders. All the content presented in this PPT design is completely editable. Download it and make adjustments in color, background, font etc. as per your unique business setting.
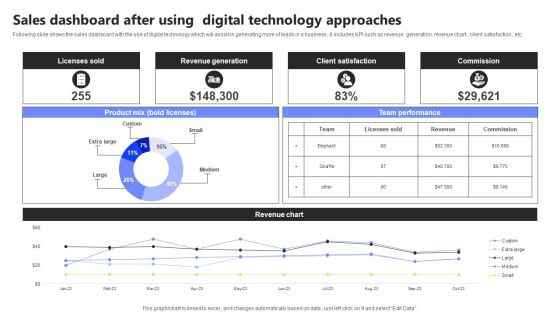
Sales Dashboard After Using Digital Technology Approaches Infographics PDF
Following slide shows the sales dashboard with the use of digital technology which will assist in generating more of leads in a business . It includes KPI such as revenue generation, revenue chart , client satisfaction , etc. Showcasing this set of slides titled Sales Dashboard After Using Digital Technology Approaches Infographics PDF. The topics addressed in these templates are Licenses Sold, Revenue Generation, Client Satisfaction. All the content presented in this PPT design is completely editable. Download it and make adjustments in color, background, font etc. as per your unique business setting.
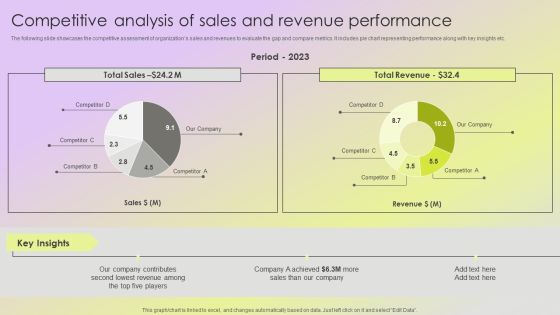
Mitigating Sales Risks With Strategic Action Planning Competitive Analysis Of Sales And Revenue Performance Slides PDF
The following slide showcases the competitive assessment of organizations sales and revenues to evaluate the gap and compare metrics. It includes pie chart representing performance along with key insights etc. Find a pre designed and impeccable Mitigating Sales Risks With Strategic Action Planning Competitive Analysis Of Sales And Revenue Performance Slides PDF. The templates can ace your presentation without additional effort. You can download these easy to edit presentation templates to make your presentation stand out from others. So, what are you waiting for Download the template from Slidegeeks today and give a unique touch to your presentation.

Competitive Analysis Of Sales And Revenue Performance Elements PDF
The following slide showcases the competitive assessment of organizations sales and revenues to evaluate the gap and compare metrics. It includes pie chart representing performance along with key insights etc. Take your projects to the next level with our ultimate collection of Competitive Analysis Of Sales And Revenue Performance Elements PDF. Slidegeeks has designed a range of layouts that are perfect for representing task or activity duration, keeping track of all your deadlines at a glance. Tailor these designs to your exact needs and give them a truly corporate look with your own brand colors they will make your projects stand out from the rest.

Competitive Analysis Of Sales And Revenue Performance Designs PDF
The following slide showcases the competitive assessment of organizations sales and revenues to evaluate the gap and compare metrics. It includes pie chart representing performance along with key insights etc. Take your projects to the next level with our ultimate collection of Competitive Analysis Of Sales And Revenue Performance Designs PDF. Slidegeeks has designed a range of layouts that are perfect for representing task or activity duration, keeping track of all your deadlines at a glance. Tailor these designs to your exact needs and give them a truly corporate look with your own brand colors they will make your projects stand out from the rest.
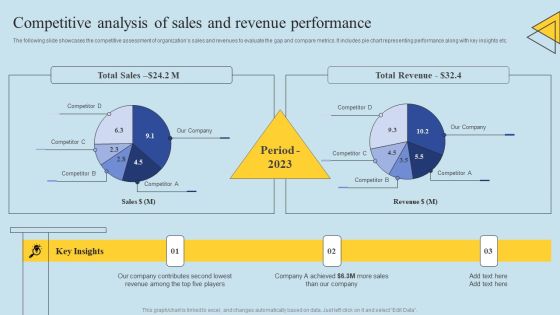
Determining Risks In Sales Administration Procedure Competitive Analysis Of Sales And Revenue Introduction PDF
The following slide showcases the competitive assessment of organizations sales and revenues to evaluate the gap and compare metrics. It includes pie chart representing performance along with key insights etc. Make sure to capture your audiences attention in your business displays with our gratis customizable Determining Risks In Sales Administration Procedure Competitive Analysis Of Sales And Revenue Introduction PDF. These are great for business strategies, office conferences, capital raising or task suggestions. If you desire to acquire more customers for your tech business and ensure they stay satisfied, create your own sales presentation with these plain slides.

Implementation Of Digital Advancement Techniques Efficiency Gains Using Drones Pictures PDF
The following slide showcases graphical chart representing efficiency of using drone technology in insurance sector as compared to traditional methods for on site inspections. It highlights comparison of time taken in manual process and with drone. Want to ace your presentation in front of a live audience Our Implementation Of Digital Advancement Techniques Efficiency Gains Using Drones Pictures PDF can help you do that by engaging all the users towards you. Slidegeeks experts have put their efforts and expertise into creating these impeccable powerpoint presentations so that you can communicate your ideas clearly. Moreover, all the templates are customizable, and easy to edit and downloadable. Use these for both personal and commercial use.

Positive Impact Of New Team Performance Management System Building Efficient Template PDF
This slide illustrates learning and development programs for various teams. It provides information about communication, spreadsheet management, task management, reporting, finance, trading, analytics, dashboard, email writing, etc.This modern and well-arranged Positive Impact Of New Team Performance Management System Building Efficient Template PDF provides lots of creative possibilities. It is very simple to customize and edit with the Powerpoint Software. Just drag and drop your pictures into the shapes. All facets of this template can be edited with Powerpoint no extra software is necessary. Add your own material, put your images in the places assigned for them, adjust the colors, and then you can show your slides to the world, with an animated slide included.
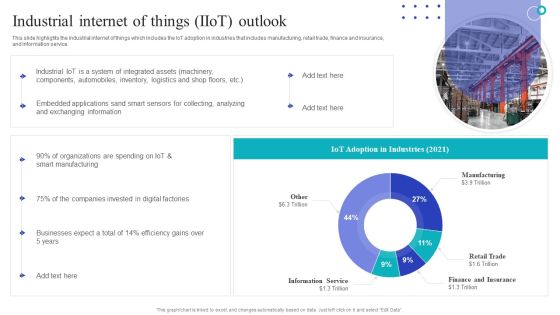
Global Internet Of Things In Manufacturing Industrial Internet Of Things Iiot Outlook Designs PDF
This slide highlights the industrial internet of things which includes the IoT adoption in industries that includes manufacturing, retail trade, finance and insurance, and information service. Slidegeeks is here to make your presentations a breeze with Global Internet Of Things In Manufacturing Industrial Internet Of Things Iiot Outlook Designs PDF With our easy-to-use and customizable templates, you can focus on delivering your ideas rather than worrying about formatting. With a variety of designs to choose from, youre sure to find one that suits your needs. And with animations and unique photos, illustrations, and fonts, you can make your presentation pop. So whether youre giving a sales pitch or presenting to the board, make sure to check out Slidegeeks first.

IOT Use Cases For Manufacturing Industrial Internet Of Things IIOT Outlook Graphics PDF
This slide highlights the industrial internet of things which includes the IoT adoption in industries that includes manufacturing, retail trade, finance and insurance, and information service. Slidegeeks is here to make your presentations a breeze with IOT Use Cases For Manufacturing Industrial Internet Of Things IIOT Outlook Graphics PDF With our easy to use and customizable templates, you can focus on delivering your ideas rather than worrying about formatting. With a variety of designs to choose from, you are sure to find one that suits your needs. And with animations and unique photos, illustrations, and fonts, you can make your presentation pop. So whether you are giving a sales pitch or presenting to the board, make sure to check out Slidegeeks first.

Business Process Diagrams Examples 3d Men With Heads Together PowerPoint Templates
We present our business process diagrams examples 3d men with heads together PowerPoint templates.Use our Finance PowerPoint Templates because Our PowerPoint Templates and Slides will give you great value for your money. Be assured of finding the best projection to highlight your words. Present our Business PowerPoint Templates because Our PowerPoint Templates and Slides are conceived by a dedicated team. Use them and give form to your wondrous ideas. Use our Shapes PowerPoint Templates because Our PowerPoint Templates and Slides team portray an attitude of elegance. Personify this quality by using them regularly. Use our People PowerPoint Templates because Our PowerPoint Templates and Slides are Clear and concise. Use them and dispel any doubts your team may have. Download our Curves and Lines PowerPoint Templates because You can Zap them with our PowerPoint Templates and Slides. See them reel under the impact.Use these PowerPoint slides for presentations relating to 3d, Abstract, Background, Blue, Bond, Bonding, Circle, Close, Colorful, Colors, Colorful, Design, Dimensional, Floor, Friends, Friendship, Graphic, Green, Group, Heads, Illustration, Isolated, Making, Men, Orange, People, Person, Purple, Red, Render, Rendering, Shape, Team, Teamwork, Three, Together, Togetherness, White. The prominent colors used in the PowerPoint template are Yellow, Red, Blue. Professionals tell us our business process diagrams examples 3d men with heads together PowerPoint templates will make the presenter look like a pro even if they are not computer savvy. The feedback we get is that our Circle PowerPoint templates and PPT Slides will make the presenter look like a pro even if they are not computer savvy. Professionals tell us our business process diagrams examples 3d men with heads together PowerPoint templates are visually appealing. People tell us our Bond PowerPoint templates and PPT Slides are effectively colour coded to prioritise your plans They automatically highlight the sequence of events you desire. PowerPoint presentation experts tell us our business process diagrams examples 3d men with heads together PowerPoint templates have awesome images to get your point across. You can be sure our Colorful PowerPoint templates and PPT Slides have awesome images to get your point across.
Business Intelligence Architecture Diagram 3d Man With Blue Puzzle PowerPoint Slides
We present our business intelligence architecture diagram 3d man with blue puzzle PowerPoint Slides.Download and present our People PowerPoint Templates because You can Channelise the thoughts of your team with our PowerPoint Templates and Slides. Urge them to focus on the goals you have set. Present our Business PowerPoint Templates because you can Set pulses racing with our PowerPoint Templates and Slides. They will raise the expectations of your team. Download our Puzzles or Jigsaws PowerPoint Templates because You will get more than you ever bargained for. Use our Success PowerPoint Templates because Our PowerPoint Templates and Slides are innately eco-friendly. Their high recall value negate the need for paper handouts. Use our Finance PowerPoint Templates because These PowerPoint Templates and Slides will give the updraft to your ideas. See them soar to great heights with ease.Use these PowerPoint slides for presentations relating to 3d, Assistance, Attached, Business, Concept, Connection, Construction, Decision, Development, Different, Element, Finishing, Game, Goal, Illustration, Individuality, Installing, Integration, Jigsaw, Jigsaw Puzzle, Last, Link, Man, Merge, Missing, Mosaic, One, Pavement, Paving, Piece, Problem Solving, Puzzle, Single, Slab, Solution, Strategy, Symbol, Tile, Unique, Vacancy. The prominent colors used in the PowerPoint template are Blue, White, Gray. Use our business intelligence architecture diagram 3d man with blue puzzle PowerPoint Slides have awesome images to get your point across. We assure you our Concept PowerPoint templates and PPT Slides provide great value for your money. Be assured of finding the best projection to highlight your words. Use our business intelligence architecture diagram 3d man with blue puzzle PowerPoint Slides will make you look like a winner. Customers tell us our Construction PowerPoint templates and PPT Slides are effectively colour coded to prioritise your plans They automatically highlight the sequence of events you desire. Presenters tell us our business intelligence architecture diagram 3d man with blue puzzle PowerPoint Slides will help you be quick off the draw. Just enter your specific text and see your points hit home. PowerPoint presentation experts tell us our Development PowerPoint templates and PPT Slides will get their audience's attention.

Business Intelligence Architecture Diagram 3d Man With Blue Puzzle Jigsaw PowerPoint Slides
We present our business intelligence architecture diagram 3d man with blue puzzle jigsaw PowerPoint Slides.Use our People PowerPoint Templates because You can Create a matrix with our PowerPoint Templates and Slides. Feel the strength of your ideas click into place. Download and present our Business PowerPoint Templates because Our PowerPoint Templates and Slides help you meet the demand of the Market. Just browse and pick the slides that appeal to your intuitive senses. Present our Puzzles or Jigsaws PowerPoint Templates because Our PowerPoint Templates and Slides will generate and maintain the level of interest you desire. They will create the impression you want to imprint on your audience. Download and present our Success PowerPoint Templates because Timeline crunches are a fact of life. Meet all deadlines using our PowerPoint Templates and Slides. Download our Finance PowerPoint Templates because You can Be the puppeteer with our PowerPoint Templates and Slides as your strings. Lead your team through the steps of your script.Use these PowerPoint slides for presentations relating to 3d, Assistance, Attached, Business, Concept, Connection, Construction, Decision, Development, Different, Element, Finishing, Game, Goal, Illustration, Individuality, Installing, Integration, Jigsaw, Jigsaw Puzzle, Last, Link, Man, Merge, Missing, Mosaic, One, Pavement, Paving, Piece, Problem Solving, Puzzle, Single, Slab, Solution, Strategy, Symbol, Tile, Unique, Vacancy. The prominent colors used in the PowerPoint template are Blue, Black, Gray. Use our business intelligence architecture diagram 3d man with blue puzzle jigsaw PowerPoint Slides provide great value for your money. Be assured of finding the best projection to highlight your words. We assure you our Decision PowerPoint templates and PPT Slides are designed by a team of presentation professionals. Use our business intelligence architecture diagram 3d man with blue puzzle jigsaw PowerPoint Slides are second to none. Customers tell us our Decision PowerPoint templates and PPT Slides help you meet deadlines which are an element of today's workplace. Just browse and pick the slides that appeal to your intuitive senses. Presenters tell us our business intelligence architecture diagram 3d man with blue puzzle jigsaw PowerPoint Slides are effectively colour coded to prioritise your plans They automatically highlight the sequence of events you desire. PowerPoint presentation experts tell us our Development PowerPoint templates and PPT Slides will get their audience's attention.

Diagram Of Business Cycle 3d Men Running Way Blue PowerPoint Templates
We present our diagram of business cycle 3d men running way blue PowerPoint templates.Download and present our Competition PowerPoint Templates because Our PowerPoint Templates and Slides are topically designed to provide an attractive backdrop to any subject. Present our Game PowerPoint Templates because Our PowerPoint Templates and Slides help you meet the demand of the Market. Just browse and pick the slides that appeal to your intuitive senses. Download and present our Shapes PowerPoint Templates because Our PowerPoint Templates and Slides will let you meet your Deadlines. Present our Success PowerPoint Templates because you should once Tap the ingenuity of our PowerPoint Templates and Slides. They are programmed to succeed. Download and present our People PowerPoint Templates because Our PowerPoint Templates and Slides offer you the widest possible range of options.Use these PowerPoint slides for presentations relating to 3d, Arrow, Background, Blue, Business, Businessman, Center, Champion, Competition, Concept, Corporate, Direction, Finance, Game, Gray, Group, Idea, Illustration, Isolated, Leader, Leadership, Line, Luck, Man, Money, People, Perfect, Play, Purpose, Race, Render, Run, Sport, Success, Symbol, Target, Three, Way, White, Win, Winner. The prominent colors used in the PowerPoint template are Blue, Gray, White. Professionals tell us our diagram of business cycle 3d men running way blue PowerPoint templates will save the presenter time. The feedback we get is that our Background PowerPoint templates and PPT Slides will make the presenter successul in his career/life. PowerPoint presentation experts tell us our diagram of business cycle 3d men running way blue PowerPoint templates will generate and maintain the level of interest you desire. They will create the impression you want to imprint on your audience. You can be sure our Blue PowerPoint templates and PPT Slides will generate and maintain the level of interest you desire. They will create the impression you want to imprint on your audience. People tell us our diagram of business cycle 3d men running way blue PowerPoint templates will help them to explain complicated concepts. You can be sure our Champion PowerPoint templates and PPT Slides will impress their bosses and teams.

PowerPoint Business Colorful Slide Of Five Text Circles Ppt 2 Templates
We present our powerpoint business colorful slide of five text circles ppt 2 templates.Present our Circle Charts PowerPoint Templates because Our PowerPoint Templates and Slides will definately Enhance the stature of your presentation. Adorn the beauty of your thoughts with their colourful backgrounds. Download and present our Ring Charts PowerPoint Templates because Our PowerPoint Templates and Slides help you meet the demand of the Market. Just browse and pick the slides that appeal to your intuitive senses. Use our Marketing PowerPoint Templates because Our PowerPoint Templates and Slides help you pinpoint your timelines. Highlight the reasons for your deadlines with their use. Download our Business PowerPoint Templates because You can Be the puppeteer with our PowerPoint Templates and Slides as your strings. Lead your team through the steps of your script. Download and present our Shapes PowerPoint Templates because Our PowerPoint Templates and Slides will let you Leave a lasting impression to your audiences. They possess an inherent longstanding recall factor.Use these PowerPoint slides for presentations relating to Boxes, brochure, business, button, catalog, chart, circle, company, cross, data, design, diagram, direction, document, financial, four, glossy, goals, graph, junction, management, market, marketing, model, multicolored, multiple, navigation, network, options, plan, presentation, process, purple, results, shiny, sphere, statistics. The prominent colors used in the PowerPoint template are Green, Gray, White. Professionals tell us our powerpoint business colorful slide of five text circles ppt 2 templates are designed by professionals Presenters tell us our chart PowerPoint templates and PPT Slides will make the presenter look like a pro even if they are not computer savvy. The feedback we get is that our powerpoint business colorful slide of five text circles ppt 2 templates are incredible easy to use. Use our circle PowerPoint templates and PPT Slides will impress their bosses and teams. You can be sure our powerpoint business colorful slide of five text circles ppt 2 templates provide you with a vast range of viable options. Select the appropriate ones and just fill in your text. Customers tell us our business PowerPoint templates and PPT Slides provide great value for your money. Be assured of finding the best projection to highlight your words.
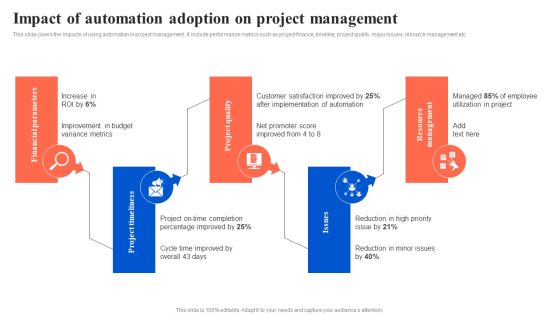
Workflow Automation For Optimizing Organizational Processes Impact Of Automation Adoption Themes PDF
This slide covers the impacts of using automation in project management . It include performance metrics such as project finance, timeline, project quality, major issues, resource management etc. This Workflow Automation For Optimizing Organizational Processes Impact Of Automation Adoption Themes PDF is perfect for any presentation, be it in front of clients or colleagues. It is a versatile and stylish solution for organizing your meetings. The Workflow Automation For Optimizing Organizational Processes Impact Of Automation Adoption Themes PDF features a modern design for your presentation meetings. The adjustable and customizable slides provide unlimited possibilities for acing up your presentation. Slidegeeks has done all the homework before launching the product for you. So, do not wait, grab the presentation templates today.

Dart On Target Board Picture Ppt PowerPoint Presentation Infographic Template Diagrams PDF
Presenting dart on target board picture ppt powerpoint presentation infographic template diagrams pdf to dispense important information. This template comprises two stages. It also presents valuable insights into the topics including dart on target board picture. This is a completely customizable PowerPoint theme that can be put to use immediately. So, download it and address the topic impactfully.

Important Strategic Priorities Of HR Management Ppt PowerPoint Presentation Diagram Templates PDF
Presenting important strategic priorities of hr management ppt powerpoint presentation diagram templates pdf to dispense important information. This template comprises three stages. It also presents valuable insights into the topics including daily local priorities, business priorities, annual crop priorities. This is a completely customizable PowerPoint theme that can be put to use immediately. So, download it and address the topic impactfully.

Relationship Between Payment Processor And Gateway Deploying Ecommerce Order Management Software Themes PDF
This slide represents the workflow of the payment gateways and their relation with payment processor. It includes transaction processing procedure which starts form placement of order by consumer on merchant web store and ends with fund settlement by payment processor.Are you searching for a Relationship Between Payment Processor And Gateway Deploying Ecommerce Order Management Software Themes PDF that is uncluttered, straightforward, and original Its easy to edit, and you can change the colors to suit your personal or business branding. For a presentation that expresses how much effort you have put in, this template is ideal With all of its features, including tables, diagrams, statistics, and lists, its perfect for a business plan presentation. Make your ideas more appealing with these professional slides. Download Relationship Between Payment Processor And Gateway Deploying Ecommerce Order Management Software Themes PDF from Slidegeeks today.

Employee Behavior Grid Chart For Performance Analysis Ppt PowerPoint Presentation Styles Objects PDF
Persuade your audience using this employee behavior grid chart for performance analysis ppt powerpoint presentation styles objects pdf. This PPT design covers four stages, thus making it a great tool to use. It also caters to a variety of topics including motivation, resources or environment, selection, training. Download this PPT design now to present a convincing pitch that not only emphasizes the topic but also showcases your presentation skills.

Agile Org Chart It Transformation Of Organizational Structure From Machines To Agile Organisms Download PDF
This slide covers the organizational structure transformation from machines org structure to leadership, team building and flexible agile org structure Deliver an awe inspiring pitch with this creative agile org chart it transformation of organizational structure from machines to agile organisms download pdf bundle. Topics like flexible resources, leadership shows direction, detailed instruction can be discussed with this completely editable template. It is available for immediate download depending on the needs and requirements of the user.
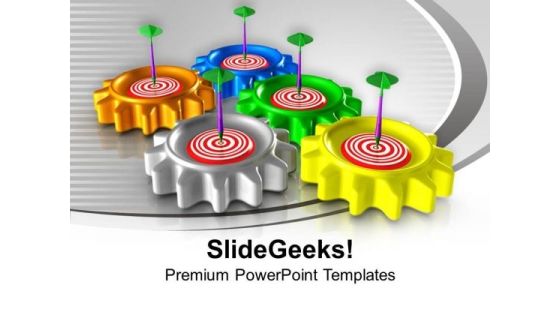
Target On Cogwheels Business PowerPoint Templates Ppt Backgrounds For Slides 1212
We present our Target On Cogwheels Business PowerPoint Templates PPT Backgrounds For Slides 1212.Use our Business PowerPoint Templates because the NASA Space programme took mankind to the moon and so much more. Like them you too can look far beyond normal boundaries. Show them that in your mind the sky is certainly not the limit. Download and present our Targets PowerPoint Templates because you should take your team soaring to the pinnacle they crave. Download our Gear wheels PowerPoint Templates because there is a very good saying that prevention is better than cure, either way you have a store of knowledge for sure. Use our Shapes PowerPoint Templates because chain reactions are the element of teamwork which add value to your efforts. Download and present our Competition PowerPoint Templates because the Gear train is a basic element of living and daily business.Use these PowerPoint slides for presentations relating to Target on gear wheels, business, targets, gear wheels, shapes, competition. The prominent colors used in the PowerPoint template are Orange, Green, Yellow. Customers tell us our Target On Cogwheels Business PowerPoint Templates PPT Backgrounds For Slides 1212 are Endearing. Presenters tell us our wheels PowerPoint templates and PPT Slides are Attractive. Presenters tell us our Target On Cogwheels Business PowerPoint Templates PPT Backgrounds For Slides 1212 are Zippy. The feedback we get is that our gear PowerPoint templates and PPT Slides are Stunning. Use our Target On Cogwheels Business PowerPoint Templates PPT Backgrounds For Slides 1212 are Precious. You can be sure our wheels PowerPoint templates and PPT Slides are readymade to fit into any presentation structure.
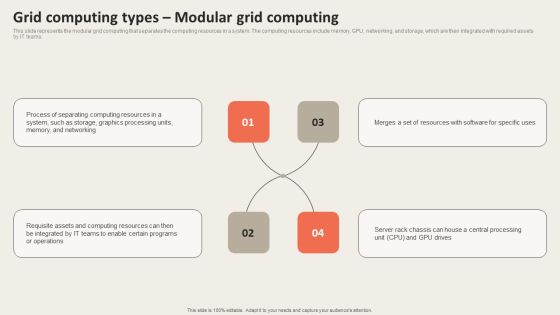
Grid Computing Types Modular Grid Computing Diagrams PDF
This slide represents the modular grid computing that separates the computing resources in a system. The computing resources include memory, GPU, networking, and storage, which are then integrated with required assets by IT teams. Whether you have daily or monthly meetings, a brilliant presentation is necessary. Grid Computing Types Modular Grid Computing Diagrams PDF can be your best option for delivering a presentation. Represent everything in detail using Grid Computing Types Modular Grid Computing Diagrams PDF and make yourself stand out in meetings. The template is versatile and follows a structure that will cater to your requirements. All the templates prepared by Slidegeeks are easy to download and edit. Our research experts have taken care of the corporate themes as well. So, give it a try and see the results.
Target With Darts Profit Success PowerPoint Templates And PowerPoint Themes 0212
Microsoft Powerpoint Templates and Background with target with darts
Bar Graph On Target Success PowerPoint Templates And PowerPoint Themes 0312
Microsoft Powerpoint Templates and Background with achieving business targets

Bar Graph With Success Business PowerPoint Templates And PowerPoint Themes 0312
Microsoft Powerpoint Templates and Background with business graph success

Colored Bar Graph With Person Success PowerPoint Templates And PowerPoint Themes 0312
Microsoft Powerpoint Templates and Background with success

Bar Graph With Arrow Success PowerPoint Templates And PowerPoint Themes 0412
Microsoft Powerpoint Templates and Background with graph of business
Colored Bar Graph With Success PowerPoint Templates And PowerPoint Themes 0412
Microsoft Powerpoint Templates and Background with business graph success

Bar Graph On Target Business PowerPoint Templates And PowerPoint Themes 0412
Microsoft Powerpoint Templates and Background with achieving business targets

Bar Graph On Target Marketing PowerPoint Templates And PowerPoint Themes 0412
Microsoft Powerpoint Templates and Background with achieving business targets
Bar Graph On Target Success PowerPoint Templates And PowerPoint Themes 0412
Microsoft Powerpoint Templates and Background with achieving business targets

Business People With Arrow Global PowerPoint Templates And PowerPoint Themes 0412
Microsoft Powerpoint Templates and Background with arrows business

3d Man Running After One Leadership PowerPoint Templates And PowerPoint Themes 1012
Deliver versatile Microsoft office PPT Presentations with our above template which contains an image of many persons running after the leader. This image identifies the concept of leadership, individuality and competition. Adjust the above image in your PPT presentations to visually support your content in your Business PPT slideshows Teamwork PPT leading a leader. Deliver amazing presentations to mesmerize your audience. Create captivating presentations to deliver comparative and weighted arguments.
Golden Keys With Business Words PowerPoint Templates And PowerPoint Themes 1012
Our compelling template consists of a design of two golden keys with business words. This image depicts the business concept. Adjust the above image in your PPT presentations to visually support your content in your Leadership and teamwork PPT slideshows security, strategy and success. Create captivating presentations to deliver comparative and weighted arguments.

Growth Bar Graph Up Business PowerPoint Templates And PowerPoint Themes 1012
Create visually stunning and define your PPT Presentations in a unique and inspiring manner using our above template which contains a graphic of growth bar graph. This image has been professionally designed to emphasize the concept of growth and success. This image has been conceived to enable you to emphatically communicate your ideas in your Business and Marketing PPT presentations. Go ahead and add charm to your presentations with our unique template.

Red Carpet For Winners Success PowerPoint Templates And PowerPoint Themes 1012
Use this template containing red carpet path to highlight the key issues of your presentation. This image represents the concept of competition and success. This image has been conceived to enable you to emphatically communicate your ideas in your Business PPT presentations showing award ceremony, entertainment and academy awards. Deliver amazing presentations to mesmerize your audience.
Success Key With Keywords Business PowerPoint Templates And PowerPoint Themes 1012
Create visually stunning and define your PPT Presentations in a unique and inspiring manner using our above template which contains a graphic of silver success key. This image has been professionally designed to emphasize the concept of innovation and strategy. It is a useful captivating tool concieved to enable you to define your message in your Business PPT presentations. Our PPT images are so perfectly designed that it reveals the very basis of our PPT template to make your clients understand.
Target With Question Mark Business PowerPoint Templates And PowerPoint Themes 1012
Visually support your Microsoft office PPT Presentation with our above template illustrating a target with a question mark on center. This image clearly defines the concept of an unknown target or unknown strategy to reach the goal. This image has been conceived to enable you to emphatically communicate your ideas in your Business PPT presentations on marketing, strategy and solution. Deliver amazing presentations to mesmerize your audience.

Stock Photo Theme Of Chess Game With Golden Piece PowerPoint Slide
Deliver amazing presentations with our above image which shows golden piece of chess game. It portrays the concept of game, strategy, competition etc. You are buzzing with ideas. Use this image to enthuse your colleagues.
Establish Management Team Project Performance Tracking Ppt Layouts Example File PDF
Purpose of this slide is to show the project performance tracking of each phase. It includes phase wise task, timeline, work status, budget status and performance indicator.Deliver an awe inspiring pitch with this creative establish management team project performance tracking ppt layouts example file pdf. bundle. Topics like Planning, Execution, Closure, Initiation, Performance Indicator can be discussed with this completely editable template. It is available for immediate download depending on the needs and requirements of the user.
Team Collaboration Of Project Management Project Performance Tracking Background PDF
Purpose of slide is to show the project performance tracking of each phase. It includes phase wise task, timeline, work status, budget status and performance indicator. Deliver an awe-inspiring pitch with this creative team collaboration of project management project performance tracking background pdf bundle. Topics like initiation, planning, execution, performance indicator, closure can be discussed with this completely editable template. It is available for immediate download depending on the needs and requirements of the user.
Team Forming For IT Project Project Performance Tracking Ppt Gallery Rules PDF
Purpose of slide is to show the project performance tracking of each phase. It includes phase wise task, timeline, work status, budget status and performance indicator. Deliver and pitch your topic in the best possible manner with this team forming for it project project performance tracking ppt gallery rules pdf. Use them to share invaluable insights on planning, execution, performance indicator and impress your audience. This template can be altered and modified as per your expectations. So, grab it now.

Construction Project Management Progress Report Elements PDF
This slide defines the construction project management status report. It includes information related to project name, manager, due date, budget, and risk.Pitch your topic with ease and precision using this Construction Project Management Progress Report Elements PDF. This layout presents information on Development Phase, Requirement Phase, Project Manager. It is also available for immediate download and adjustment. So, changes can be made in the color, design, graphics or any other component to create a unique layout.
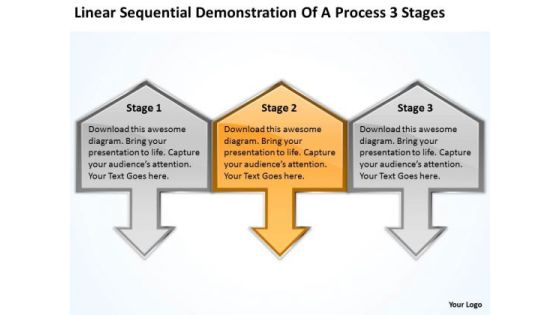
Sequential Demonstration Of Process 3 Stages Palo Alto Business Plan PowerPoint Templates
We present our sequential demonstration of process 3 stages palo alto business plan PowerPoint templates.Present our Arrows PowerPoint Templates because brilliant ideas popping up all over the place. Present our Marketing PowerPoint Templates because you can Explain the contribution of each of the elements and how they provide impetus to the next phase. Use our Finance PowerPoint Templates because these slides are the triggers of our growth. Use our Process and Flows PowerPoint Templates because this PPt Enlighten others on your team with your views. Download and present our Business PowerPoint Templates because this template helps you to grab the attention of your listeners.Use these PowerPoint slides for presentations relating to Arrow, Chart, Block, Diagram, Business, Chart, Design, Development, Diagram, Direction, Element, Flow, Chart, Flow, Diagram, Flowchart, Graph, Linear, Management, Organization, Process, Arrows, Process, Chart, Process, Diagram, Process, Flow, Program, Section, Sign, Solution, Symbol. The prominent colors used in the PowerPoint template are Yellow, Gray, Black. People tell us our sequential demonstration of process 3 stages palo alto business plan PowerPoint templates are Magical. Professionals tell us our Business PowerPoint templates and PPT Slides are Clever. Professionals tell us our sequential demonstration of process 3 stages palo alto business plan PowerPoint templates are Magical. Professionals tell us our Design PowerPoint templates and PPT Slides help you meet deadlines which are an element of today's workplace. Just browse and pick the slides that appeal to your intuitive senses. You can be sure our sequential demonstration of process 3 stages palo alto business plan PowerPoint templates are Ultra. Presenters tell us our Chart PowerPoint templates and PPT Slides are Sparkling.

BCG Matrix To Determine Existing Amazon Product Portfolio Template PDF
This slide provides information regarding BCG matrix as a planning tool that assists Amazon to assess product and services to ensure what it should keep, sell or invest more. Key elements of matrix are analyzed on market growth rate percent and relative market share. Whether you have daily or monthly meetings, a brilliant presentation is necessary. BCG Matrix To Determine Existing Amazon Product Portfolio Template PDF can be your best option for delivering a presentation. Represent everything in detail using BCG Matrix To Determine Existing Amazon Product Portfolio Template PDF and make yourself stand out in meetings. The template is versatile and follows a structure that will cater to your requirements. All the templates prepared by Slidegeeks are easy to download and edit. Our research experts have taken care of the corporate themes as well. So, give it a try and see the results.
