AI PPT Maker
Templates
PPT Bundles
Design Services
Business PPTs
Business Plan
Management
Strategy
Introduction PPT
Roadmap
Self Introduction
Timelines
Process
Marketing
Agenda
Technology
Medical
Startup Business Plan
Cyber Security
Dashboards
SWOT
Proposals
Education
Pitch Deck
Digital Marketing
KPIs
Project Management
Product Management
Artificial Intelligence
Target Market
Communication
Supply Chain
Google Slides
Research Services
 One Pagers
All Categories
-
Home
- Customer Favorites
- Cost Icon
Cost Icon

Coronavirus Impact On Fitness Industry Sample PDF
This slide covers the key impact of Covid 19 on fitness industry. Key impacts include decline in number of customers, job cuts, annual sales declines, burden of fixed expenses etc.Deliver an awe-inspiring pitch with this creative coronavirus impact on fitness industry sample pdf. bundle. Topics like decline in annual sale, public opinion on going to the gym during coronavirus can be discussed with this completely editable template. It is available for immediate download depending on the needs and requirements of the user.

Solution For The Problem Increase Focus On Advertising Ppt Visual Aids Model PDF
The slide shows the companys problem Decline in the sales of the company from six years and solution to mitigate the risk associated with the problem. Deliver and pitch your topic in the best possible manner with this solution for the problem increase focus on advertising ppt visual aids model pdf. Use them to share invaluable insights on technological, market share, advertising, expenses, requirement and impress your audience. This template can be altered and modified as per your expectations. So, grab it now.

Addressing Financial Projections Of Coworking Space Provider Summary PDF
This slide caters details about financial projections of coworking space provider progress for next five years with key assumptions, income statement, EBITDA. Deliver and pitch your topic in the best possible manner with this addressing financial projections of coworking space provider summary pdf. Use them to share invaluable insights on total revenue, expense, marketing, rate margin, service and impress your audience. This template can be altered and modified as per your expectations. So, grab it now.

Current Growth Status Of The Company Sample PDF
This slide shows Current Growth Performance of the company in terms of rise in Earning per Share and overall Company Revenue Deliver and pitch your topic in the best possible manner with this current growth status of the company sample pdf. Use them to share invaluable insights on increased revenue, stores worldwide, operational expenses and impress your audience. This template can be altered and modified as per your expectations. So, grab it now.
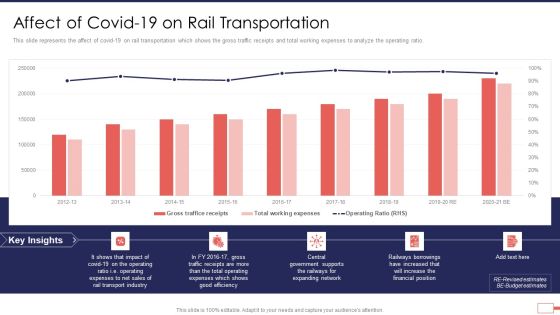
Iot Digital Twin Technology Post Covid Expenditure Management Affect Of Covid 19 On Rail Transportation Professional PDF
This slide represents the affect of covid-19 on rail transportation which shows the gross traffic receipts and total working expenses to analyze the operating ratio. Deliver an awe inspiring pitch with this creative iot digital twin technology post covid expenditure management affect of covid 19 on rail transportation professional pdf bundle. Topics like impact, operating, transport, industry, network can be discussed with this completely editable template. It is available for immediate download depending on the needs and requirements of the user.
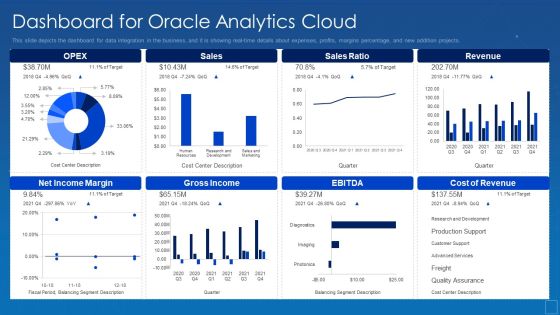
Oracle Cloud Data Analytics Administration IT Dashboard For Oracle Analytics Cloud Sample PDF
This slide depicts the dashboard for data integration in the business, and it is showing real-time details about expenses, profits, margins percentage, and new addition projects. Deliver an awe inspiring pitch with this creative oracle cloud data analytics administration it dashboard for oracle analytics cloud sample pdf bundle. Topics like dashboard for oracle analytics cloud can be discussed with this completely editable template. It is available for immediate download depending on the needs and requirements of the user.

Merger And Acquisition Due Diligence Key Financial Highlights Clipart PDF
This slide provides the financial highlights the key financial highlights of the firm. It covers gross profit margin, OPEX ratio, operating profit margin and net profit margin. Deliver and pitch your topic in the best possible manner with this merger and acquisition due diligence key financial highlights clipart pdf. Use them to share invaluable insights on revenue, gross profit, operating profit, expenses and impress your audience. This template can be altered and modified as per your expectations. So, grab it now.

Cyber Security Administration In Organization Financial Performance Tracking Dashboard Microsoft PDF
This slide presents the dashboard which will help firm in tracking the fiscal performance. This dashboard displays revenues and expenses trends and payment received analysis. Deliver and pitch your topic in the best possible manner with this cyber security administration in organization financial performance tracking dashboard microsoft pdf. Use them to share invaluable insights on financial performance tracking dashboard and impress your audience. This template can be altered and modified as per your expectations. So, grab it now.
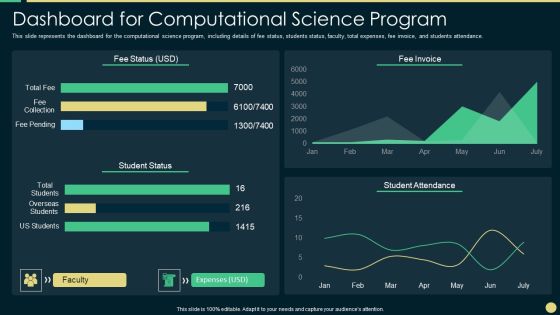
Scientific Computing IT Dashboard For Computational Science Program Ideas PDF
This slide represents the dashboard for the computational science program, including details of fee status, students status, faculty, total expenses, fee invoice, and students attendance.Deliver an awe inspiring pitch with this creative scientific computing it dashboard for computational science program ideas pdf bundle. Topics like dashboard for computational science program can be discussed with this completely editable template. It is available for immediate download depending on the needs and requirements of the user.
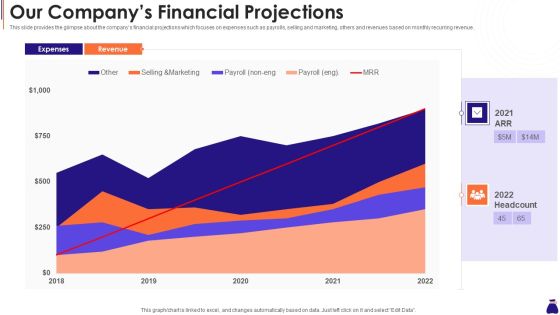
Round A Capital Raising Pitch Our Companys Financial Projections Ppt Portfolio Display PDF
This slide provides the glimpse about the companys financial projections which focuses on expenses such as payrolls, selling and marketing, others and revenues based on monthly recurring revenue. Deliver an awe inspiring pitch with this creative round a capital raising pitch our companys financial projections ppt portfolio display pdf bundle. Topics like our companys financial projections can be discussed with this completely editable template. It is available for immediate download depending on the needs and requirements of the user.

Organizational Program To Improve Team Productivity And Efficiency Discuss Team Achievements Designs PDF
This slide describes major achievement of team members under different departments as an overall impact of team building program of organization.Deliver and pitch your topic in the best possible manner with this organizational program to improve team productivity and efficiency discuss team achievements designs pdf Use them to share invaluable insights on better picture of performance, roles and responsibilities, unnecessary expenses and impress your audience. This template can be altered and modified as per your expectations. So, grab it now.

Agile QA Procedure Forfeiture Of Poor Quality Projects Topics PDF
This slide highlights the companys year over year financial statistics covering details about the loss incur, revenue generated, and expenses made. Deliver an awe inspiring pitch with this creative agile qa procedure forfeiture of poor quality projects topics pdf bundle. Topics like dashboard for tracking the agile quality assurance process effectiveness can be discussed with this completely editable template. It is available for immediate download depending on the needs and requirements of the user.

Agile Methodology Quality Control Forfeiture Of Poor Quality Projects Ppt Pictures Introduction PDF
This slide highlights the companys year over year financial statistics covering details about the loss incur, revenue generated, and expenses made. Deliver an awe inspiring pitch with this creative agile methodology quality control forfeiture of poor quality projects ppt pictures introduction pdf bundle. Topics like forfeiture of poor quality projects can be discussed with this completely editable template. It is available for immediate download depending on the needs and requirements of the user.

Feasibility Analysis Template Different Projects Start Up Ecommerce Business Background PDF
This slide provides the glimpse about the executive summary of the ecommerce business which focuses on business overview, market, service offerings, management team, keys to success. Deliver an awe inspiring pitch with this creative feasibility analysis template different projects start up ecommerce business background pdf bundle. Topics like Start up ecommerce business expenses summary can be discussed with this completely editable template. It is available for immediate download depending on the needs and requirements of the user.

Data Mining Implementation Dashboard For Data Mining Implementation Pictures PDF
This slide depicts the dashboard for data integration in the business, and it is showing real-time details about expenses, profits, margins percentage, and new addition projects.Deliver and pitch your topic in the best possible manner with this data mining implementation dashboard for data mining implementation pictures pdf Use them to share invaluable insights on dashboard for data mining implementation and impress your audience. This template can be altered and modified as per your expectations. So, grab it now.

Food Production Plant Management Dashboard Clipart PDF
This slide illustrates food production factory management dashboard. It provides information such as total production, active machines, sales revenue, shifts, expenses, manpower, rejected products, etc.Pitch your topic with ease and precision using this food production plant management dashboard clipart pdf This layout presents information on total production, active machines, sales revenue It is also available for immediate download and adjustment. So, changes can be made in the color, design, graphics or any other component to create a unique layout.
Ways To Enhance Organizations Profitability Financial Performance Tracking Dashboard Slides PDF
This slide presents the dashboard which will help firm in tracking the financial performance. This dashboard displays number of customers, vendors and revenues generated, expenses and profit incurred. Deliver and pitch your topic in the best possible manner with this ways to enhance organizations profitability financial performance tracking dashboard slides pdf Use them to share invaluable insights on asset rationalization, adjusting liability, capital moderation and impress your audience. This template can be altered and modified as per your expectations. So, grab it now.
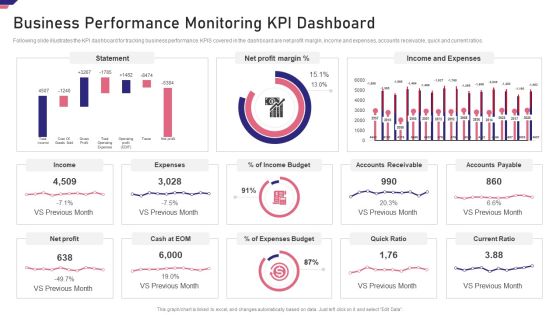
Mergers Acquisition Playbook Mergers Acquisition Playbook Business Performance Guidelines PDF
Following slide illustrates the KPI dashboard for tracking business performance. KPIS covered in the dashboard are net profit margin, income and expenses, accounts receivable, quick and current ratios.Deliver an awe inspiring pitch with this creative Mergers Acquisition Playbook Mergers Acquisition Playbook Business Performance Guidelines PDF bundle. Topics like Business Performance Monitoring KPI Dashboard can be discussed with this completely editable template. It is available for immediate download depending on the needs and requirements of the user.
Organizational Issue Resolution Tool Financial Performance Tracking Dashboard Background PDF
This slide presents the dashboard which will help firm in tracking the financial performance. This dashboard displays number of customers, vendors and revenues generated, expenses and profit incurred. Deliver an awe inspiring pitch with this creative Organizational Issue Resolution Tool Financial Performance Tracking Dashboard Background PDF bundle. Topics like Profit, Performance, Revenue can be discussed with this completely editable template. It is available for immediate download depending on the needs and requirements of the user.
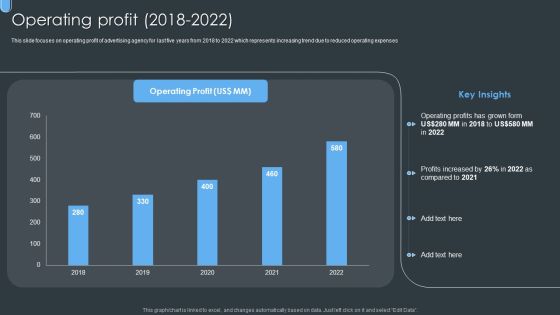
Digital Ad Marketing Services Company Profile Operating Profit 2018 To 2022 Formats PDF
This slide focuses on operating profit of advertising agency for last five years from 2018 to 2022 which represents increasing trend due to reduced operating expenses. Deliver and pitch your topic in the best possible manner with this Digital Ad Marketing Services Company Profile Operating Profit 2018 To 2022 Formats PDF. Use them to share invaluable insights on Operating Profit and impress your audience. This template can be altered and modified as per your expectations. So, grab it now.
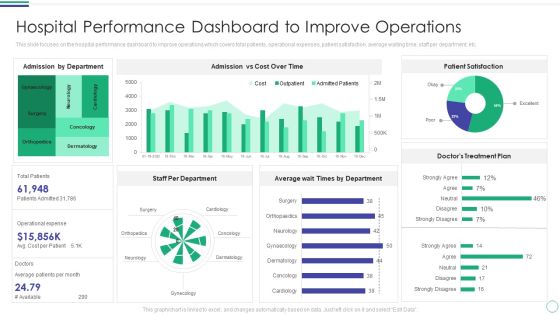
Hospital Performance Dashboard To Improve Operations Brochure PDF
This slide focuses on the hospital performance dashboard to improve operations which covers total patients, operational expenses, patient satisfaction, average waiting time, staff per department, etc.Deliver an awe inspiring pitch with this creative Hospital Performance Dashboard To Improve Operations Brochure PDF bundle. Topics like Admission Department, Staff Department, Patient Satisfaction can be discussed with this completely editable template. It is available for immediate download depending on the needs and requirements of the user.

Advertising Services Company Profile Operating Profit 2018 To 2022 Slides PDF
This slide focuses on operating profit of advertising agency for last five years from 2018 to 2022 which represents increasing trend due to reduced operating expenses. Deliver and pitch your topic in the best possible manner with this Advertising Services Company Profile Operating Profit 2018 To 2022 Slides PDF. Use them to share invaluable insights on Operating Profit and impress your audience. This template can be altered and modified as per your expectations. So, grab it now.

Securities Allocation Dashboard For Project Metrics Information PDF
This slide shows the securities allocation dashboard for project management which focuses on expenses incurred on project which includes cash, commends, revenues and inventory with total allocation of securities with the percentage. Showcasing this set of slides titled Securities Allocation Dashboard For Project Metrics Information PDF. The topics addressed in these templates are Inventory, Project, Revenues. All the content presented in this PPT design is completely editable. Download it and make adjustments in color, background, font etc. as per your unique business setting.

Computational Science Methodology Dashboard For Computational Science Program Structure PDF
This slide represents the dashboard for the computational science program, including details of fee status, students status, faculty, total expenses, fee invoice, and students attendance. Deliver an awe inspiring pitch with this creative Computational Science Methodology Dashboard For Computational Science Program Structure PDF bundle. Topics like Dashboard, Computational Science Program can be discussed with this completely editable template. It is available for immediate download depending on the needs and requirements of the user.
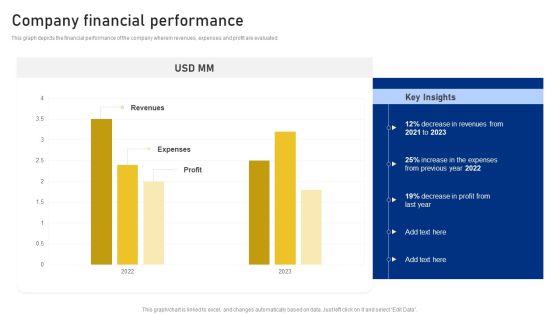
Reshaping Business In Digital Company Financial Performance Sample PDF
This graph depicts the financial performance of the company wherein revenues, expenses and profit are evaluated. Deliver and pitch your topic in the best possible manner with this Reshaping Business In Digital Company Financial Performance Sample PDF. Use them to share invaluable insights on Decrease Revenues, 2021 To 2023, Profit and impress your audience. This template can be altered and modified as per your expectations. So, grab it now.

Dashboard For Computational Science Program Designs PDF
This slide represents the dashboard for the computational science program, including details of fee status, students status, faculty, total expenses, fee invoice, and students attendance.Deliver and pitch your topic in the best possible manner with this Dashboard For Computational Science Program Designs PDF. Use them to share invaluable insights on Student Status, Invoice, Student Attendance and impress your audience. This template can be altered and modified as per your expectations. So, grab it now.
Insurance Claim Procedure Tracking Dashboard Ppt PowerPoint Presentation Show Samples PDF
This slide showcases the insurance claim process tracking dashboard. It includes elements such as claim amount, payout and denied claims and status analysis.Pitch your topic with ease and precision using this Insurance Claim Procedure Tracking Dashboard Ppt PowerPoint Presentation Show Samples PDF. This layout presents information on Amount Comparison, Claim Expense, Assured Amount. It is also available for immediate download and adjustment. So, changes can be made in the color, design, graphics or any other component to create a unique layout.

Property And Casualties Insurance Business Profile Combined Ratio Split Mockup PDF
The slide showcases the combined ratio split claim ratio and expense ratio of an insurance company for last five financial years. It helps in evaluating the overall profitability of the company. Deliver and pitch your topic in the best possible manner with this Property And Casualties Insurance Business Profile Combined Ratio Split Mockup PDF. Use them to share invaluable insights on Combined Ratio Split and impress your audience. This template can be altered and modified as per your expectations. So, grab it now.
Vendor Contract Management Tracking Sheet Vendor Management Strategies Download PDF
The following slide vendor contract management tracking sheet. It provides information about procurement, quality, planning, production, duration, notice period, notice days, active contract, supplier, outsource, purchase, etc. Deliver an awe inspiring pitch with this creative Vendor Contract Management Tracking Sheet Vendor Management Strategies Download PDF bundle. Topics like Contract Expenses, Per Department, Related Department can be discussed with this completely editable template. It is available for immediate download depending on the needs and requirements of the user.

Strategic Management Consultancy Business Profile Annual Revenue And Net Profits Microsoft PDF
This slide showcases revenue and net profits of our consulting company for last five years from 2018 to 2022 which shows increasing trend year after year. Deliver an awe inspiring pitch with this creative Strategic Management Consultancy Business Profile Annual Revenue And Net Profits Microsoft PDF bundle. Topics like Reduced Operating Expenses, Revenue can be discussed with this completely editable template. It is available for immediate download depending on the needs and requirements of the user.

Financial Summary Report For Organizational Activities Ppt Summary Graphics Template PDF
This slide represents financial statement snapshot showcasing organizational activities. It covers public support, expenditure, assets, liabilities and net assets. Pitch your topic with ease and precision using this Financial Summary Report For Organizational Activities Ppt Summary Graphics Template PDF. This layout presents information on Public Support, Other Revenue, Expenses. It is also available for immediate download and adjustment. So, changes can be made in the color, design, graphics or any other component to create a unique layout.
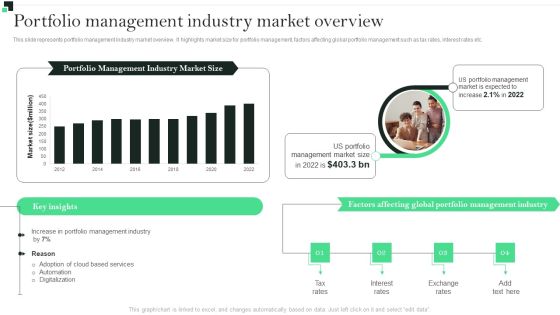
Portfolio Management Industry Market Overview Strategies To Enhance Portfolio Management Elements PDF
This slide represents portfolio management industry market overview. It highlights market size for portfolio management, factors affecting global portfolio management such as tax rates, interest rates etc.Coming up with a presentation necessitates that the majority of the effort goes into the content and the message you intend to convey. The visuals of a PowerPoint presentation can only be effective if it supplements and supports the story that is being told. Keeping this in mind our experts created Portfolio Management Industry Market Overview Strategies To Enhance Portfolio Management Elements PDF to reduce the time that goes into designing the presentation. This way, you can concentrate on the message while our designers take care of providing you with the right template for the situation.

Reviewing Operations And Expenditures Through Cash Flow Statement Slides PDF
The following slide depicts reviewing operations and expenditure through cash flow statement. It provides information about sales tax, liabilities, borrowings, cash spending, bill payments, repayment, etc.Here you can discover an assortment of the finest PowerPoint and Google Slides templates. With these templates, you can create presentations for a variety of purposes while simultaneously providing your audience with an eye-catching visual experience. Download Reviewing Operations And Expenditures Through Cash Flow Statement Slides PDF to deliver an impeccable presentation. These templates will make your job of preparing presentations much quicker, yet still, maintain a high level of quality. Slidegeeks has experienced researchers who prepare these templates and write high-quality content for you. Later on, you can personalize the content by editing the Reviewing Operations And Expenditures Through Cash Flow Statement Slides PDF.
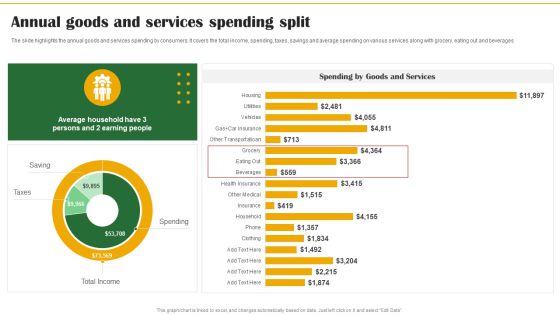
Food Organization Financial Trends Annual Goods And Services Spending Split Slides PDF
The slide highlights the annual goods and services spending by consumers. It covers the total income, spending, taxes, savings and average spending on various services along with grocery, eating out and beverages. Crafting an eye-catching presentation has never been more straightforward. Let your presentation shine with this tasteful yet straightforward Food Organization Financial Trends Annual Goods And Services Spending Split Slides PDF template. It offers a minimalistic and classy look that is great for making a statement. The colors have been employed intelligently to add a bit of playfulness while still remaining professional. Construct the ideal Food Organization Financial Trends Annual Goods And Services Spending Split Slides PDF that effortlessly grabs the attention of your audience Begin now and be certain to wow your customers.

Nestle Performance Management Report Analyzing Income Statement Annually To Monitor Brochure PDF
This slide provides glimpse about year over year profit and loss statement to assess the profitability of Nestle SA. It includes net sales, EBITDA, operating profit, operating margin, pre-tax benefit, net income, net margin, etc. Create an editable Nestle Performance Management Report Analyzing Income Statement Annually To Monitor Brochure PDF that communicates your idea and engages your audience. Whether you are presenting a business or an educational presentation, pre-designed presentation templates help save time. Nestle Performance Management Report Analyzing Income Statement Annually To Monitor Brochure PDF is highly customizable and very easy to edit, covering many different styles from creative to business presentations. Slidegeeks has creative team members who have crafted amazing templates. So, go and get them without any delay.

Herbal Products Company Profile Revenue Operating Profit And PAT Clipart PDF
This slide highlights the Dabur company financials from 2017 to 22 which includes revenue from operations, operating profit and profit after tax. Slidegeeks is here to make your presentations a breeze with Herbal Products Company Profile Revenue Operating Profit And PAT Clipart PDF With our easy to use and customizable templates, you can focus on delivering your ideas rather than worrying about formatting. With a variety of designs to choose from, you are sure to find one that suits your needs. And with animations and unique photos, illustrations, and fonts, you can make your presentation pop. So whether you are giving a sales pitch or presenting to the board, make sure to check out Slidegeeks first.
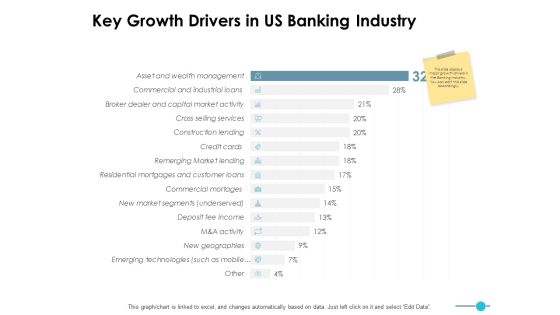
Key Growth Drivers In Us Banking Industry Ppt PowerPoint Presentation Pictures Outline
This is a key growth drivers in us banking industry ppt powerpoint presentation pictures outline. The topics discussed in this diagram are marketing, business, management, planning, strategy This is a completely editable PowerPoint presentation, and is available for immediate download.

Key Us Banking Industry Statistics Ppt PowerPoint Presentation File Visual Aids
This is a key us banking industry statistics ppt powerpoint presentation file visual aids. The topics discussed in this diagram are marketing, business, management, planning, strategy This is a completely editable PowerPoint presentation, and is available for immediate download.
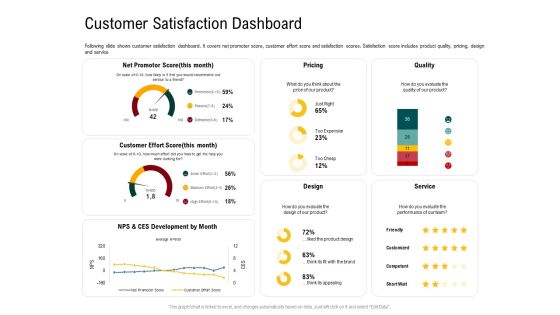
IOT Industry Assessment Customer Satisfaction Dashboard Ppt Show Outfit PDF
Following slide shows customer satisfaction dashboard. It covers net promoter score, customer effort score and satisfaction scores. Satisfaction score includes product quality, pricing, design and service. Deliver an awe inspiring pitch with this creative iot industry assessment customer satisfaction dashboard ppt show outfit pdf bundle. Topics like pricing, quality, design, service can be discussed with this completely editable template. It is available for immediate download depending on the needs and requirements of the user.
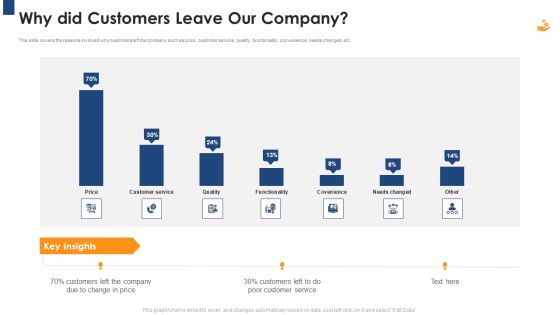
Income Management Tool Why Did Customers Leave Our Company Infographics PDF
This slide covers the reasons involved why customers left the company such as price, customer service, quality, functionality, convenience, needs changed, etc. Deliver and pitch your topic in the best possible manner with this income management tool why did customers leave our company infographics pdf. Use them to share invaluable insights on price, customer service, quality, functionality, convenience, needs changed and impress your audience. This template can be altered and modified as per your expectations. So, grab it now.
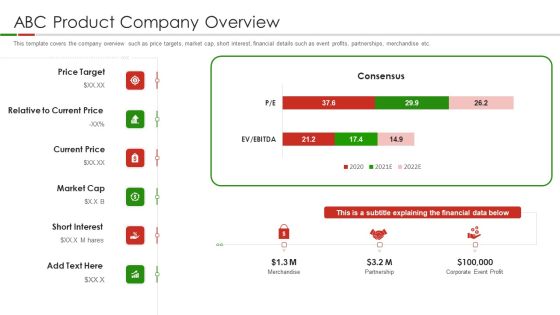
Organic Food Pitch Deck ABC Product Company Overview Ppt Infographics Styles PDF
This template covers the company overview such as price targets, market cap, short interest, financial details such as event profits, partnerships, merchandise etc. Deliver an awe inspiring pitch with this creative organic food pitch deck abc product company overview ppt infographics styles pdf bundle. Topics like merchandise, partnership, corporate event profit, financial data, price target can be discussed with this completely editable template. It is available for immediate download depending on the needs and requirements of the user.
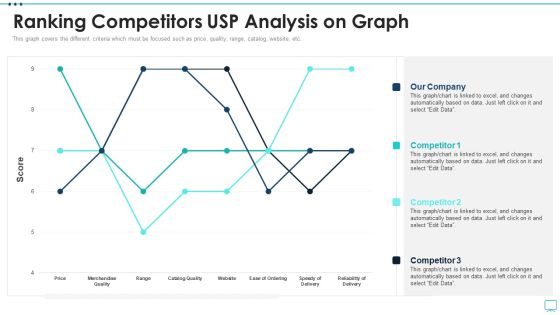
Strategic Business Plan Effective Tools Ranking Competitors USP Analysis On Graph Designs PDF
This graph covers the different criteria which must be focused such as price, quality, range, catalog, website, etc. Deliver and pitch your topic in the best possible manner with this strategic business plan effective tools ranking competitors usp analysis on graph designs pdf. Use them to share invaluable insights on price, merchandise quality, catalog quality, speedy delivery and impress your audience. This template can be altered and modified as per your expectations. So, grab it now.

Retail Store Marketing And Operations Dashboard Mockup PDF
This slide covers retail store sales and operation dashboard. It involves revenue by sales, number if customers, average transaction price, average units per consumer etc. Pitch your topic with ease and precision using this Retail Store Marketing And Operations Dashboard Mockup PDF. This layout presents information on Revenue By Sales, Customer, Average Transaction Price. It is also available for immediate download and adjustment. So, changes can be made in the color, design, graphics or any other component to create a unique layout.
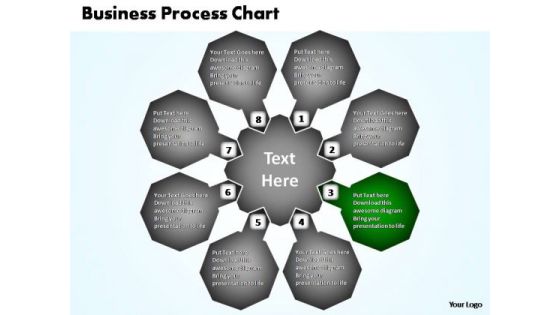
PowerPoint Slide Image Business Process Chart Ppt Designs
Use this diagram to show the relationship to a central idea. Emphasizes on both information in the center circle and how information in the outer ring of circles contributes to the central idea
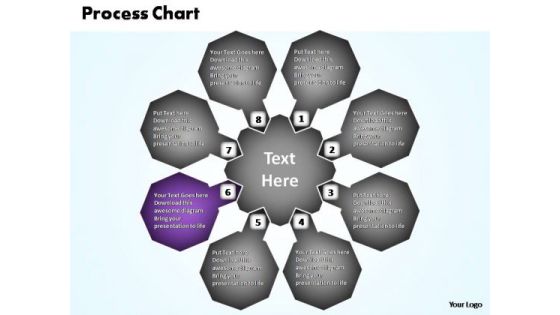
PowerPoint Slide Leadership Business Process Chart Ppt Process
Use this diagram to show the relationship to a central idea. Emphasizes on both information in the center circle and how information in the outer ring of circles contributes to the central idea

A To Z Education PowerPoint Templates And PowerPoint Themes 1012
This template with an image of A to Z blocks helps you chart the course of your presentation. This image represents the concept of back to school, academic, future and education. Our awesome image makes your presentations simpler and professional showing that you care about even the smallest details. Get the advantage to your presentations with our stunning template. Deliver amazing presentations to mesmerize your audience. Create captivating presentations to deliver comparative and weighted arguments.

8 Stages Hub And Spoke Model Create Business Plan Free PowerPoint Slides
We present our 8 stages hub and spoke model create business plan free PowerPoint Slides.Present our Arrows PowerPoint Templates because you should Whip up a frenzy with our PowerPoint Templates and Slides. They will fuel the excitement of your team. Download our Circle Charts PowerPoint Templates because Our PowerPoint Templates and Slides will fulfill your every need. Use them and effectively satisfy the desires of your audience. Download and present our Process and Flows PowerPoint Templates because Our PowerPoint Templates and Slides will let your team Walk through your plans. See their energy levels rise as you show them the way. Download and present our Business PowerPoint Templates because Our PowerPoint Templates and Slides will give good value for money. They also have respect for the value of your time. Download our Flow Charts PowerPoint Templates because You can Be the puppeteer with our PowerPoint Templates and Slides as your strings. Lead your team through the steps of your script.Use these PowerPoint slides for presentations relating to Diagram, flowchart, flow, arrow, process, connection, chart, connect, connectivity, corporate, business, plan, president, concept, teamwork, graphical, data, important, supervisor, relation, graph, box, steps, glassy, administration, design, group, color, highlight, organization,organize, global, manager, office, financial, ceo, structure, officer. The prominent colors used in the PowerPoint template are Pink, Gray, Black.

Young Business People Pie Chart Marketing PowerPoint Templates Ppt Backgrounds For Slides
We present our young business people pie chart marketing PowerPoint templates PPT backgrounds for slides.Download our Business PowerPoint Templates because These PowerPoint Templates and Slides will give the updraft to your ideas. See them soar to great heights with ease. Present our Finance PowerPoint Templates because you can Set pulses racing with our PowerPoint Templates and Slides. They will raise the expectations of your team. Download and present our Marketing PowerPoint Templates because Your ideas provide food for thought. Our PowerPoint Templates and Slides will help you create a dish to tickle the most discerning palate. Use our People PowerPoint Templates because They will Put the wind in your sails. Skim smoothly over the choppy waters of the market. Download and present our Success PowerPoint Templates because Our PowerPoint Templates and Slides will embellish your thoughts. See them provide the desired motivation to your team.Use these PowerPoint slides for presentations relating to 3d, analysis, boardroom, business, cartoon, character, chart, clipart, committee, company, concept, corporate, council, directors, display, document, economics, executive, figure, finance, financial, group, growth, guy, human, management, market, meeting, performance, presentation, report, table, team. The prominent colors used in the PowerPoint template are Black, White, Gray. The feedback we get is that our young business people pie chart marketing PowerPoint templates PPT backgrounds for slides are designed by a team of presentation professionals. Professionals tell us our committee PowerPoint templates and PPT Slides help you meet deadlines which are an element of today's workplace. Just browse and pick the slides that appeal to your intuitive senses. PowerPoint presentation experts tell us our young business people pie chart marketing PowerPoint templates PPT backgrounds for slides are visually appealing. People tell us our character PowerPoint templates and PPT Slides are readymade to fit into any presentation structure. Presenters tell us our young business people pie chart marketing PowerPoint templates PPT backgrounds for slides will make the presenter successul in his career/life. Professionals tell us our chart PowerPoint templates and PPT Slides are effectively colour coded to prioritise your plans They automatically highlight the sequence of events you desire.
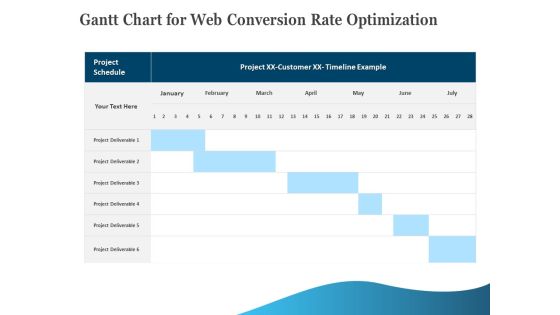
Gantt Chart For Web Conversion Rate Optimization Download PDF
Your complex projects can be managed and organized simultaneously using this detailed gantt chart for web conversion rate optimization download pdf template. Track the milestones, tasks, phases, activities, and subtasks to get an updated visual of your project. Share your planning horizon and release plan with this well-crafted presentation template. This exemplary template can be used to plot various dependencies to distinguish the tasks in the pipeline and their impact on the schedules and deadlines of the project. Apart from this, you can also share this visual presentation with your team members and stakeholders. It a resourceful tool that can be incorporated into your business structure. Therefore, download and edit it conveniently to add the data and statistics as per your requirement.

Post Implementation Impact Of Software Development Life Cycle Models Diagrams PDF
This slide depicts the post-implementation impact of SDLC models, such as the waterfall, agile, spiral, and scrum, including the performance of the teams in terms of predictability, productivity, quality, and responsiveness. Deliver an awe inspiring pitch with this creative overview of the software development life cycle company demonstration pdf bundle. Topics like maintenance of the product, requirement gathering and analysis, deployment in the market can be discussed with this completely editable template. It is available for immediate download depending on the needs and requirements of the user.
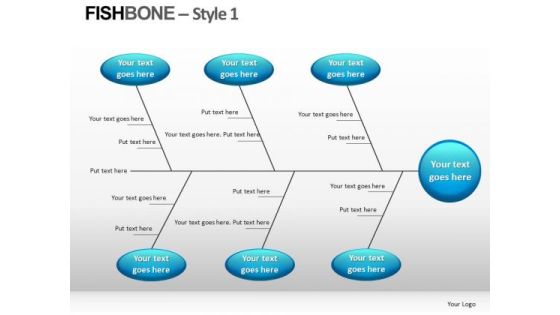
Cause Analysis Fishbone Diagram PowerPoint Slides
Cause Analysis FishBone Diagram PowerPoint Slides-These high quality powerpoint pre-designed slides and powerpoint templates have been carefully created by our professional team to help you impress your audience. All slides have been created and are 100% editable in powerpoint. Each and every property of any graphic - color, size, orientation, shading, outline etc. can be modified to help you build an effective powerpoint presentation. Any text can be entered at any point in the powerpoint template or slide. Simply DOWNLOAD, TYPE and PRESENT!
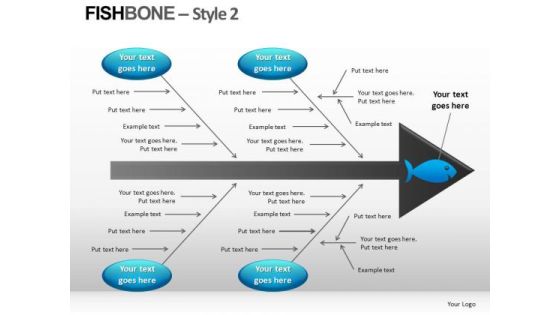
Fishbone Diagram Templates For PowerPoint Ppt
FishBone Diagram Templates for PowerPoint PPT-These high quality powerpoint pre-designed slides and powerpoint templates have been carefully created by our professional team to help you impress your audience. All slides have been created and are 100% editable in powerpoint. Each and every property of any graphic - color, size, orientation, shading, outline etc. can be modified to help you build an effective powerpoint presentation. Any text can be entered at any point in the powerpoint template or slide. Simply DOWNLOAD, TYPE and PRESENT!

Clustered Column-Line Ppt PowerPoint Presentation Ideas Diagrams
This is a clustered column-line ppt powerpoint presentation ideas diagrams. This is a three stage process. The stages in this process are clustered column line, business, finance, marketing, strategy.
Four Networks Optimum Operations Financial Planning Ppt PowerPoint Presentation Complete Deck With Slides
If designing a presentation takes a lot of your time and resources and you are looking for a better alternative, then this four networks optimum operations financial planning ppt powerpoint presentation complete deck with slides is the right fit for you. This is a prefabricated set that can help you deliver a great presentation on the topic. All the twelve slides included in this sample template can be used to present a birds-eye view of the topic. These slides are also fully editable, giving you enough freedom to add specific details to make this layout more suited to your business setting. Apart from the content, all other elements like color, design, theme are also replaceable and editable. This helps in designing a variety of presentations with a single layout. Not only this, you can use this PPT design in formats like PDF, PNG, and JPG once downloaded. Therefore, without any further ado, download and utilize this sample presentation as per your liking.
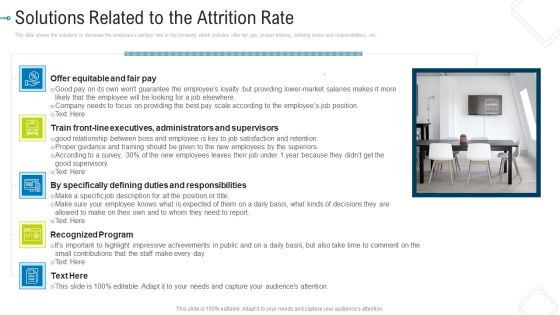
Solutions Related To The Attrition Rate Diagrams PDF
Presenting solutions related to the attrition rate diagrams pdf to provide visual cues and insights. Share and navigate important information on fiveThis slide shows the solutions to decrease the employees attrition rate in the company which includes offer fair pay, proper training, defining duties and responsibilities, etc. stages that need your due attention. This template can be used to pitch topics like solutions related to the attrition rate diagrams pdf. In addtion, this PPT design contains high resolution images, graphics, etc, that are easily editable and available for immediate download.
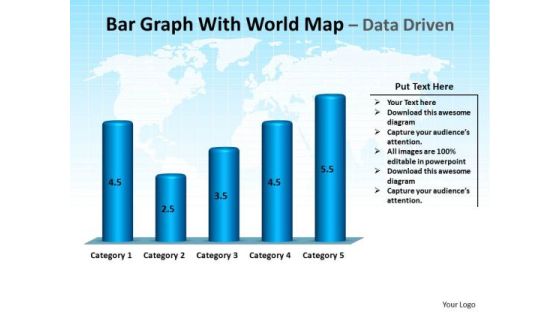
Business Success PowerPoint Templates Business Bar Graph With World Map Ppt Slides
Business Success PowerPoint Templates Business bar graph with world map PPT Slides-This PowerPoint Template is a illustration of bar garph with world map on blue background -Business Success PowerPoint Templates Business bar graph with world map PPT Slides-This ppt can be used for concepts relating to-animated, business, finance, sales, marketing, accounting, future, education, america, Antarctica, arrow, Asia, charts, statistics, budget, investment, abstract, australia, background, bar, blue, calculation, company and continents.
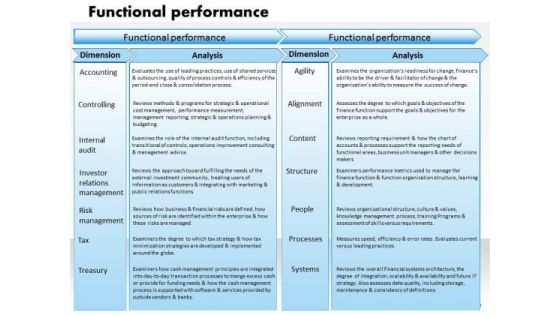
Business Framework Functional Performance PowerPoint Presentation
This image slide has been designed to displays functional performance diagram. This image slide has been designed with textboxes horizontal process diagram with functional performance, dimensions and analysis attributes. Use this image slide in business and marketing presentations to depict accounting, risk management, tax and various dimensions of business. This image slide will enhance the quality of your presentations.

Five Work Areas With Project Schedule Chart Ppt PowerPoint Presentation File Examples PDF
Showcasing this set of slides titled five work areas with project schedule chart ppt powerpoint presentation file examples pdf. The topics addressed in these templates are risk and issues, budget, resourcing. All the content presented in this PPT design is completely editable. Download it and make adjustments in color, background, font etc. as per your unique business setting.

PowerPoint Presentation Chart Circular Arrows Ppt Backgrounds
PowerPoint_Presentation_Chart_Circular_Arrows_PPT_Backgrounds Business PowerPoints-Explore the various directions and layers existing in your in your plans and processes. Unravel the desired and essential elements of your overall strategy. Explain the relevance of the different layers and stages and directions in getting down to your core competence, ability and desired result.-These amazing PowerPoint pre-designed slides and PowerPoint templates have been carefully created by our team of experts to help you impress your audience. Our stunning collection of Powerpoint slides are 100% editable and can easily fit in any PowerPoint presentations. By using these animations and graphics in PowerPoint and you can easily make professional presentations. Any text can be entered at any point in the PowerPoint template or slide. Just DOWNLOAD our awesome PowerPoint templates and you are ready to go.

Circular Looped Process 6 Stages Outline For Business Plan PowerPoint Templates
We present our circular looped process 6 stages outline for business plan PowerPoint templates.Download our Finance PowerPoint Templates because You can Channelise the thoughts of your team with our PowerPoint Templates and Slides. Urge them to focus on the goals you have set. Present our Marketing PowerPoint Templates because It is Aesthetically crafted by artistic young minds. Our PowerPoint Templates and Slides are designed to display your dexterity. Download our Business PowerPoint Templates because Our PowerPoint Templates and Slides will bullet point your ideas. See them fall into place one by one. Download our Circle Charts PowerPoint Templates because Our PowerPoint Templates and Slides will Embellish your thoughts. They will help you illustrate the brilliance of your ideas. Present our Process and Flows PowerPoint Templates because You have belief amd faith in your futuristic plans. Chalk them out for your team with our PowerPoint Templates and Slides.Use these PowerPoint slides for presentations relating to Chart, wheel, pie, graph, vector, process, marketing, diagram, business, catalog, website, network, statistics, model, document, junction, plan, presentation, template, circle, brochure, data, stock, management, box, options, direction, design, company, navigation, financial, structure, button, goals, results. The prominent colors used in the PowerPoint template are Pink, Gray, Black.
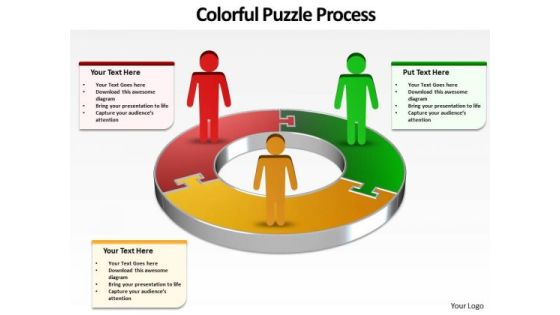
Ppt Group Of People Presentation Layouts Circular Puzzle PowerPoint Templates
PPT group of people presentation layouts circular puzzle PowerPoint Templates-An excellent graphics that help you convey your ideas successfully - no matter what they are. You can easily collaborate this PowerPoint diagram with colleagues to create detailed process diagrams and use them as a key element in streamlining your processes. This image has been conceived to enable you to emphatically communicate your ideas in your Business and Marketing PPT presentations. Our PPT images are so ideally designed that it reveals the very basis of our PPT diagrams and are an effective tool to make your clients understand.-PPT group of people presentation layouts circular puzzle PowerPoint Templates-abstract, accounting, background, business, businessman, chart, company, connection, corporate, diagram, earnings, finance, forecast, graph, growth, investment, management, network, people, profit, progress, puzzle, shapes, team, technology, vector, wealth

PowerPoint Layouts Chart Quadrants Ppt Templates
PowerPoint Layouts Chart Quadrants PPT Templates-The Circle of Life - a concept emmbedded in our minds and hence easy to comprehend. Life and Business is made up of processes comprising stages that flow from one to another. An excellent graphic to attract the attention of and understanding by your audience to improve earnings.
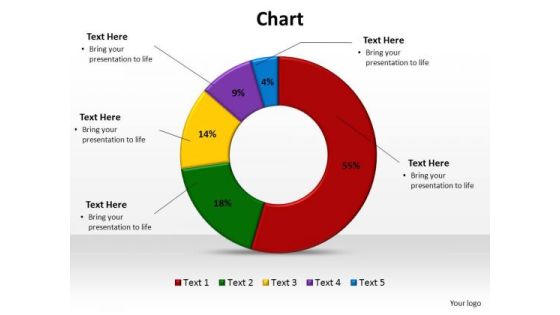
PowerPoint Layouts Image Chart Ppt Design
PowerPoint Layouts Image Chart PPT Design-The Circle of Life - a concept emmbedded in our minds and hence easy to comprehend. Life and Business is made up of processes comprising stages that flow from one to another. An excellent graphic to attract the attention of and understanding by your audience to improve earnings.
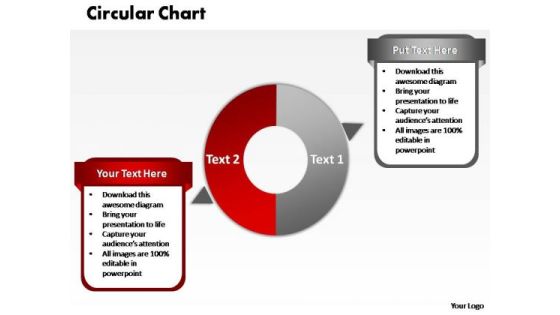
PowerPoint Slide Image Circular Chart Ppt Presentation
PowerPoint Slide Image Circular Chart PPT Presentation-The Circle of Life - a concept emmbedded in our minds and hence easy to comprehend. Life and Business is made up of processes comprising stages that flow from one to another. An excellent graphic to attract the attention of and understanding by your audience to improve earnings.
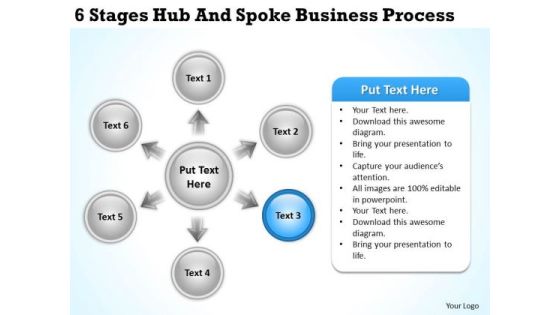
Diagram Business Process New PowerPoint Presentation Templates
We present our Diagram Business Process New Powerpoint Presentation Templates.Download our Arrows PowerPoint Templates because Our PowerPoint Templates and Slides will let your team Walk through your plans. See their energy levels rise as you show them the way. Present our Business PowerPoint Templates because Your success is our commitment. Our PowerPoint Templates and Slides will ensure you reach your goal. Use our Circle Charts PowerPoint Templates because Our PowerPoint Templates and Slides will definately Enhance the stature of your presentation. Adorn the beauty of your thoughts with their colourful backgrounds. Use our Shapes PowerPoint Templates because You can Zap them with our PowerPoint Templates and Slides. See them reel under the impact. Use our Process and Flows PowerPoint Templates because Our PowerPoint Templates and Slides will let you Clearly mark the path for others to follow.Use these PowerPoint slides for presentations relating to Abstract, Arrow, Blue, Business, Button, Chart, Circle, Company, Cross, Data, Design, Diagram, Direction, Document, Financial, Five, Function, Green, Management, Market, Marketing, Model, Multicolored, Multiple, Navigation, Network, Options, Orange, Plan, Presentation, Process, Red, Results, Shiny, Sphere, Statistics, Structure, Template, Three, Vector, Website, Wheel. The prominent colors used in the PowerPoint template are Blue, Black, Gray.

Column Chart Ppt PowerPoint Presentation Slide Download
This is a column chart ppt powerpoint presentation slide download. This is a two stage process. The stages in this process are business, marketing, graph, success, growth.

Combo Chart Ppt PowerPoint Presentation Pictures
This is a combo chart ppt powerpoint presentation pictures. This is a three stage process. The stages in this process are graph, success, growth, business, marketing.

Area Chart Ppt PowerPoint Presentation Show
This is a area chart ppt powerpoint presentation show. This is a two stage process. The stages in this process are sales in percentage, business, marketing, analysis, success.

Stock Chart Ppt PowerPoint Presentation Information
This is a stock chart ppt powerpoint presentation information. This is a five stage process. The stages in this process are projects, marketing, high, volume, low.
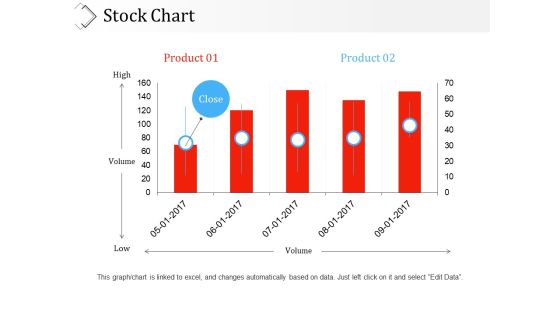
Stock Chart Ppt PowerPoint Presentation Ideas Sample
This is a stock chart ppt powerpoint presentation ideas sample. This is a five stage process. The stages in this process are product, high, low, volume, business.
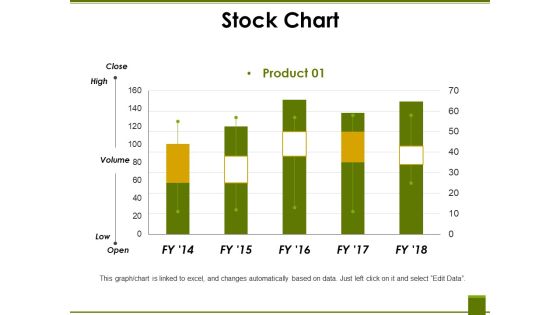
Stock Chart Ppt PowerPoint Presentation Summary Pictures
This is a stock chart ppt powerpoint presentation summary pictures. This is a five stage process. The stages in this process are high, volume, low, product, graph.
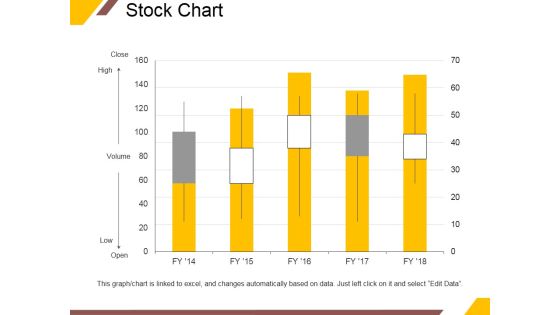
Stock Chart Ppt PowerPoint Presentation Professional Pictures
This is a stock chart ppt powerpoint presentation professional pictures. This is a five stage process. The stages in this process are close, high, volume, low, open.
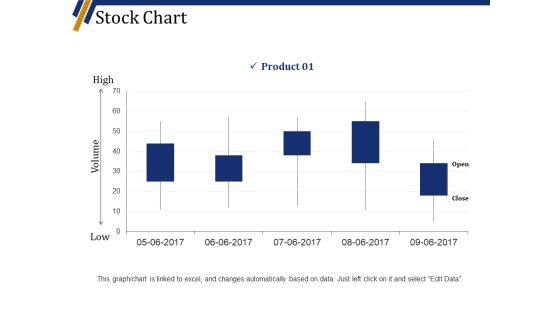
Stock Chart Ppt PowerPoint Presentation Slides Maker
This is a stock chart ppt powerpoint presentation slides maker. This is a five stage process. The stages in this process are high, volume, low, product, business, graph.

Area Chart Ppt PowerPoint Presentation Layouts Styles
This is a area chart ppt powerpoint presentation layouts styles. This is a two stage process. The stages in this process are business, marketing, strategy, planning, growth.
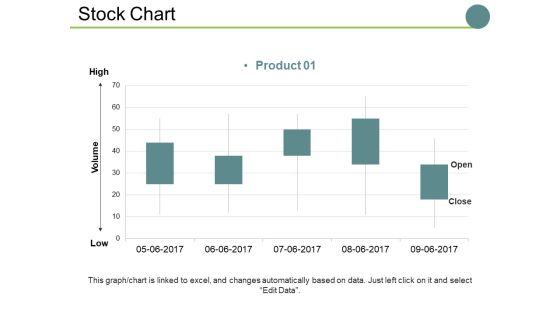
Stock Chart Ppt PowerPoint Presentation Show Sample
This is a stock chart ppt powerpoint presentation show sample. This is a one stage process. The stages in this process are high, volume, low, business, graph, marketing.

Stock Chart Ppt PowerPoint Presentation Styles Deck
This is a stock chart ppt powerpoint presentation styles deck. This is a two stage process. The stages in this process are high, volume, low.
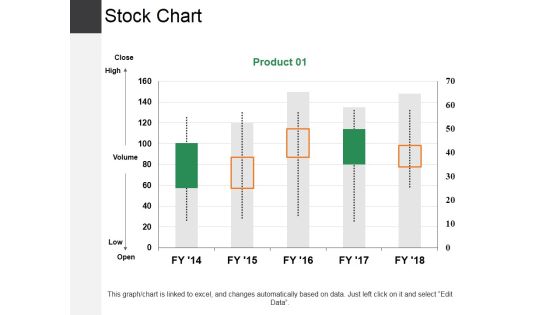
Stock Chart Ppt PowerPoint Presentation Slides Outline
This is a stock chart ppt powerpoint presentation slides outline. This is a one stage process. The stages in this process are high, low, business, marketing, graph.

Stock Chart Ppt PowerPoint Presentation Show Backgrounds
This is a stock chart ppt powerpoint presentation show backgrounds. This is a one stage process. The stages in this process are high, volume, low, business, marketing.

Stock Chart Ppt PowerPoint Presentation Model Grid
This is a stock chart ppt powerpoint presentation model grid. This is a two stage process. The stages in this process are close, high, volume, low, open, product.

Area Chart Ppt PowerPoint Presentation Pictures Example
This is a area chart ppt powerpoint presentation pictures example. This is a two stage process. The stages in this process are business, marketing, graph, success, growth.

Area Chart Ppt PowerPoint Presentation Ideas Tips
This is a area chart ppt powerpoint presentation ideas tips. This is a two stage process. The stages in this process are in percentage, financial, year, business, marketing.
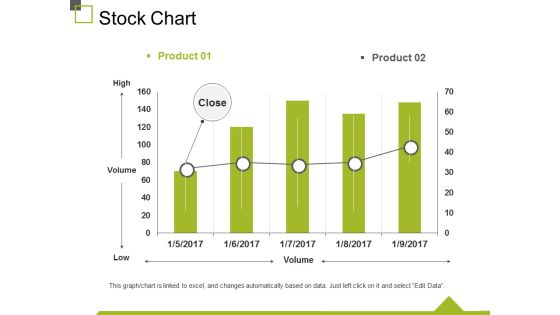
Stock Chart Ppt PowerPoint Presentation Summary Graphics
This is a stock chart ppt powerpoint presentation summary graphics. This is a two stage process. The stages in this process are High, Volume, Low, Business, Marketing.

Column Chart Ppt PowerPoint Presentation Summary Deck
This is a column chart ppt powerpoint presentation summary deck. This is a two stage process. The stages in this process are expenditure in, years, business, marketing, graph.

Column Chart Ppt PowerPoint Presentation File Inspiration
This is a column chart ppt powerpoint presentation file inspiration. This is a two stage process. The stages in this process are business, marketing, years, expenditure in, graph.
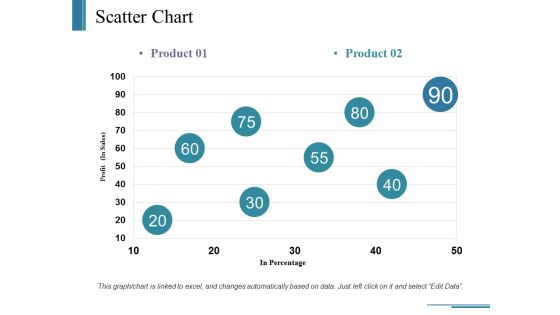
Scatter Chart Ppt PowerPoint Presentation Ideas Example
This is a scatter chart ppt powerpoint presentation ideas example. This is a two stage process. The stages in this process are business, in percentage, profit, marketing, graph.

Column Chart Ppt PowerPoint Presentation Outline Deck
This is a column chart ppt powerpoint presentation outline deck. This is a two stage process. The stages in this process are business, marketing, expenditure in, years, graph.

Column Chart Ppt PowerPoint Presentation Ideas Deck
This is a column chart ppt powerpoint presentation ideas deck. This is a two stage process. The stages in this process are business, marketing, dollars, in years, graph.

Stock Chart Ppt PowerPoint Presentation Show
This is a stock chart ppt powerpoint presentation show. This is a two stage process. The stages in this process are high, volume, low, business, marketing.

Area Chart Ppt PowerPoint Presentation Summary Backgrounds
This is a area chart ppt powerpoint presentation summary backgrounds. This is a two stage process. The stages in this process are percentage, financial, business, management.

Column Chart Ppt PowerPoint Presentation Professional Shapes
This is a column chart ppt powerpoint presentation professional shapes. This is a two stage process. The stages in this process are business, management, marketing.

Area Chart Ppt PowerPoint Presentation Styles Ideas
This is a area chart ppt powerpoint presentation styles ideas. This is a three stage process. The stages in this process are percentage, product, business.

Bubble Chart Ppt PowerPoint Presentation Background Designs
This is a bubble chart ppt powerpoint presentation background designs. This is a two stage process. The stages in this process are product, percentage, marketing, business.

Column Chart Ppt PowerPoint Presentation Pictures Aids
This is a column chart ppt powerpoint presentation pictures aids. This is a two stage process. The stages in this process are Percentage, Product, Marketing, Management.

Bar Chart Ppt PowerPoint Presentation Professional Examples
This is a bar chart ppt powerpoint presentation professional examples. This is a four stage process. The stages in this process are percentage, marketing, management, product.

Bar Chart Ppt PowerPoint Presentation Show Deck
This is a bar chart ppt powerpoint presentation show deck. This is a two stage process. The stages in this process are percentage, product, business, marketing.

Area Chart Ppt PowerPoint Presentation Show Graphics
This is a area chart ppt powerpoint presentation show graphics. This is a three stage process. The stages in this process are percentage, product, marketing, management, business.

Combo Chart Ppt PowerPoint Presentation Slides Slideshow
This is a combo chart ppt powerpoint presentation slides slideshow. This is a three stage process. The stages in this process are percentage, product, marketing, management, business.

Column Chart Ppt PowerPoint Presentation Model Slideshow
This is a column chart ppt powerpoint presentation model slideshow. This is a two stage process. The stages in this process are percentage, product, business, marketing.

Combo Chart Ppt PowerPoint Presentation Styles Topics
This is a combo chart ppt powerpoint presentation styles topics. This is a three stage process. The stages in this process are percentage, product, business, management, marketing.
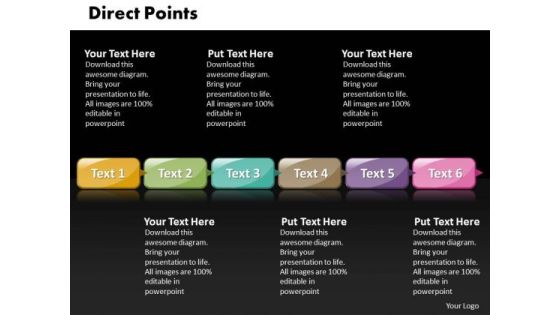
Ppt Direct Points Of Banking Process Using 6 Stages PowerPoint Templates
PPT direct points of banking process using 6 stages PowerPoint Templates-The above template displays a diagram of unified Boxes. This is a type of modeling diagrams used to illustrate the logical path or system. Explain the specific subject matter to inspire your team.-PPT direct points of banking process using 6 stages PowerPoint Templates-Accent, Advertisement, Arrow, Badge, Banner, Blank, Business, Collection, Decoration, Design, Direction, Element, Empty, Financial, Flow, Graph, Horizontal, Instruction, Isolated, Label, Manual, Menu, Message, Placard, Process, Promo, Promotion, Sale, Set, Shape

Crm Dashboard Sales Dashboard Template Ppt PowerPoint Presentation Inspiration
This is a crm dashboard sales dashboard template ppt powerpoint presentation inspiration. This is a five stage process. The stages in this process are sales by product march, lead owner breakdown, total lead ownership, month over month closing trend.

Clustered Bar Ppt PowerPoint Presentation Good
This is a clustered bar ppt powerpoint presentation good. This is a five stage process. The stages in this process are product, circular, business, marketing, bar graph.

Real Estate Demand Ppt PowerPoint Presentation Graphics
This is a real estate demand ppt powerpoint presentation graphics. This is a four stage process. The stages in this process are fundamental factors for expected to drive growth, residential, square feet in millions.

Advertising Spent On Different Mediums Ppt PowerPoint Presentation Background Images
This is a advertising spent on different mediums ppt powerpoint presentation background images. This is a five stage process. The stages in this process are print, radio, tv, internet, media.

Stacked Bar Template 1 Ppt PowerPoint Presentation Infographic Template Format
This is a stacked bar template 1 ppt powerpoint presentation infographic template format. This is a four stage process. The stages in this process are product, stacked bar, business, marketing, bar graph.
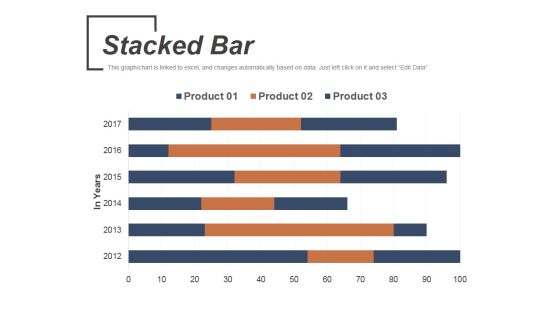
Stacked Bar Template 2 Ppt PowerPoint Presentation Slides Introduction
This is a stacked bar template 2 ppt powerpoint presentation slides introduction. This is a six stage process. The stages in this process are product, stacked bar, business, marketing, in years.

Clustered Column Line Ppt PowerPoint Presentation File Examples
This is a clustered column line ppt powerpoint presentation file examples. This is a three stage process. The stages in this process are sales in percentage, product, business, marketing, success.

Current Staff Profile Years Of Experience Needs Ppt PowerPoint Presentation Model Structure
This is a current staff profile years of experience needs ppt powerpoint presentation model structure. This is a four stage process. The stages in this process are percentage of staff, staff types, least experience, years of experience of hospital.
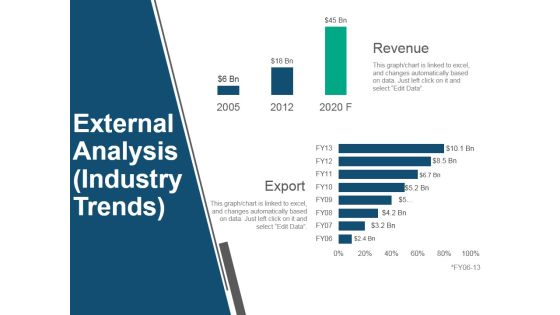
External Analysis Industry Trends Ppt PowerPoint Presentation Inspiration Portfolio
This is a external analysis industry trends ppt powerpoint presentation inspiration portfolio. This is a two stage process. The stages in this process are revenue, export, business, marketing, presentation.

External Analysis Ppt PowerPoint Presentation Portfolio Background Designs
This is a external analysis ppt powerpoint presentation portfolio background designs. This is a seven stage process. The stages in this process are education, police, hm forces, local government, local other health and social work.

Gap Between Current And Required Staff Ppt PowerPoint Presentation File Tips
This is a gap between current and required staff ppt powerpoint presentation file tips. This is a five stage process. The stages in this process are number of staff, bar graph, business, marketing, success.
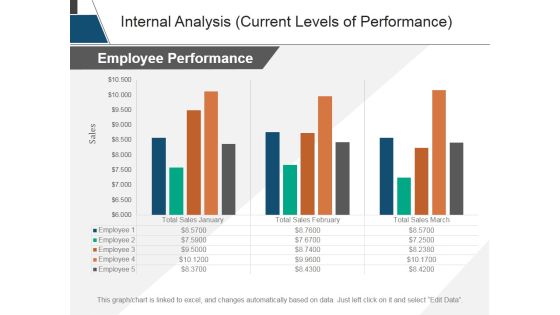
Internal Analysis Current Levels Of Performance Ppt PowerPoint Presentation Tips
This is a internal analysis current levels of performance ppt powerpoint presentation tips. This is a three stage process. The stages in this process are sales, employee performance, years, business, marketing.

Internal Analysis Workforce Trends Ppt PowerPoint Presentation Summary Example Topics
This is a internal analysis workforce trends ppt powerpoint presentation summary example topics. This is a four stage process. The stages in this process are workforce trends, percentage, business, marketing, management.

Clustered Column Line Ppt PowerPoint Presentation Model Images
This is a clustered column line ppt powerpoint presentation model images. This is a four stage process. The stages in this process are sales in percentage, product, business, marketing, bar graph.

Bar Graph Ppt PowerPoint Presentation Model Clipart
This is a bar graph ppt powerpoint presentation model clipart. This is a six stage process. The stages in this process are sales in percentage, product, bar graph, business, marketing.

Current Staff Profile Years Of Experience Needs Ppt PowerPoint Presentation Layouts Influencers
This is a current staff profile years of experience needs ppt powerpoint presentation layouts influencers. This is a four stage process. The stages in this process are years of experience of hospital staff, percentage of staff, staff types, least experience.
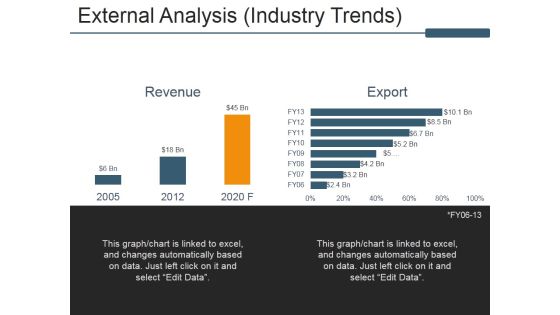
External Analysis Industry Trends Ppt PowerPoint Presentation Infographic Template Summary
This is a external analysis industry trends ppt powerpoint presentation infographic template summary. This is a two stage process. The stages in this process are revenue, export, external analysis, business, marketing.
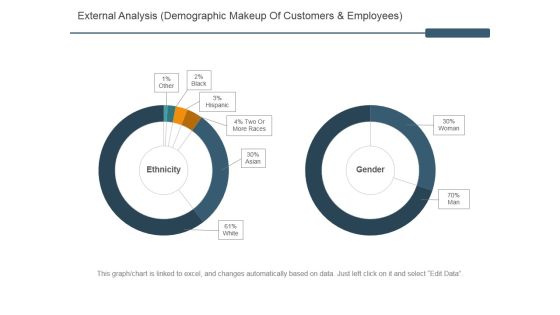
External Analysis Ppt PowerPoint Presentation Infographics Information
This is a external analysis ppt powerpoint presentation infographics information. This is a seven stage process. The stages in this process are education, police, hm forces, local government, civil service.
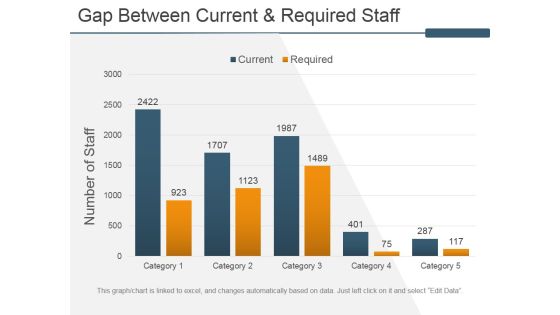
Gap Between Current And Required Staff Ppt PowerPoint Presentation Inspiration Slides
This is a gap between current and required staff ppt powerpoint presentation inspiration slides. This is a five stage process. The stages in this process are number of staff, bar graph, business, marketing, success.

Internal Analysis Workforce Trends Ppt PowerPoint Presentation Model Infographics
This is a internal analysis workforce trends ppt powerpoint presentation model infographics. This is a four stage process. The stages in this process are workforce trends, internal analysis, business, marketing, success.
