Cost Dashboard
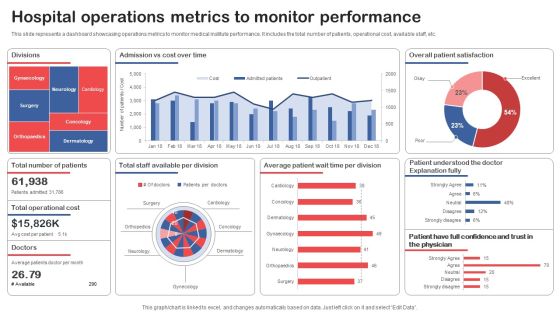
Hospital Operations Metrics To Monitor Performance Structure PDF
This slide represents a dashboard showcasing operations metrics to monitor medical institute performance. It includes the total number of patients, operational cost, available staff, etc. Showcasing this set of slides titled Hospital Operations Metrics To Monitor Performance Structure PDF. The topics addressed in these templates are Divisions, Overall Patient Satisfaction, Total Operational Cost. All the content presented in this PPT design is completely editable. Download it and make adjustments in color, background, font etc. as per your unique business setting.

Data Lake Architecture Overview Of Cloud Based Data Lake Formats PDF
This slide describes the cloud-based data lake, how these data lakes can eliminate on-premise data lake challenges and are scalable and cost-effective. This is a Data Lake Architecture Overview Of Cloud Based Data Lake Formats PDF template with various stages. Focus and dispense information on three stages using this creative set, that comes with editable features. It contains large content boxes to add your information on topics like Data Lake Challenges, Cost Effective, Cloud Enables Consumers, Cost Savings. You can also showcase facts, figures, and other relevant content using this PPT layout. Grab it now.

Information Technology Facilities Governance Measuring IT Staff Performance Ppt Infographic Template Graphics Download PDF
This slide helps in analyzing the performance of different IT executives representatives. It will help in tracking metrics such as cost per contact, percentage of tickets opened, etc. The staff performance will be assessed on various parameters such as cost, quality, productivity and service level. Deliver and pitch your topic in the best possible manner with this information technology facilities governance measuring IT staff performance ppt infographic template graphics download pdf. Use them to share invaluable insights on cost per contact, productivity, service level, technician, parameters and impress your audience. This template can be altered and modified as per your expectations. So, grab it now.
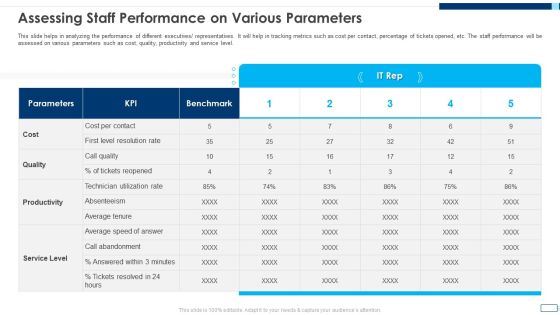
Evolving BI Infrastructure Assessing Staff Performance On Various Parameters Infographics PDF
This slide helps in analyzing the performance of different executives or representatives. It will help in tracking metrics such as cost per contact, percentage of tickets opened, etc. The staff performance will be assessed on various parameters such as cost, quality, productivity and service level. Deliver an awe inspiring pitch with this creative evolving bi infrastructure assessing staff performance on various parameters infographics pdf bundle. Topics like cost, quality, productivity, service level, parameters can be discussed with this completely editable template. It is available for immediate download depending on the needs and requirements of the user.

KPI Framework For Fast Moving Consumer Goods Ppt PowerPoint Presentation File Show PDF
The below mentioned slide highlights key performance indicator framework for measuring fast moving consumer goods. This includes indicators like out of stock, supply chain cost, carrying cost of inventory and average time taken to sell the goods to the ultimate consumers. Pitch your topic with ease and precision using this kpi framework for fast moving consumer goods ppt powerpoint presentation file show pdf This layout presents information on average, stock rate, cost It is also available for immediate download and adjustment. So, changes can be made in the color, design, graphics or any other component to create a unique layout.

Transforming Sustainability Into Competitive Major Types Of Sustainable Competitive Sample PDF
This slide shows comparative assessment of sustainable competitive advantage types. It provides details about cost leadership, differentiation, focus, low cost strategy, best value strategy, small market, marketing costs, rivals, etc. The Transforming Sustainability Into Competitive Major Types Of Sustainable Competitive Sample PDF is a compilation of the most recent design trends as a series of slides. It is suitable for any subject or industry presentation, containing attractive visuals and photo spots for businesses to clearly express their messages. This template contains a variety of slides for the user to input data, such as structures to contrast two elements, bullet points, and slides for written information. Slidegeeks is prepared to create an impression.
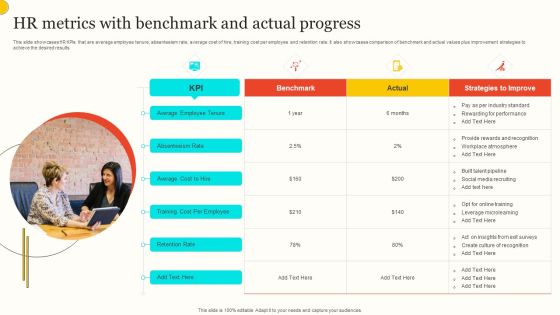
HR Metrics With Benchmark And Actual Progress Background PDF
This slide showcases HR KPIs that are average employee tenure, absenteeism rate, average cost of hire, training cost per employee and retention rate. It also showcases comparison of benchmark and actual values plus improvement strategies to achieve the desired results. Presenting HR Metrics With Benchmark And Actual Progress Background PDF to dispense important information. This template comprises one stages. It also presents valuable insights into the topics including Average Employee Tenure, Absenteeism Rate, Average Cost Hire. This is a completely customizable PowerPoint theme that can be put to use immediately. So, download it and address the topic impactfully.

Adopting Multiple Tactics To Improve Inventory Optimization Tables Of Content Portrait PDF
This slide showcases KPIs that can help organization to track the warehouse performance and reduce costs. It includes inventory accuracy, carrying cost of inventory, inventory shrinkage, picking accuracy and cost per order. From laying roadmaps to briefing everything in detail, our templates are perfect for you. You can set the stage with your presentation slides. All you have to do is download these easy to edit and customizable templates. Adopting Multiple Tactics To Improve Inventory Optimization Tables Of Content Portrait PDF will help you deliver an outstanding performance that everyone would remember and praise you for. Do download this presentation today.
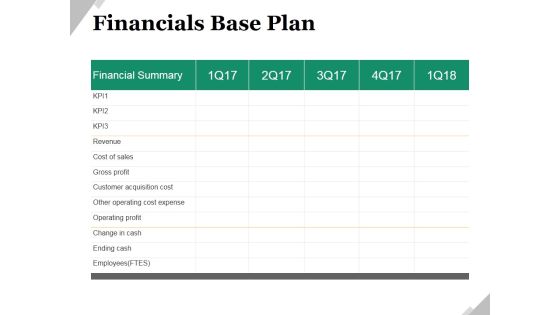
Financials Base Plan Ppt PowerPoint Presentation Model Shapes
This is a financials base plan ppt powerpoint presentation model shapes. This is a five stage process. The stages in this process are financial summary, business, marketing, revenue, cost of sales, gross profit.

Accounting Key Performance Indicators Ppt Powerpoint
This is a accounting key performance indicators ppt powerpoint. This is a four stage process. The stages in this process are cost per invoice, invoice processing speed, productivity per team member, variance analysis.

Quantitative Risk Analysis Ppt PowerPoint Presentation Model Influencers
This is a quantitative risk analysis ppt powerpoint presentation model influencers. This is a ten stage process. The stages in this process are cost risk, insufficient funds to support the bid, schedule risk, insufficient resources to complete work on time.

Comparison Between White Black And Grey Hat SEO Training Ppt
The following slide depicts the comparison of white, black, and grey hat SEO. The multiple parameters used for comparison are search engine guidelines, ideal for long term, time taken to deliver results, cost involved long term, and risk involved.

Key Performance Indicators Template 2 Ppt Powerpoint Presentation Model Background
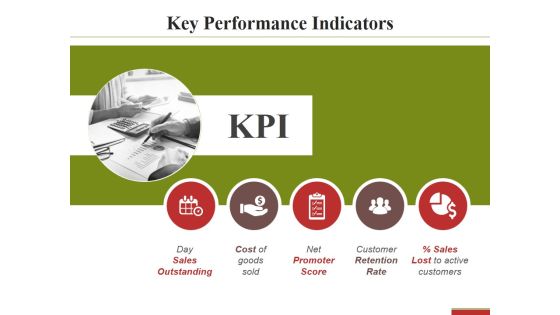
This is a key performance indicators template 2 ppt powerpoint presentation model background. This is a five stage process. The stages in this process are day sales outstanding, cost of goods sold, net promoter score.
Key Performance Indicators Template 2 Ppt PowerPoint Presentation Pictures Slide
This is a key performance indicators template 2 ppt powerpoint presentation pictures slide. This is a five stage process. The stages in this process are day sales outstanding, cost of goods sold, net promoter score.

Key Performance Indicators Ppt PowerPoint Presentation Pictures Design Templates
This is a key performance indicators ppt powerpoint presentation pictures design templates. This is a five stage process. The stages in this process are day sales outstanding, cost of goods sold, customer retention rate.
Importance Of Big Data Analytics Sample Diagram Ppt Slides
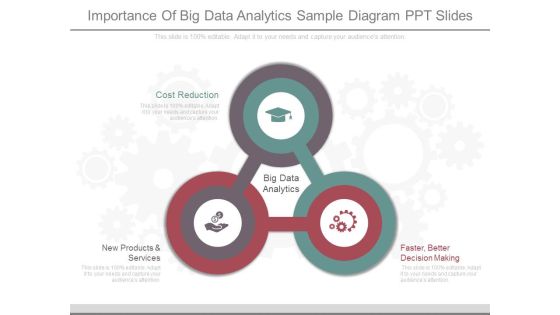
This is a importance of big data analytics sample diagram ppt slides. This is a three stage process. The stages in this process are cost reduction, big data analytics, new products and services, faster, better decision making.
Financial Projections Pandl Ppt PowerPoint Presentation Slides Show
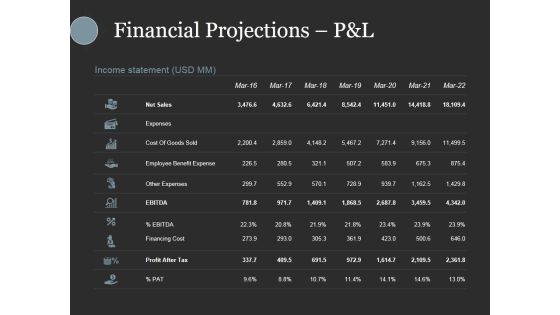
This is a financial projections pandl ppt powerpoint presentation slides show. This is a seven stage process. The stages in this process are net sales, expenses, cost of goods sold, employee benefit expense, other expenses.
Financial Projections Pandl Ppt PowerPoint Presentation Styles Gallery
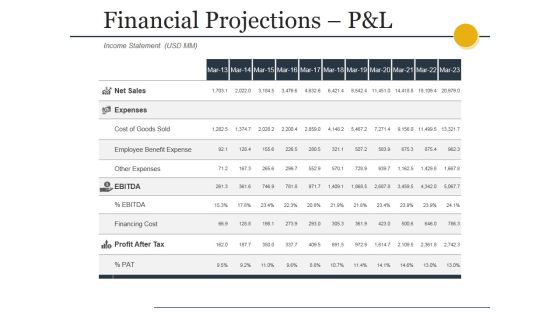
This is a financial projections pandl ppt powerpoint presentation styles gallery. This is a eleven stage process. The stages in this process are net sales, expenses, cost of goods sold, employee benefit expense, other expenses.
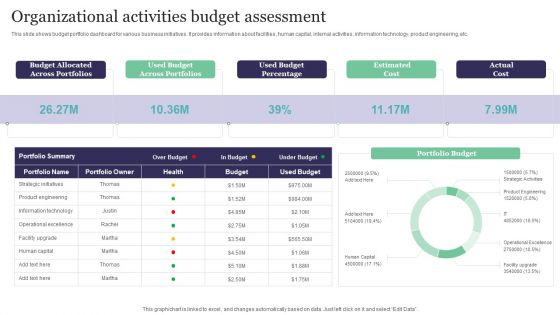
Organizational Activities Budget Assessment Summary PDF
This slide shows budget portfolio dashboard for various business initiatives. It provides information about facilities, human capital, internal activities, information technology, product engineering, etc. Showcasing this set of slides titled Organizational Activities Budget Assessment Summary PDF. The topics addressed in these templates are Budget Allocated, Across Portfolios, Used Budget, Percentage, Actual Cost. All the content presented in this PPT design is completely editable. Download it and make adjustments in color, background, font etc. as per your unique business setting.

Cios Methodologies To Improve IT Spending Determine It Project Portfolio Management Microsoft PDF
This slide provides information regarding IT project portfolio management tracking dashboard including details about allocated budget across portfolios, used budget percentage, estimated vs. actual cost, etc. Deliver an awe inspiring pitch with this creative Cios Methodologies To Improve IT Spending Determine It Project Portfolio Management Microsoft PDF bundle. Topics like Return On Investment, Revenue, Break Down can be discussed with this completely editable template. It is available for immediate download depending on the needs and requirements of the user.
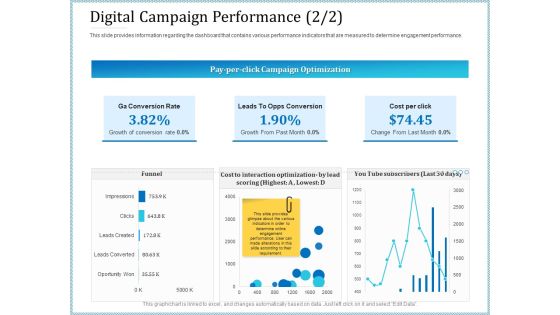
Leveraged Client Engagement Digital Campaign Performance Trend Formats PDF
This slide provides information regarding the dashboard that contains various performance indicators that are measured to determine engagement performance. Deliver an awe inspiring pitch with this creative leveraged client engagement digital campaign performance trend formats pdf bundle. Topics like growth, cost, funnel, optimization can be discussed with this completely editable template. It is available for immediate download depending on the needs and requirements of the user.

Warehouse Management System Functions Structure PDF
The purpose of this slide is to provide a glimpse of the problems faced by our logistic company at present such as fuel costs, lack of technology, government regulations, inventory management etc. Deliver an awe inspiring pitch with this creative warehouse management system functions structure pdf bundle. Topics like warehouse management system wms dashboard can be discussed with this completely editable template. It is available for immediate download depending on the needs and requirements of the user.
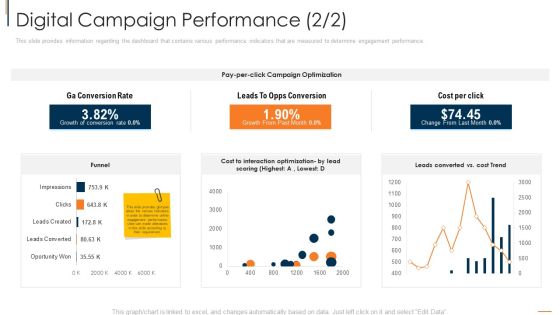
Online Consumer Engagement Digital Campaign Performance Rate Guidelines PDF
This slide provides information regarding the dashboard that contains various performance indicators that are measured to determine engagement performance. Deliver and pitch your topic in the best possible manner with this online consumer engagement digital campaign performance rate guidelines pdf. Use them to share invaluable insights on optimization, cost, rate and impress your audience. This template can be altered and modified as per your expectations. So, grab it now.

Big Data Challenges And Solutions Ppt PowerPoint Presentation Background Images
This is a big data challenges and solutions ppt powerpoint presentation background images. This is a one stage process. The stages in this process are lack of sufficiently skilled it staff and cost of technology, managing data quality, data integration.
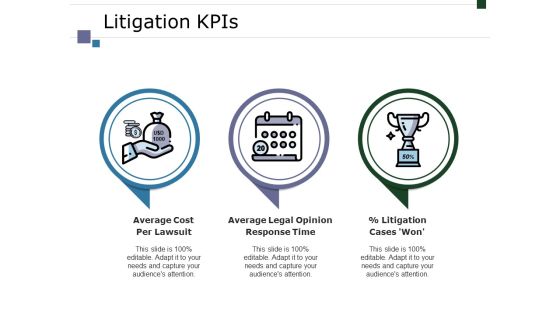
Litigation Kpis Ppt PowerPoint Presentation Slides Inspiration
This is a litigation kpis ppt powerpoint presentation slides inspiration. This is a three stage process. The stages in this process are average cost per lawsuit, average legal opinion response time, litigation cases won, business, marketing.

Litigation Kpis Ppt PowerPoint Presentation Styles Aids
This is a litigation kpis ppt powerpoint presentation styles aids. This is a three stage process. The stages in this process are average cost per lawsuit, average legal opinion response time.

Litigation Kpis Ppt PowerPoint Presentation Model Aids
This is a litigation kpis ppt powerpoint presentation model aids. This is a three stage process. The stages in this process are average cost per lawsuit, average legal opinion response time, litigation cases won, business, marketing.
Litigation Kpis Ppt PowerPoint Presentation Model Portrait
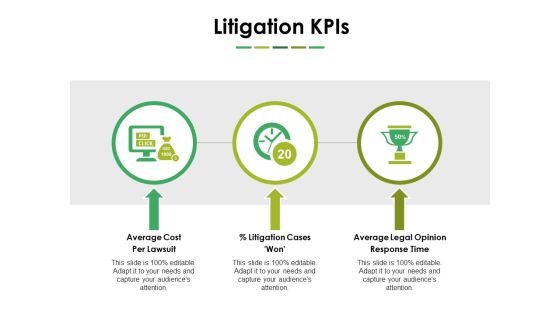
This is a litigation kpis ppt powerpoint presentation model portrait. This is a three stage process. The stages in this process are average cost per lawsuit, litigation cases won, average legal opinion response time, business, marketing.

Litigation Kpis Ppt PowerPoint Presentation Layouts Clipart Images
This is a litigation kpis ppt powerpoint presentation layouts clipart images. This is a three stage process. The stages in this process are average cost per lawsuit, litigation cases won, average legal opinion response time.
Litigation Kpis Ppt PowerPoint Presentation Layouts Graphics Template
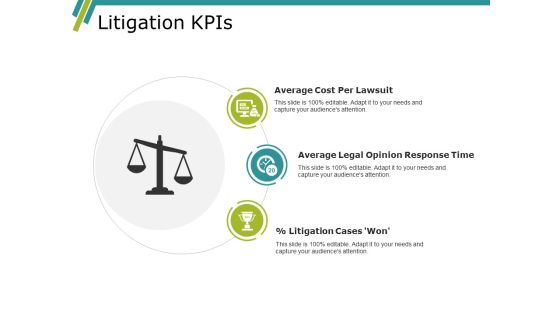
This is a litigation kpis ppt powerpoint presentation layouts graphics template. This is a three stage process. The stages in this process are average cost per lawsuit, average legal opinion response time, litigation cases.

Continual Improvement Procedure In Supply Chain Kpis To Track Transportation Management Infographics PDF
This slide focuses on key performance indicators to track transportation management system performance which includes freight cost for each unit shipped, outbound and inbound freight costs, etc.Deliver and pitch your topic in the best possible manner with this Continual Improvement Procedure In Supply Chain Kpis To Track Transportation Management Infographics PDF. Use them to share invaluable insights on Outbound Freight, Transportation Time, Billing Accuracy and impress your audience. This template can be altered and modified as per your expectations. So, grab it now.
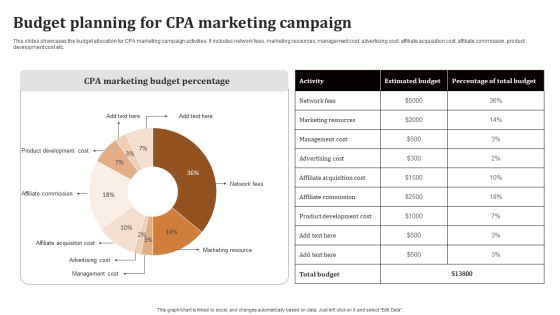
Significance Of CPA To Maximize Digital Marketing ROI Budget Planning For CPA Marketing Campaign Pictures PDF
This slides showcases the budget allocation for CPA marketing campaign activities. It includes network fees, marketing resources, management cost, advertising cost, affiliate acquisition cost, affiliate commission, product development cost etc. The Significance Of CPA To Maximize Digital Marketing ROI Budget Planning For CPA Marketing Campaign Pictures PDF is a compilation of the most recent design trends as a series of slides. It is suitable for any subject or industry presentation, containing attractive visuals and photo spots for businesses to clearly express their messages. This template contains a variety of slides for the user to input data, such as structures to contrast two elements, bullet points, and slides for written information. Slidegeeks is prepared to create an impression.

Content Ppt PowerPoint Presentation File Display
This is a content ppt powerpoint presentation file display. This is a six stage process. The stages in this process are introduction, data analysis, cost of quality, quality control.

Content Ppt PowerPoint Presentation Inspiration Microsoft
This is a Content Ppt PowerPoint Presentation Inspiration Microsoft. This is a six stage process. The stages in this process are introduction, principles and certification, tools of quality management, data analysis, cost of quality, quality control.

Comparative Analysis In Digital Transformation Statistics Graphics PDF
This slide signifies the comparative assessment of digital transformation trends. It includes bar graph with governance and compliance, IT security, automation, cost saving and data analytics. Showcasing this set of slides titled comparative analysis in digital transformation statistics graphics pdf. The topics addressed in these templates are data analytics, cost saving, improve customer experience. All the content presented in this PPT design is completely editable. Download it and make adjustments in color, background, font etc. as per your unique business setting.

Administering Logistics Activities In SCM Kpis To Track Transportation Management System Performance Icons PDF
This slide focuses on key performance indicators to track transportation management system performance which includes freight cost for each unit shipped, outbound and inbound freight costs, etc. Deliver and pitch your topic in the best possible manner with this Administering Logistics Activities In SCM Kpis To Track Transportation Management System Performance Icons PDF. Use them to share invaluable insights on Transportation, Management, System Performance and impress your audience. This template can be altered and modified as per your expectations. So, grab it now.

Information Technology For Crm Ppt Ideas
This is a information technology for crm ppt ideas. This is a seven stage process. The stages in this process are cost reduction, strict confidentiality, environment friendly, instant data capture, instant data analysis, reduce input error, increase satisfaction, information technology.

Metrics To Measure Results Of Performance Marketing Campaign Ppt PowerPoint Presentation File Portfolio PDF
This slide showcases metrics that can help organization to track the effectiveness of performance advertisement campaign. Its key components are cost per click, cost per sales, cost per impression and cost per lead Create an editable Metrics To Measure Results Of Performance Marketing Campaign Ppt PowerPoint Presentation File Portfolio PDF that communicates your idea and engages your audience. Whether youre presenting a business or an educational presentation, pre designed presentation templates help save time. Metrics To Measure Results Of Performance Marketing Campaign Ppt PowerPoint Presentation File Portfolio PDF is highly customizable and very easy to edit, covering many different styles from creative to business presentations. Slidegeeks has creative team members who have crafted amazing templates. So, go and get them without any delay.
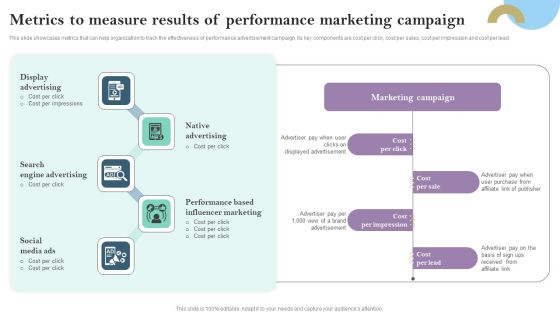
Metrics To Measure Results Of Performance Marketing Campaign Ppt PowerPoint Presentation Diagram Graph Charts PDF
This slide showcases metrics that can help organization to track the effectiveness of performance advertisement campaign. Its key components are cost per click, cost per sales, cost per impression and cost per lead Presenting this PowerPoint presentation, titled Metrics To Measure Results Of Performance Marketing Campaign Ppt PowerPoint Presentation Diagram Graph Charts PDF, with topics curated by our researchers after extensive research. This editable presentation is available for immediate download and provides attractive features when used. Download now and captivate your audience. Presenting this Metrics To Measure Results Of Performance Marketing Campaign Ppt PowerPoint Presentation Diagram Graph Charts PDF. Our researchers have carefully researched and created these slides with all aspects taken into consideration. This is a completely customizable Metrics To Measure Results Of Performance Marketing Campaign Ppt PowerPoint Presentation Diagram Graph Charts PDF that is available for immediate downloading. Download now and make an impact on your audience. Highlight the attractive features available with our PPTs.

Performance Based Marketing Metrics To Measure Results Of Performance Marketing Demonstration PDF
This slide showcases metrics that can help organization to track the effectiveness of performance advertisement campaign. Its key components are cost per click, cost per sales, cost per impression and cost per lead. This Performance Based Marketing Metrics To Measure Results Of Performance Marketing Demonstration PDF is perfect for any presentation, be it in front of clients or colleagues. It is a versatile and stylish solution for organizing your meetings. The Performance Based Marketing Metrics To Measure Results Of Performance Marketing Demonstration PDF features a modern design for your presentation meetings. The adjustable and customizable slides provide unlimited possibilities for acing up your presentation. Slidegeeks has done all the homework before launching the product for you. So, dont wait, grab the presentation templates today.

Online Marketing Strategy For Lead Generation Metrics To Measure Results Of Performance Marketing Campaign Elements PDF
This slide showcases metrics that can help organization to track the effectiveness of performance advertisement campaign. Its key components are cost per click, cost per sales, cost per impression and cost per lead. This Online Marketing Strategy For Lead Generation Metrics To Measure Results Of Performance Marketing Campaign Elements PDF is perfect for any presentation, be it in front of clients or colleagues. It is a versatile and stylish solution for organizing your meetings. The Online Marketing Strategy For Lead Generation Metrics To Measure Results Of Performance Marketing Campaign Elements PDF features a modern design for your presentation meetings. The adjustable and customizable slides provide unlimited possibilities for acing up your presentation. Slidegeeks has done all the homework before launching the product for you. So, do not wait, grab the presentation templates today

Acquiring Clients Through Search Engine And Native Ads Metrics To Measure Results Of Performance Marketing Structure PDF
This slide showcases metrics that can help organization to track the effectiveness of performance advertisement campaign. Its key components are cost per click, cost per sales, cost per impression and cost per lead. Formulating a presentation can take up a lot of effort and time, so the content and message should always be the primary focus. The visuals of the PowerPoint can enhance the presenters message, so our Acquiring Clients Through Search Engine And Native Ads Metrics To Measure Results Of Performance Marketing Structure PDF was created to help save time. Instead of worrying about the design, the presenter can concentrate on the message while our designers work on creating the ideal templates for whatever situation is needed. Slidegeeks has experts for everything from amazing designs to valuable content, we have put everything into Acquiring Clients Through Search Engine And Native Ads Metrics To Measure Results Of Performance Marketing Structure PDF

Content Ppt PowerPoint Presentation Show Slides
This is a content ppt powerpoint presentation show slides. This is a six stage process. The stages in this process are introduction, tools of quality management, data analysis, cost of quality, quality control.

Content Ppt PowerPoint Presentation Layouts Elements
This is a content ppt powerpoint presentation layouts elements. This is a six stage process. The stages in this process are introduction, data analysis, cost of quality, quality control, tools of quality management.

Content Ppt PowerPoint Presentation Pictures Background
This is a content ppt powerpoint presentation pictures background. This is a six stage process. The stages in this process are introduction, principles and certification, tools of quality management, data analysis, cost of quality, quality control.

Competitive Advantage Of Big Data Sample Ppt Slides
This is a competitive advantage of big data sample ppt slides. This is a five stage process. The stages in this process are possible cost savings, continual innovation, visibility into causal relationship, potential revenue, more informed decision making, competitive advantage.

Master Data Management Opportunities Ppt PowerPoint Presentation Model
This is a master data management opportunities ppt powerpoint presentation model. This is a one stage process. The stages in this process are lack of sufficiently skilled it staff and cost of technology, managing data quality, data integration.
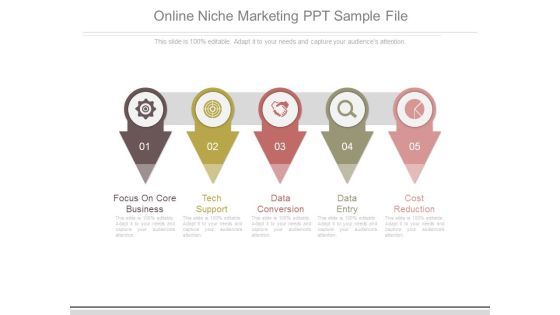
Online Niche Marketing Ppt Sample File
This is a online niche marketing ppt sample file. This is a five stage process. The stages in this process are focus on core business, tech support, data conversion, data entry, cost reduction.
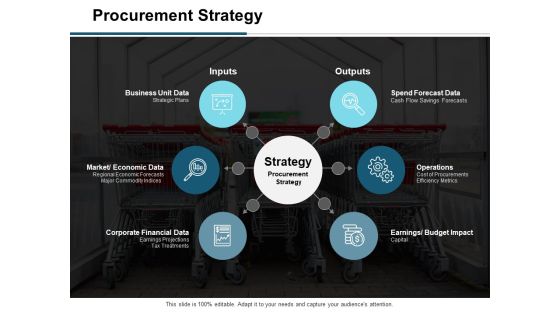
Procurement Strategy Ppt PowerPoint Presentation Model Slide Portrait
This is a procurement strategy ppt powerpoint presentation model slide portrait. This is a six stage process. The stages in this process are strategic plans, earnings budget impact, cost procurements efficiency, business unit data, market economic data.

Acquisition Channels Tools Ppt PowerPoint Presentation Information
This is a acquisition channels tools ppt powerpoint presentation information. This is a four stage process. The stages in this process are social media marketing, client referral report, customer acquisition cost by channel, customer acquisition tools, business.
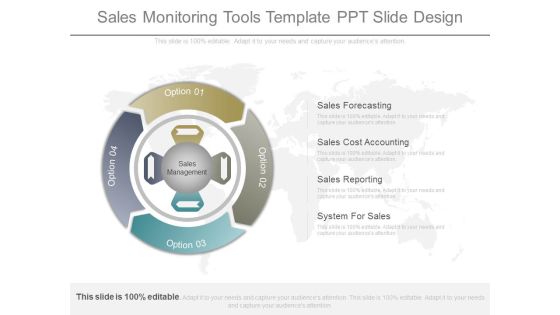
Sales Monitoring Tools Template Ppt Slide Design
This is a sales monitoring tools template ppt slide design. This is a four stage process. The stages in this process are sales forecasting, sales cost accounting, sales reporting, system for sales.
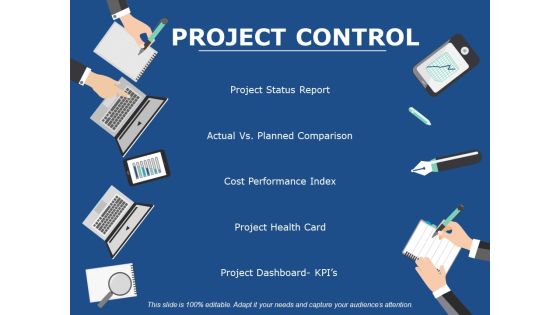
Project Control Ppt PowerPoint Presentation Inspiration Slideshow
This is a project control ppt powerpoint presentation inspiration slideshow. This is a five stage process. The stages in this process are project health card, cost performance index, project status report, planning, strategy.

acquisition channels tools ppt powerpoint presentation portfolio diagrams
This is a acquisition channels tools ppt powerpoint presentation portfolio diagrams. This is a four stage process. The stages in this process are social media marketing, client referral report, customer acquisition cost by channel, customer acquisition tools, business, icons.
Relevant Content Powerpoint Slides
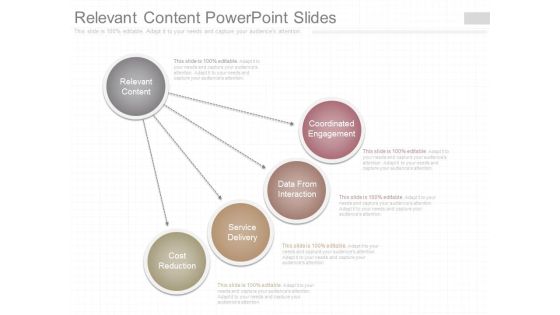
This is a relevant content powerpoint slides. This is a four stage process. The stages in this process are relevant content, coordinated engagement, data from interaction, service delivery, cost reduction.
Executing Advance Data Analytics At Workspace Addressing Business Intelligence Formats PDF
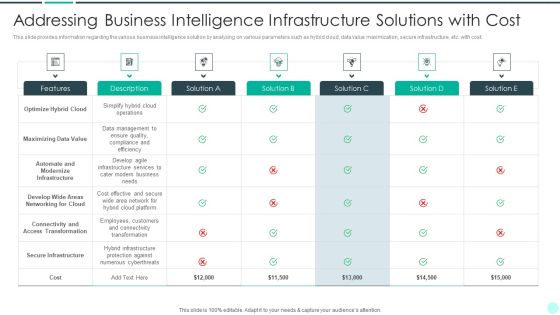
This slide provides information regarding the various business intelligence solution by analyzing on various parameters such as hybrid cloud, data value maximization, secure infrastructure, etc. with cost. Deliver and pitch your topic in the best possible manner with this executing advance data analytics at workspace addressing business intelligence formats pdf. Use them to share invaluable insights on addressing business intelligence infrastructure solutions with cost and impress your audience. This template can be altered and modified as per your expectations. So, grab it now.
Executing Advance Data Analytics At Workspace Addressing Different Network Clipart PDF
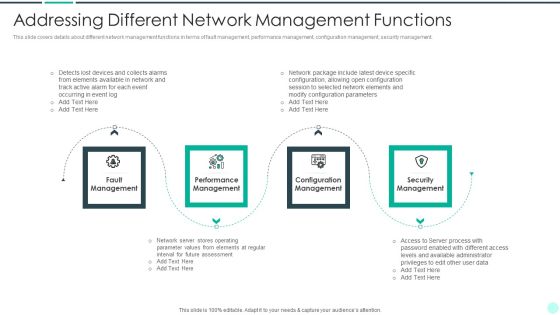
This slide provides information regarding the various business intelligence solution by analyzing on various parameters such as hybrid cloud, data value maximization, secure infrastructure, etc. with cost. Deliver and pitch your topic in the best possible manner with this executing advance data analytics at workspace addressing different network clipart pdf. Use them to share invaluable insights on addressing business intelligence infrastructure solutions with cost and impress your audience. This template can be altered and modified as per your expectations. So, grab it now.

Higher Proposal Win Rate Presentation Background Images
This is a higher proposal win rate presentation background images. This is a four stage process. The stages in this process are higher proposal win rate, faster follow up, sales feels supported, cost per lead data.

New Product Introduction In Market Determine Suitable Product Download PDF
This slide provides information regarding selection of suitable product management solution by analyzing on various parameters such as user tracking or analysis, data management or sharing, API integration along with cost. Deliver an awe inspiring pitch with this creative new product introduction in market determine suitable product download pdf bundle. Topics like task management, analysis, road mapping, cost can be discussed with this completely editable template. It is available for immediate download depending on the needs and requirements of the user.

Earned Value Management Analysis Performance Measurement Ppt Infographics Portrait PDF
This slide represents earned value management analysis performance measurement illustrating performance measure such as schedule variance and cost variance. Presenting Earned Value Management Analysis Performance Measurement Ppt Infographics Portrait PDF to dispense important information. This template comprises two stages. It also presents valuable insights into the topics including Performance Measure, Schedule Variance, Cost Variance. This is a completely customizable PowerPoint theme that can be put to use immediately. So, download it and address the topic impactfully.

Optimizing E Business Promotion Plan Performance Metrics Of Online Advertising Infographics PDF
This slide shows the performance metrics of online advertising that includes clicks, impressions, click through rate, cost per click, cost per thousand impressions and return on investment. Deliver an awe inspiring pitch with this creative Optimizing E Business Promotion Plan Performance Metrics Of Online Advertising Infographics PDF bundle. Topics like Thousand Impressions, Return Investment, Impressions can be discussed with this completely editable template. It is available for immediate download depending on the needs and requirements of the user.
 Home
Home