Cost Dashboard
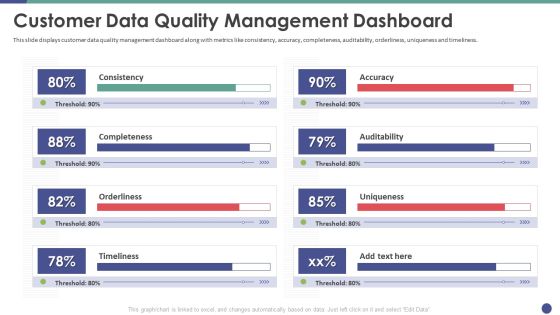
QC Engineering Customer Data Quality Management Dashboard Ppt Infographic Template Guide PDF
This slide displays customer data quality management dashboard along with metrics like consistency, accuracy, completeness, auditability, orderliness, uniqueness and timeliness. Deliver an awe inspiring pitch with this creative qc engineering customer data quality management dashboard ppt infographic template guide pdf bundle. Topics like auditability, timeliness, orderliness, completeness, consistency can be discussed with this completely editable template. It is available for immediate download depending on the needs and requirements of the user.

Cognitive Computing Action Plan Tracking Customer Data Insights Dashboard Ppt Infographics Graphic Tips PDF
This slide provides information regarding customer data insights dashboard in terms of average churn risk, segments, high earner, highly engaged customers, etc. Deliver and pitch your topic in the best possible manner with this cognitive computing action plan tracking customer data insights dashboard ppt infographics graphic tips pdf. Use them to share invaluable insights on median lifetime spend, average churm risk, brand affinities and impress your audience. This template can be altered and modified as per your expectations. So, grab it now.
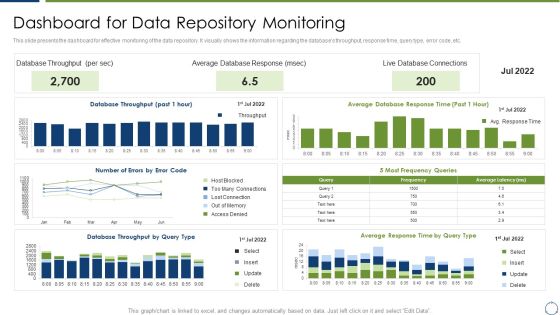
Horizontal Scaling Technique For Information Dashboard For Data Repository Monitoring Designs PDF
This slide presents the dashboard for effective monitoring of the data repository. It visually shows the information regarding the databases throughput, response time, query type, error code, etc.Deliver an awe inspiring pitch with this creative Horizontal Scaling Technique For Information Dashboard For Data Repository Monitoring Designs PDF bundle. Topics like Database Throughput, Average Database Response, Database Connections can be discussed with this completely editable template. It is available for immediate download depending on the needs and requirements of the user.
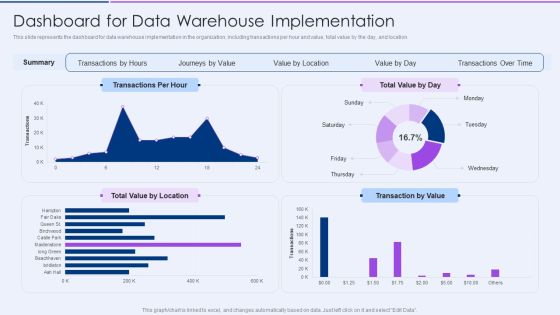
Executive Information Database System Dashboard For Data Warehouse Implementation Ideas PDF
This slide represents the dashboard for data warehouse implementation in the organization, including transactions per hour and value, total value by the day, and location.Deliver and pitch your topic in the best possible manner with this Executive Information Database System Dashboard For Data Warehouse Implementation Ideas PDF. Use them to share invaluable insights on Transactions Time, Value Location, Journeys Value and impress your audience. This template can be altered and modified as per your expectations. So, grab it now.

Cognitive Visualizations Computing Strategy Tracking Customer Data Insights Dashboard Brochure PDF
This slide provides information regarding customer data insights dashboard in terms of average churn risk, segments, high earner, highly engaged customers, etc. Deliver an awe inspiring pitch with this creative Cognitive Visualizations Computing Strategy Tracking Customer Data Insights Dashboard Brochure PDF bundle. Topics like Median Lifetime, Engaged Customers, Return Customers can be discussed with this completely editable template. It is available for immediate download depending on the needs and requirements of the user.

Identifying And Increasing Brand Awareness Dashboard Depicting Website Data Insights Rules PDF
This slide shows the dashboard that depicts website data insights which covers channels such as display, social and email with total sessions, pages, average session duration, bounce rate, goal completion. There are so many reasons you need a Identifying And Increasing Brand Awareness Dashboard Depicting Website Data Insights Rules PDF. The first reason is you can not spend time making everything from scratch, Thus, Slidegeeks has made presentation templates for you too. You can easily download these templates from our website easily.
Web App Firewall Services IT Kpis Dashboard For Threat Tracking In WAF Guidelines PDF
This slide depicts how threat risk will be monitored and threat detection will be done in the organization through web application firewall implementation. Deliver and pitch your topic in the best possible manner with this web app firewall services it kpis dashboard for threat tracking in waf guidelines pdf. Use them to share invaluable insights on kpis or dashboard for threat tracking in waf and impress your audience. This template can be altered and modified as per your expectations. So, grab it now.
HR Recruitment Dashboard Kpis With Active Pipeline Ppt Icon Slide Portrait PDF
This slide showcases the recruitment dashboard metrics to know monthly hiring rate. It include KPIs like sources, decline reasons, active pipeline, recruitment funnel. Showcasing this set of slides titled HR Recruitment Dashboard Kpis With Active Pipeline Ppt Icon Slide Portrait PDF. The topics addressed in these templates are Recruitment Funnel, Monthly Metrics, Application Sources. All the content presented in this PPT design is completely editable. Download it and make adjustments in color, background, font etc. as per your unique business setting.
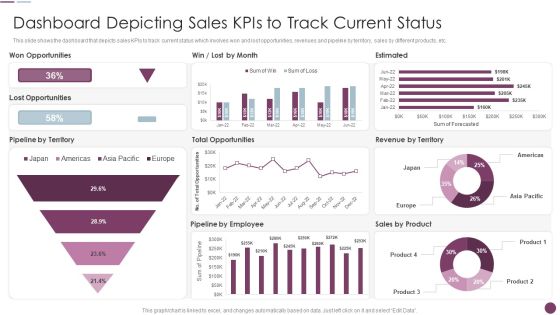
Sales Automation Procedure Dashboard Depicting Sales Kpis To Track Current Status Sample PDF
This slide shows the dashboard that depicts sales KPIs to track current status which involves won and lost opportunities, revenues and pipeline by territory, sales by different products, etc. Deliver an awe inspiring pitch with this creative Sales Automation Procedure Dashboard Depicting Sales Kpis To Track Current Status Sample PDF bundle. Topics like Estimated, Pipeline Employee, Pipeline Territory can be discussed with this completely editable template. It is available for immediate download depending on the needs and requirements of the user.
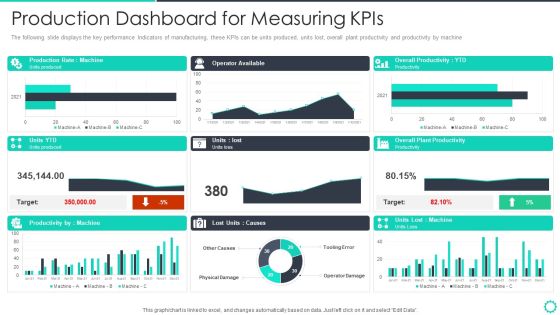
Manufacturing Operation Quality Improvement Practices Tools Templates Production Dashboard For Mockup PDF
The following slide displays the key performance Indicators of manufacturing, these KPIs can be units produced, units lost, overall plant productivity and productivity by machine. Deliver an awe inspiring pitch with this creative manufacturing operation quality improvement practices tools templates production dashboard for mockup pdf bundle. Topics like production dashboard for measuring kpis can be discussed with this completely editable template. It is available for immediate download depending on the needs and requirements of the user.
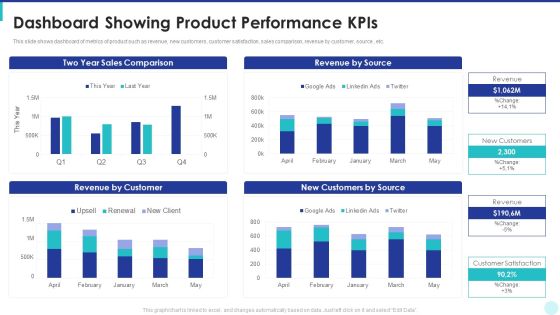
Optimization Of Product Development Life Cycle Dashboard Showing Product Performance Kpis Topics PDF
This slide shows dashboard of metrics of product such as revenue, new customers, customer satisfaction, sales comparison, revenue by customer, source , etc. Deliver an awe inspiring pitch with this creative optimization of product development life cycle dashboard showing product performance kpis topics pdf bundle. Topics like sales comparison, revenue by source, revenue by customer, customers by source can be discussed with this completely editable template. It is available for immediate download depending on the needs and requirements of the user.
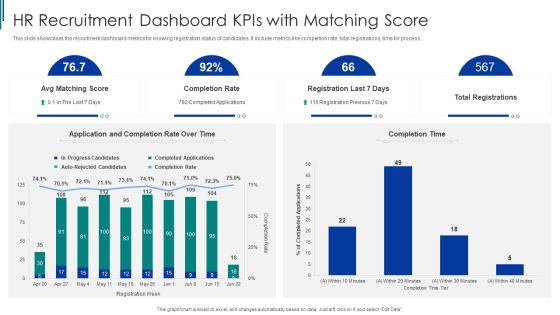
HR Recruitment Dashboard Kpis With Matching Score Ppt Layouts Example PDF
This slide showcases the recruitment dashboard metrics for knowing registration status of candidates. It include metrics like completion rate, total registrations, time for process. Showcasing this set of slides titled HR Recruitment Dashboard Kpis With Matching Score Ppt Layouts Example PDF. The topics addressed in these templates are Completion Rate, Application And Completion, HR Recruitment. All the content presented in this PPT design is completely editable. Download it and make adjustments in color, background, font etc. as per your unique business setting.

Kpis For Evaluating Business Sustainability Customer Churn Rate Dashboard Guidelines PDF
Mentioned slide covers customer churn rate dashboard. It includes details of monthly customer churn rate, accounts opened, churned accounts demographics and churn heatmap. Deliver an awe inspiring pitch with this creative Kpis For Evaluating Business Sustainability Customer Churn Rate Dashboard Guidelines PDF bundle. Topics like Accounts Opened, Monthly Customer, Churn Rate, Demographics can be discussed with this completely editable template. It is available for immediate download depending on the needs and requirements of the user.

Kpis For Evaluating Business Sustainability Customer Lifetime Value Dashboard Clipart PDF
This slide covers customer lifetime value dashboard. It covers details of average customer lifetime and average lifetime value in a 12 months format. Deliver and pitch your topic in the best possible manner with this Kpis For Evaluating Business Sustainability Customer Lifetime Value Dashboard Clipart PDF. Use them to share invaluable insights on Average Customer Lifetime, Average Lifetime Value and impress your audience. This template can be altered and modified as per your expectations. So, grab it now.
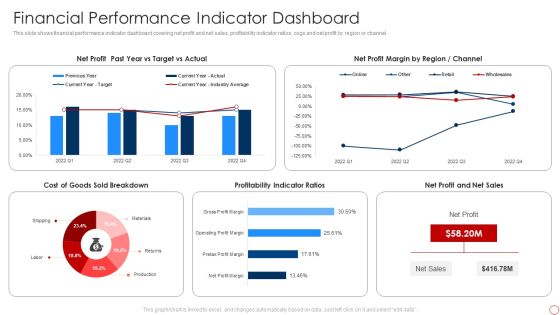
Kpis For Evaluating Business Sustainability Financial Performance Indicator Dashboard Demonstration PDF
This slide shows financial performance indicator dashboard covering net profit and net sales, profitability indicator ratios, cogs and net profit by region or channel. Deliver and pitch your topic in the best possible manner with this Kpis For Evaluating Business Sustainability Financial Performance Indicator Dashboard Demonstration PDF. Use them to share invaluable insights on Net Profit, Net Profit Margin, Profitability Indicator Ratios and impress your audience. This template can be altered and modified as per your expectations. So, grab it now.
WAF Platform Kpis Dashboard For Threat Tracking In WAF Demonstration PDF
This slide depicts how threat risk will be monitored and threat detection will be done in the organization through web application firewall implementation. Deliver an awe inspiring pitch with this creative WAF Platform Kpis Dashboard For Threat Tracking In WAF Demonstration PDF bundle. Topics like Current Risk Status, Threat Dashboard, Risk By Threats can be discussed with this completely editable template. It is available for immediate download depending on the needs and requirements of the user.
Market Penetration Dashboard With Population Metrics Ppt Icon Graphics Design PDF
This slide shows market penetration dashboard with key demographics. It provides information about census population, per capita income, leads to be penetrated and footfall. Showcasing this set of slides titled Market Penetration Dashboard With Population Metrics Ppt Icon Graphics Design PDF. The topics addressed in these templates are Census Population, Per Capita Income, Footfall. All the content presented in this PPT design is completely editable. Download it and make adjustments in color, background, font etc. as per your unique business setting.

Revenue And Expense Budget Deficit Analysis With KPI Dashboard Rules PDF
Showcasing this set of slides titled Revenue And Expense Budget Deficit Analysis With KPI Dashboard Rules PDF. The topics addressed in these templates are Revenue And Expense, Budget Deficit Analysis. All the content presented in this PPT design is completely editable. Download it and make adjustments in color, background, font etc. as per your unique business setting.
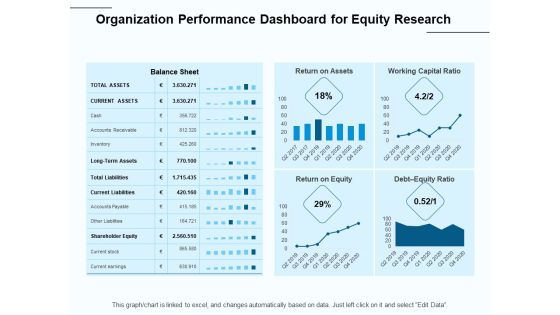
Fund Investment Advisory Statement Organization Performance Dashboard For Equity Research Demonstration PDF
Presenting this set of slides with name fund investment advisory statement organization performance dashboard for equity research demonstration pdf. The topics discussed in these slides are assets, equity, working capital ratio, liabilities, accounts payable. This is a completely editable PowerPoint presentation and is available for immediate download. Download now and impress your audience.

Performance Monitoring Dashboard For Consumer Goods Industry Analysis Of Food Infographics PDF
This slide showcase the performance monitoring dashboard for consumer goods providing information regarding the overview of food and beverages sales, top selling products and on shelf availability.There are so many reasons you need a Performance Monitoring Dashboard For Consumer Goods Industry Analysis Of Food Infographics PDF. The first reason is you can not spend time making everything from scratch, Thus, Slidegeeks has made presentation templates for you too. You can easily download these templates from our website easily.
Product Branding To Enhance Product Sales Performance Tracking Dashboard Infographics PDF
This slide provides information regarding product branding performance tracking dashboard in terms of revenues, new customers, customer satisfaction rate. Make sure to capture your audiences attention in your business displays with our gratis customizable Product Branding To Enhance Product Sales Performance Tracking Dashboard Infographics PDF. These are great for business strategies, office conferences, capital raising or task suggestions. If you desire to acquire more customers for your tech business and ensure they stay satisfied, create your own sales presentation with these plain slides.
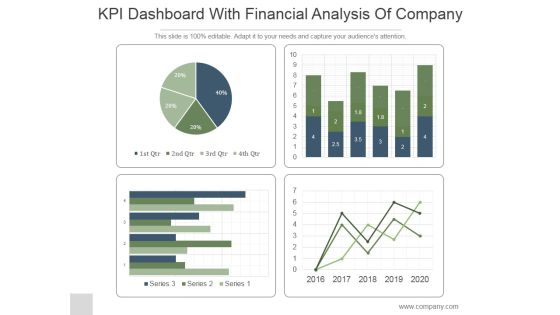
KPI Dashboard With Financial Analysis Of Company Ppt PowerPoint Presentation Backgrounds
This is a kpi dashboard with financial analysis of company ppt powerpoint presentation backgrounds. This is a four stage process. The stages in this process are business, strategy, marketing, line graph, finance.

Crm Dashboard This Year Sales Vs Last Year Sales Ppt PowerPoint Presentation Deck
This is a crm dashboard this year sales vs last year sales ppt powerpoint presentation deck. This is a two stage process. The stages in this process are business, marketing, success, growth, finance.

Crm Dashboard Current Lead Status Ppt PowerPoint Presentation Infographic Template Visual Aids
This is a crm dashboard current lead status ppt powerpoint presentation infographic template visual aids. This is a six stage process. The stages in this process are bar graph, finance, marketing, strategy, business, analysis.

Crm Dashboard Deals By Expected Close Date Ppt PowerPoint Presentation Portfolio Icons
This is a crm dashboard deals by expected close date ppt powerpoint presentation portfolio icons. This is a three stage process. The stages in this process are bar graph, finance, marketing, strategy, business, analysis, growth.

Crm Dashboard Deals By Expected Close Date Ppt PowerPoint Presentation Show Information
This is a crm dashboard deals by expected close date ppt powerpoint presentation show information. This is a three stage process. The stages in this process are deals by expected close date, percentage, business, finance, success.
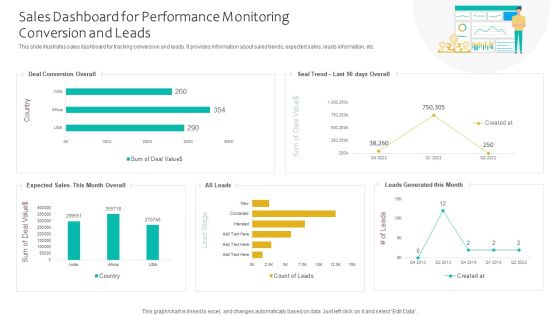
Sales Dashboard For Performance Monitoring Conversion And Leads Ppt Infographics Smartart PDF
This slide illustrates sales dashboard for tracking conversion and leads. It provides information about sales trends, expected sales, leads information, etc. Showcasing this set of slides titled Sales Dashboard For Performance Monitoring Conversion And Leads Ppt Infographics Smartart PDF. The topics addressed in these templates are Deal Conversion Overall, Expected Sales, Leads Generated. All the content presented in this PPT design is completely editable. Download it and make adjustments in color, background, font etc. as per your unique business setting.

Organizational Change Management Process Flow Dashboard Ppt PowerPoint Presentation Diagram PDF
This slide covers Business change management lifecycle dashboard. It involves overall health, customer data, financials and operational efficiency. Pitch your topic with ease and precision using this Organizational Change Management Process Flow Dashboard Ppt PowerPoint Presentation Diagram PDF. This layout presents information on Financial Data, Operational Efficiency, Consumer Data. It is also available for immediate download and adjustment. So, changes can be made in the color, design, graphics or any other component to create a unique layout.
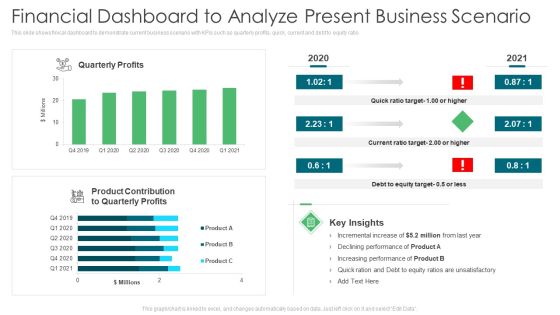
Environmental Assessment Financial Dashboard To Analyze Present Business Scenario Ppt Infographics Ideas PDF
This slide shows finical dashboard to demonstrate current business scenario with KPIs such as quarterly profits, quick, current and debt to equity ratio. Deliver an awe inspiring pitch with this creative environmental assessment financial dashboard to analyze present business scenario ppt infographics ideas pdf bundle. Topics like product contribution, increasing performance, equity target can be discussed with this completely editable template. It is available for immediate download depending on the needs and requirements of the user.

Optimizing E Business Promotion Plan Dashboard Showing E Marketing Performance Ideas PDF
This slide focuses on the dashboard that shows the e-marketing performance such ad lead funnel, traffic sources, monthly leads and key metrics. Deliver an awe inspiring pitch with this creative Optimizing E Business Promotion Plan Dashboard Showing E Marketing Performance Ideas PDF bundle. Topics like Lead Funnel, Key Metrics, Traffic Sources can be discussed with this completely editable template. It is available for immediate download depending on the needs and requirements of the user.

Online Customer Interaction Dashboard For Tracking Social Media Platforms Infographics PDF
This slide covers the KPI dashboard for analyzing social media channels. It includes metrics such as social media followers, Facebook daily reach, Facebook engaged users and page impressions, etc. Deliver and pitch your topic in the best possible manner with this Online Customer Interaction Dashboard For Tracking Social Media Platforms Infographics PDF. Use them to share invaluable insights on Awareness, Daily Reach, Impression Final and impress your audience. This template can be altered and modified as per your expectations. So, grab it now.

Unified Business To Consumer Marketing Strategy Lead Generation Dashboard Template PDF
This infographic is used to track the multichannel marketing dashboard which covers lead breakdown, different social media channels, conversion metrics.Deliver and pitch your topic in the best possible manner with this unified business to consumer marketing strategy lead generation dashboard template pdf. Use them to share invaluable insights on key conversion metrics, today lead by program, leads this month and impress your audience. This template can be altered and modified as per your expectations. So, grab it now.

Real Estate Marketing Strategy Vendors Real Estate Marketing Dashboard Formats PDF
This template covers KPI dashboard for real estate marketing plan including website visitors, page review, top referrals, traffic sources, email campaign etc. Deliver and pitch your topic in the best possible manner with this real estate marketing strategy vendors real estate marketing dashboard formats pdf. Use them to share invaluable insights on leads trend, email campaigns, mobile and impress your audience. This template can be altered and modified as per your expectations. So, grab it now.
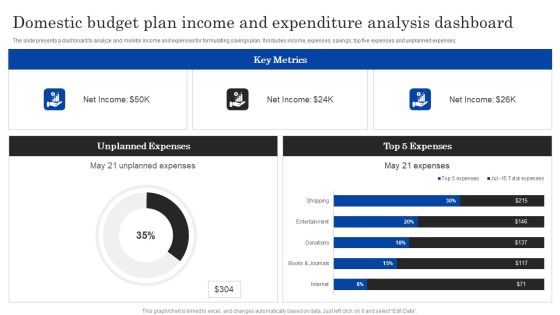
Domestic Budget Plan Income And Expenditure Analysis Dashboard Ppt PowerPoint Presentation Layouts Clipart Images PDF
The slide presents a dashboard to analyze and monitor income and expenses for formulating savings plan. It includes income, expenses, savings, top five expenses and unplanned expenses.Pitch your topic with ease and precision using this Domestic Budget Plan Income And Expenditure Analysis Dashboard Ppt PowerPoint Presentation Layouts Clipart Images PDF. This layout presents information on Unplanned Expenses, Expenses, Key Metrics. It is also available for immediate download and adjustment. So, changes can be made in the color, design, graphics or any other component to create a unique layout.
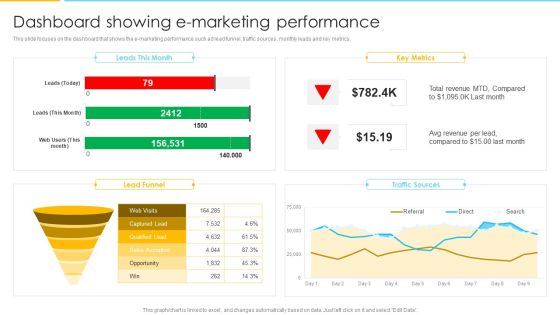
Optimizing Ecommerce Marketing Plan To Improve Sales Dashboard Showing E Marketing Performance Formats PDF
This slide focuses on the dashboard that shows the e marketing performance such ad lead funnel, traffic sources, monthly leads and key metrics. Deliver an awe inspiring pitch with this creative Optimizing Ecommerce Marketing Plan To Improve Sales Dashboard Showing E Marketing Performance Formats PDF bundle. Topics like Revenue, Key Metrics, Traffic Sources can be discussed with this completely editable template. It is available for immediate download depending on the needs and requirements of the user.
Environmental Assessment Financial Dashboard For Business Impact Tracking Ppt Layouts Guidelines PDF
This slide shows financial dashboard for business impact tracking with key performance indicators like quick ratio, current ratio, monthly cash flow etc Deliver and pitch your topic in the best possible manner with this environmental assessment financial dashboard for business impact tracking ppt layouts guidelines pdf. Use them to share invaluable insights on sales outstanding, cash balance, accounts payable and impress your audience. This template can be altered and modified as per your expectations. So, grab it now.

AI And ML Driving Monetary Value For Organization Customer Engagement Tracking Kpi Dashboard Pictures PDF
This slide displays customer engagement dashboard. It include key performance indicators namely median lifetime spend. Average churn risk, brand affinities and highly engaged customers. Deliver an awe inspiring pitch with this creative ai and ml driving monetary value for organization customer engagement tracking kpi dashboard pictures pdf bundle. Topics like high earners, high engaged customers, return customers, brand affinities, interests can be discussed with this completely editable template. It is available for immediate download depending on the needs and requirements of the user.
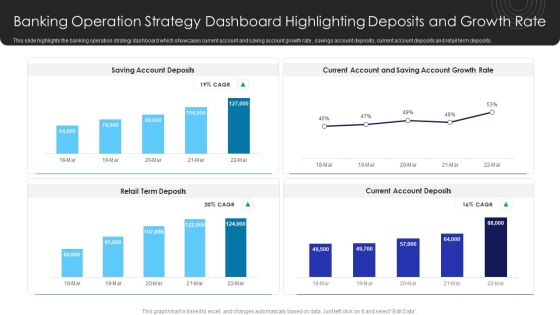
Operational Innovation In Banking Banking Operation Strategy Dashboard Highlighting Deposits Clipart PDF
This slide highlights the banking operation strategy dashboard which showcases current account and saving account growth rate, savings account deposits, current account deposits and retail term deposits. Boost your pitch with our creative Operational Innovation In Banking Banking Operation Strategy Dashboard Highlighting Deposits Clipart PDF. Deliver an awe-inspiring pitch that will mesmerize everyone. Using these presentation templates you will surely catch everyones attention. You can browse the ppts collection on our website. We have researchers who are experts at creating the right content for the templates. So you dont have to invest time in any additional work. Just grab the template now and use them.

Company Financial Performance Indicators Dashboard With Working Capital And Cash Conversion Icons PDF
This slide shows dashboard of finance KPIs . It covers working capital, cash conversion cycle, vendor payment error rate ,current assets and liabilities. Showcasing this set of slides titled Company Financial Performance Indicators Dashboard With Working Capital And Cash Conversion Icons PDF. The topics addressed in these templates are Current Working Capital, Current Liabilities, Working Capital. All the content presented in this PPT design is completely editable. Download it and make adjustments in color, background, font etc. as per your unique business setting.

Guide To SEO Marketing Website SEO Audit Analysis Dashboard Download PDF
This slide defines the dashboard for analyzing the website SEO audit reports. It includes information about site health, errors, warnings, reports, etc. Find a pre-designed and impeccable Guide To SEO Marketing Website SEO Audit Analysis Dashboard Download PDF. The templates can ace your presentation without additional effort. You can download these easy-to-edit presentation templates to make your presentation stand out from others. So, what are you waiting for Download the template from Slidegeeks today and give a unique touch to your presentation.

Logistics Dashboard For XYZ Logistic Company Orders Ppt Infographic Template Diagrams PDF
The slide shows the logistic measurement dashboard for measuring order status, total orders, overdue shipments, global financial performance etc. Deliver and pitch your topic in the best possible manner with this logistics dashboard for xyz logistic company orders ppt infographic template diagrams pdf. Use them to share invaluable insights on global financial performance, orders, inventory and impress your audience. This template can be altered and modified as per your expectations. So, grab it now.

Logistics Dashboard For XYZ Logistic Company Inventory Ppt Infographic Template Background PDF
The slide shows the logistic measurement dashboard for measuring order status, total orders, overdue shipments, global financial performance etc.Deliver and pitch your topic in the best possible manner with this logistics dashboard for XYZ logistic company inventory ppt infographic template background pdf. Use them to share invaluable insights on global financial performance, orders, volume today and impress your audience. This template can be altered and modified as per your expectations. So, grab it now.

Application Areas Of Nanotechnology Market Value Dashboard With Key Drivers Topics PDF
This slide represent nanotechnology dashboard with CAGR market value and revenue. It includes key drivers, trend and highlights. Showcasing this set of slides titled Application Areas Of Nanotechnology Market Value Dashboard With Key Drivers Topics PDF. The topics addressed in these templates are Market Valued, Market Share, 2020 To 2022. All the content presented in this PPT design is completely editable. Download it and make adjustments in color, background, font etc. as per your unique business setting.
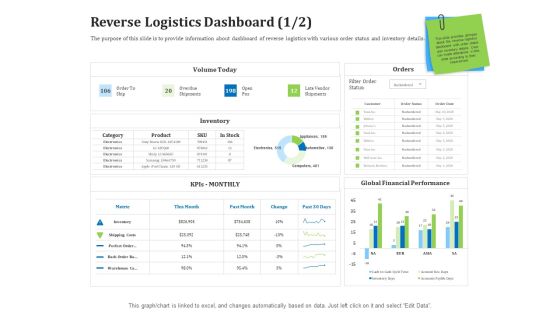
Reverse Logistics Management Reverse Logistics Dashboard Days Ppt Infographics Files PDF
The purpose of this slide is to provide information about dashboard of reverse logistics with various order status and inventory details. Deliver an awe inspiring pitch with this creative reverse logistics management reverse logistics dashboard days ppt infographics files pdf bundle. Topics like global, financial, performance, metric, inventory can be discussed with this completely editable template. It is available for immediate download depending on the needs and requirements of the user.

Development And Operations Pipeline IT KPI Dashboard For Monitoring Project Progress Ideas PDF
Following slide displays KPI dashboard for monitoring project progress. KPIS covered here are planned versus actual hours, risks and issues. Deliver and pitch your topic in the best possible manner with this development and operations pipeline it kpi dashboard for monitoring project progress ideas pdf. Use them to share invaluable insights on project kpis, progress, planned vs actual hours, risks and issues and impress your audience. This template can be altered and modified as per your expectations. So, grab it now.

Artificial Intelligence Playbook Kpi Dashboard For Tracking Business Performance Formats PDF
Mentioned slide portrays KPI dashboard that can be used by organizations to measure their business performance post AI introduction. KPIS covered here are progress, Before versus After AI Implementation, risks and issues. Deliver an awe inspiring pitch with this creative artificial intelligence playbook kpi dashboard for tracking business performance formats pdf bundle. Topics like performance kpis, progress, risk and issues can be discussed with this completely editable template. It is available for immediate download depending on the needs and requirements of the user.

Asset Assessment Dashboard With Cash Flow And Market Value Summary PDF
This slide illustrates asset valuation dashboard with key financial metrics. It provides information about cash flow, market value, intrinsic value, assumptions, market cap, discount rate, etc.Showcasing this set of slides titled Asset Assessment Dashboard With Cash Flow And Market Value Summary PDF. The topics addressed in these templates are Discount Rate, Capital Expenditure, Market Capitalization. All the content presented in this PPT design is completely editable. Download it and make adjustments in color, background, font etc. as per your unique business setting.
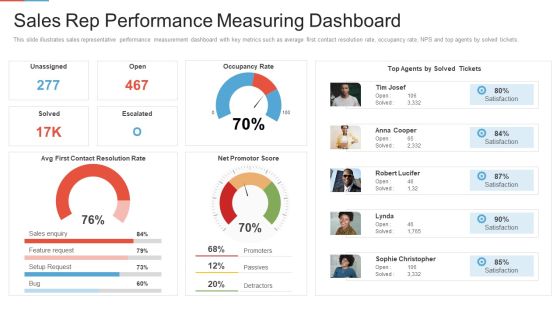
Marketing Outlining Segmentation Initiatives Sales Rep Performance Measuring Dashboard Pictures PDF
This slide illustrates sales representative performance measurement dashboard with key metrics such as average first contact resolution rate, occupancy rate, NPS and top agents by solved tickets. Deliver an awe inspiring pitch with this creative marketing outlining segmentation initiatives sales rep performance measuring dashboard pictures pdf bundle. Topics like occupancy rate, promoters, passives, detractors can be discussed with this completely editable template. It is available for immediate download depending on the needs and requirements of the user.

Debt Retrieval Techniques Debt Management Dashboard Ppt Gallery Example File PDF
Purpose of the following slide is to show the key debt metrics such as total payable account, overdue, percentage overdue and the invoice by status Deliver an awe inspiring pitch with this creative debt retrieval techniques debt management dashboard ppt gallery example file pdf bundle. Topics like debt management dashboard can be discussed with this completely editable template. It is available for immediate download depending on the needs and requirements of the user.

New Era Of B2B Trading B2B Conversion Velocity Dashboard Ppt Show Information PDF
This slide covers the conversion velocity dashboard wherein the lead count is calculated based on marketing qualified and sales qualified lead.Deliver an awe-inspiring pitch with this creative new era of B2B trading B2B conversion velocity dashboard ppt show information pdf. bundle. Topics like trending leads and cpl, leads can be discussed with this completely editable template. It is available for immediate download depending on the needs and requirements of the user.

Organizational Diversity And Inclusion Preferences Diversity And Inclusion Dashboard Background PDF
This infographic provides the D andI dashboard which covers internal mobility, annual performance, employee engagement, etc. Deliver an awe inspiring pitch with this creative organizational diversity and inclusion preferences diversity and inclusion dashboard background pdf bundle. Topics like internal mobility, annual performance reviews, employee engagement, leadership diversity can be discussed with this completely editable template. It is available for immediate download depending on the needs and requirements of the user.
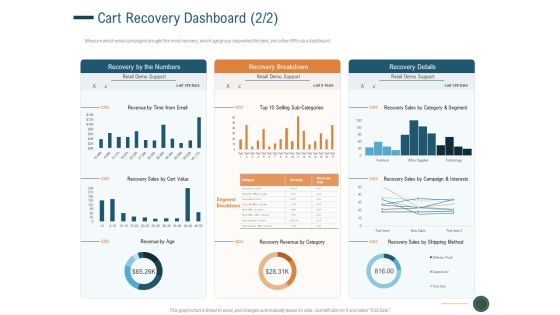
Enhance Profit Client Journey Analysis Cart Recovery Dashboard Value Brochure PDF
Measure which email campaigns brought the most recovery, which age group responded the best, and other KPIs via a dashboard. Deliver an awe-inspiring pitch with this creative enhance profit client journey analysis cart recovery dashboard value brochure pdf bundle. Topics like recovery revenue, recovery rate, revenue per email can be discussed with this completely editable template. It is available for immediate download depending on the needs and requirements of the user.
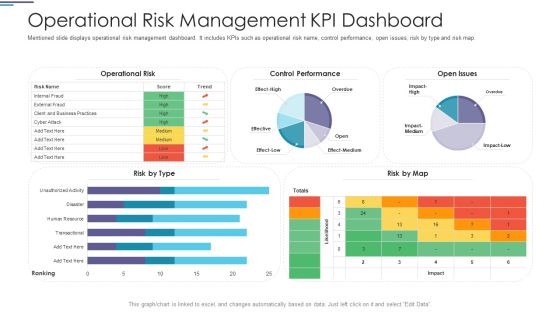
Operational Risk Management KPI Dashboard Ppt PowerPoint Presentation File Designs PDF
Mentioned slide displays operational risk management dashboard. It includes KPIs such as operational risk name, control performance, open issues, risk by type and risk map.Deliver and pitch your topic in the best possible manner with this operational risk management kpi dashboard ppt powerpoint presentation file designs pdf. Use them to share invaluable insights on operational risk, impact medium and impress your audience. This template can be altered and modified as per your expectations. So, grab it now.

Controlling Customer Retention Dashboard Customer Purchase Tracking Sales Ppt Portfolio Template PDF
The firm is looking forward to track customer experience by tracking various touchpoints in order to handle issues such customer churn. KPIs mentioned in the dashboard are measured regularly across the organization. Deliver an awe inspiring pitch with this creative controlling customer retention dashboard customer purchase tracking sales ppt portfolio template pdf bundle. Topics like value, product, revenues can be discussed with this completely editable template. It is available for immediate download depending on the needs and requirements of the user.

Real Estate Marketing Strategy Vendors Real Estate Sales Performance Dashboard Graphics PDF
This template covers real estate marketing plan KPIs including metrics such as targets vs actual sales , properties sold , sales by agents etc. Deliver an awe inspiring pitch with this creative real estate marketing strategy vendors real estate sales performance dashboard graphics pdf bundle. Topics like target, sales, performance dashboard can be discussed with this completely editable template. It is available for immediate download depending on the needs and requirements of the user.
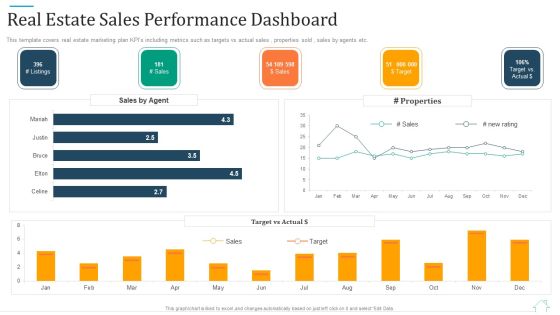
Promotional Strategy For Real Estate Project Real Estate Sales Performance Dashboard Information PDF
This template covers real estate marketing plan KPIs including metrics such as targets vs actual sales , properties sold , sales by agents etc. Deliver an awe inspiring pitch with this creative promotional strategy for real estate project real estate sales performance dashboard information pdf bundle. Topics like real estate sales performance dashboard can be discussed with this completely editable template. It is available for immediate download depending on the needs and requirements of the user.

Cyber Security Risk Management Plan Information Security Risk Management Dashboard Sample PDF
Following slide covers information security risk management dashboard. It include KPIs such as risk analysis progress, percent risk, response progress for risks and number of risks encountered. Deliver an awe inspiring pitch with this creative cyber security risk management plan information security risk management dashboard sample pdf bundle. Topics like vulnerabilities, entities, action plan, risk analysis can be discussed with this completely editable template. It is available for immediate download depending on the needs and requirements of the user.

Cyber Security Risk Management Plan Threat And Vulnerability Management Dashboard Portrait PDF
Following slide displays threat and vulnerability management dashboard. It covers KPIs such as organization exposure score, system configuration score and severity score. Deliver and pitch your topic in the best possible manner with this cyber security risk management plan threat and vulnerability management dashboard portrait pdf. Use them to share invaluable insights on exposure score, configuration score, severity distribution, vulnerable software and impress your audience. This template can be altered and modified as per your expectations. So, grab it now.

Enhancing B2B Demand Creation And Sales Growth Determine B2B Account Management Dashboard Template PDF
This slide provides information regarding B2B account management dashboard catering KPIs related to pipeline deals, landing page completion, email engagement, etc. Deliver and pitch your topic in the best possible manner with this enhancing b2b demand creation and sales growth determine b2b account management dashboard template pdf. Use them to share invaluable insights on pipeline deals, email engagement, revenue by campaign, landing page completion and impress your audience. This template can be altered and modified as per your expectations. So, grab it now.

Environmental Examination Tools And Approaches Financial Dashboard To Analyze Sample PDF
This slide shows finical dashboard to demonstrate current business scenario with KPIs such as quarterly profits, quick, current and debt to equity ratio. Deliver and pitch your topic in the best possible manner with this environmental examination tools and approaches financial dashboard to analyze sample pdf. Use them to share invaluable insights on performance, product, equity and impress your audience. This template can be altered and modified as per your expectations. So, grab it now.
 Home
Home