Cost Dashboard

Analyzing And Deploying HR Analytics Software Kpi Dashboard Information PDF
This slide shows the dashboard representing data related to human resource operations of the enterprise. It includes key metrics such as vacant positions, YTD personal expenses etc. There are so many reasons you need a Analyzing And Deploying HR Analytics Software Kpi Dashboard Information PDF. The first reason is you cant spend time making everything from scratch, Thus, Slidegeeks has made presentation templates for you too. You can easily download these templates from our website easily.

Dashboard For Data Analytics Implementation Ppt Model Files PDF
This slide depicts the dashboard for data integration in the business, and it is showing real time details about expenses, profits, margins percentage, and new addition projects. Deliver and pitch your topic in the best possible manner with this dashboard for data analytics implementation ppt model files pdf. Use them to share invaluable insights on expenses, profits, analytics, data and impress your audience. This template can be altered and modified as per your expectations. So, grab it now.
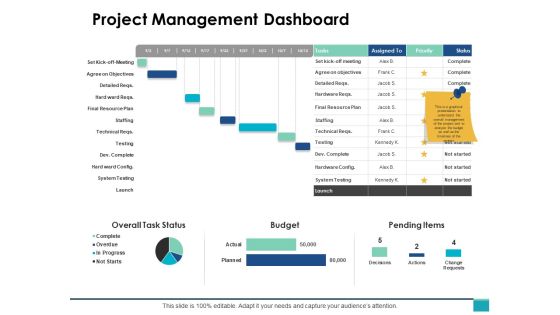
Project Management Dashboard Ppt PowerPoint Presentation Gallery Portrait
This is a project management dashboard ppt powerpoint presentation gallery portrait. The topics discussed in this diagram are finance, marketing, management, investment, analysis. This is a completely editable PowerPoint presentation, and is available for immediate download.
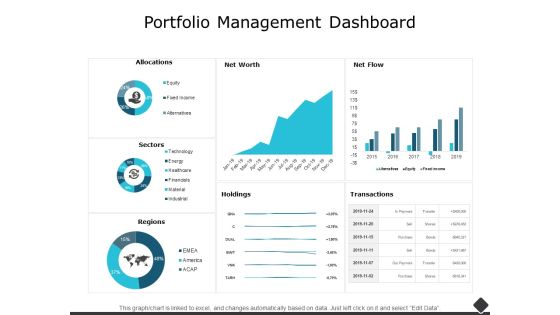
Portfolio Management Dashboard Ppt PowerPoint Presentation Outline Aids
This is a portfolio management dashboard ppt powerpoint presentation outline aids. The topics discussed in this diagram are finance, marketing, management, investment, analysis. This is a completely editable PowerPoint presentation, and is available for immediate download.

Portfolio Management Securities Allocation Dashboard Ppt PowerPoint Presentation Infographics Examples
This is a portfolio management securities allocation dashboard ppt powerpoint presentation infographics examples. The topics discussed in this diagram are finance, marketing, management, investment, analysis. This is a completely editable PowerPoint presentation, and is available for immediate download.
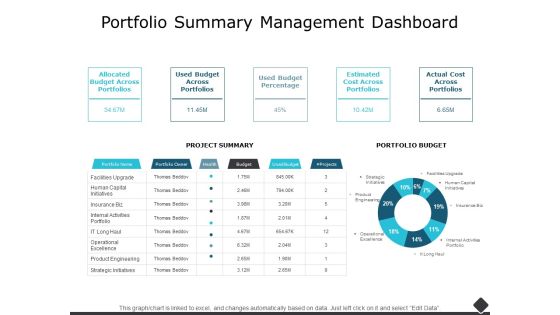
Portfolio Summary Management Dashboard Ppt PowerPoint Presentation Ideas Deck
This is a portfolio summary management dashboard ppt powerpoint presentation ideas deck. The topics discussed in this diagram are finance, marketing, management, investment, analysis. This is a completely editable PowerPoint presentation, and is available for immediate download.

Energy Consumption Assessment Dashboard Ppt Powerpoint Presentation Slides Visual Aids
This is a energy consumption assessment dashboard ppt powerpoint presentation slides visual aids. The topics discussed in this diagram are finance, marketing, management, investment, analysis. This is a completely editable PowerPoint presentation, and is available for immediate download.
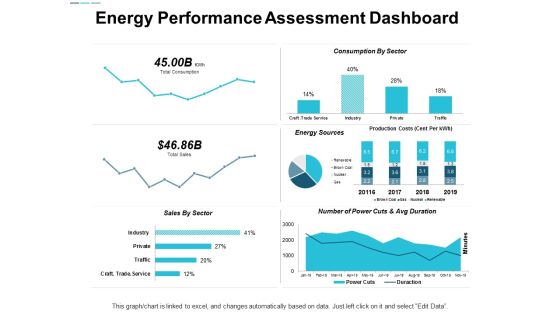
Energy Performance Assessment Dashboard Ppt Powerpoint Presentation Portfolio Deck
This is a energy performance assessment dashboard ppt powerpoint presentation portfolio deck. The topics discussed in this diagram are finance, marketing, management, investment, analysis. This is a completely editable PowerPoint presentation, and is available for immediate download.
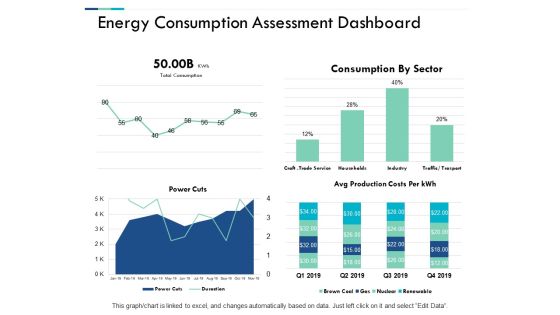
Energy Consumption Assessment Dashboard Ppt PowerPoint Presentation Slides Templates
This is a energy consumption assessment dashboard ppt powerpoint presentation slides templates. The topics discussed in this diagram are finance, marketing, management, investment, analysis. This is a completely editable PowerPoint presentation, and is available for immediate download.

Energy Performance Assessment Dashboard Ppt PowerPoint Presentation Inspiration Background Designs
This is a energy performance assessment dashboard ppt powerpoint presentation inspiration background designs. The topics discussed in this diagram are finance, marketing, management, investment, analysis. This is a completely editable PowerPoint presentation, and is available for immediate download.

Banking Services Delivery And Management Dashboard Icon Designs PDF
Persuade your audience using this Banking Services Delivery And Management Dashboard Icon Designs PDF. This PPT design covers three stages, thus making it a great tool to use. It also caters to a variety of topics including Banking Services Delivery, Management Dashboard Icon. Download this PPT design now to present a convincing pitch that not only emphasizes the topic but also showcases your presentation skills.
Portfolio Tracking Dashboard For Management Procedure Structure PDF
This slide covers portfolio performance tracking KPI dashboard for increasing effectiveness in investment management process. It involves details such as investment, total earning, net profit and monthly portfolio performance.Pitch your topic with ease and precision using this Portfolio Tracking Dashboard For Management Procedure Structure PDF This layout presents information on Investment, Total Earning, Portfolio Performance It is also available for immediate download and adjustment. So, changes can be made in the color, design, graphics or any other component to create a unique layout.

Financial Dashboard To Evaluate Internal Rate Of Return Microsoft PDF
This slide showcases dashboard that can help organization to calculate the internal rate of return on invested capital. Company can use it to communicate the return on investment to investors. Deliver an awe inspiring pitch with this creative Financial Dashboard To Evaluate Internal Rate Of Return Microsoft PDF bundle. Topics like Invested, Equity, Debt can be discussed with this completely editable template. It is available for immediate download depending on the needs and requirements of the user.

Asset Assessment Dashboard With ROI Metrics Topics PDF
This slide illustrates asset valuation dashboard with return on investment metrics. It provides information about internal rate of return, investment type, deal size, asset type, Pitch your topic with ease and precision using this Asset Assessment Dashboard With ROI Metrics Topics PDF. This layout presents information on Investment Amount, Asset Valuation, Internal Return. It is also available for immediate download and adjustment. So, changes can be made in the color, design, graphics or any other component to create a unique layout.
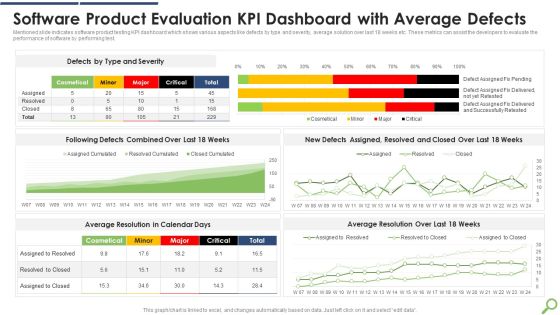
Software Product Evaluation KPI Dashboard With Average Defects Infographics PDF
Mentioned slide indicates software product testing KPI dashboard which shows various aspects like defects by type and severity, average solution over last 18 weeks etc. These metrics can assist the developers to evaluate the performance of software by performing test.Showcasing this set of slides titled Software Product Evaluation KPI Dashboard With Average Defects Infographics PDF The topics addressed in these templates are Software Product, Evaluation Dashboard, Average Defects All the content presented in this PPT design is completely editable. Download it and make adjustments in color, background, font etc. as per your unique business setting.

Revenue Analysis KPI Dashboard Post Building Marketing Strategy Infographics PDF
Following slide outlines a revenue analysis dashboard showcasing the business results after implementing marketing strategy. It provides information about total revenue for the month, revenue for year to date, revenue trend, product revenue and services revenue etc. Pitch your topic with ease and precision using this revenue analysis kpi dashboard post building marketing strategy infographics pdf. This layout presents information on revenue analysis kpi dashboard post building marketing strategy. It is also available for immediate download and adjustment. So, changes can be made in the color, design, graphics or any other component to create a unique layout.
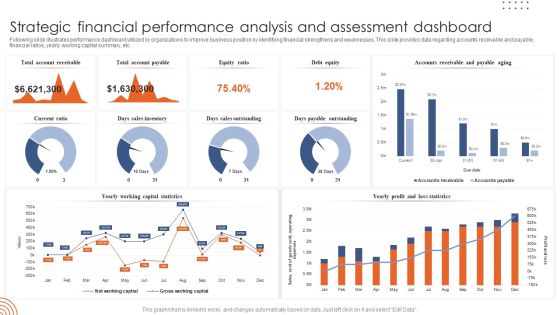
Strategic Financial Performance Analysis And Assessment Dashboard Template PDF
Following slide illustrates performance dashboard utilized by organizations to improve business position by identifying financial strengthens and weaknesses. This slide provides data regarding accounts receivable and payable, financial ratios, yearly working capital summary, etc. Showcasing this set of slides titled Strategic Financial Performance Analysis And Assessment Dashboard Template PDF. The topics addressed in these templates are Strategic Financial Performance, Analysis Assessment Dashboard. All the content presented in this PPT design is completely editable. Download it and make adjustments in color, background, font etc. as per your unique business setting.

Sales Performance Dashboard Template Ppt PowerPoint Presentation Slides Example File
This is a sales performance dashboard template ppt powerpoint presentation slides example file. This is a eight stage process. The stages in this process are business, marketing, strategy, finance, planning.
Sales Performance Dashboard Ppt PowerPoint Presentation Professional Icons
This is a sales performance dashboard template ppt powerpoint presentation slides example file. This is a six stage process. The stages in this process are business, marketing, strategy, finance, planning.

Agriculture Budgeting And Management Based On Dashboard Report Topics PDF
Following slide presents a dashboard that will assist farmers in planning and budgeting based on the key performance indicators. The key performance indicators are crop name, area, last production, current temperature, etc. Showcasing this set of slides titled Agriculture Budgeting And Management Based On Dashboard Report Topics PDF. The topics addressed in these templates are Production Details. All the content presented in this PPT design is completely editable. Download it and make adjustments in color, background, font etc. as per your unique business setting.

Website Data Dashboard With Landing Pages Performance Formats PDF
This slide showcases website statistics dashboard that can help to optimize the pages, formulate the paid advertising and SEO marketing strategy. Its key components are website overview, landing pages, time on site, exit pages, landing page performance and bounce rate. Showcasing this set of slides titled Website Data Dashboard With Landing Pages Performance Formats PDF. The topics addressed in these templates are Website Data Dashboard With Landing Pages Performance. All the content presented in this PPT design is completely editable. Download it and make adjustments in color, background, font etc. as per your unique business setting.

Multi Project Metrics Dashboard With Overall Status Pictures PDF
This slide covers the dashboard that shows the status of project such as status of schedule, resource, quality with projects which are on schedule, in which issues has been occurred, that are critical, etc. That helps the project managers to understand the progress accurately. Pitch your topic with ease and precision using this Multi Project Metrics Dashboard With Overall Status Pictures PDF. This layout presents information on Multi Project, Metrics Dashboard. It is also available for immediate download and adjustment. So, changes can be made in the color, design, graphics or any other component to create a unique layout.
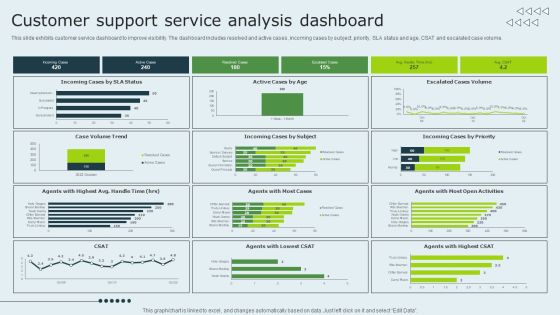
Enhancing Client Experience Customer Support Service Analysis Dashboard Download PDF
This slide exhibits customer service dashboard to improve visibility. The dashboard includes resolved and active cases, incoming cases by subject, priority, SLA status and age, CSAT and escalated case volume. Slidegeeks is one of the best resources for PowerPoint templates. You can download easily and regulate Enhancing Client Experience Customer Support Service Analysis Dashboard Download PDF for your personal presentations from our wonderful collection. A few clicks is all it takes to discover and get the most relevant and appropriate templates. Use our Templates to add a unique zing and appeal to your presentation and meetings. All the slides are easy to edit and you can use them even for advertisement purposes.
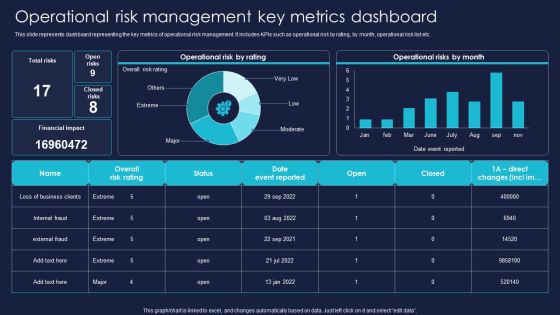
Operational Risk Management Key Metrics Dashboard Professional PDF
This slide represents dashboard representing the key metrics of operational risk management. It includes KPIs such as operational risk by rating, by month, operational risk list etc. Get a simple yet stunning designed Operational Risk Management Key Metrics Dashboard Professional PDF. It is the best one to establish the tone in your meetings. It is an excellent way to make your presentations highly effective. So, download this PPT today from Slidegeeks and see the positive impacts. Our easy to edit Operational Risk Management Key Metrics Dashboard Professional PDF can be your go-to option for all upcoming conferences and meetings. So, what are you waiting for Grab this template today.

Business Intelligence Dashboard To Track Call Center Kpis Download PDF
This slide showcases business intelligence dashboard to help organization track key performance metrics. It further includes details about top agents, close rate, calls handled, abandon rate, scheduled leads, average speed of answer, etc. Pitch your topic with ease and precision using this Business Intelligence Dashboard To Track Call Center Kpis Download PDF. This layout presents information on Business Intelligence Dashboard, Track Call Center Kpis. It is also available for immediate download and adjustment. So, changes can be made in the color, design, graphics or any other component to create a unique layout.
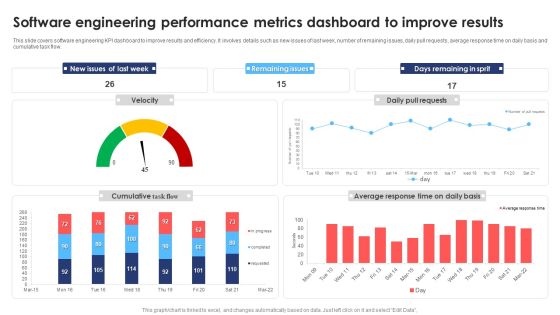
Software Engineering Performance Metrics Dashboard To Improve Results Infographics PDF
This slide covers software engineering KPI dashboard to improve results and efficiency. It involves details such as new issues of last week, number of remaining issues, daily pull requests, average response time on daily basis and cumulative task flow. Pitch your topic with ease and precision using this Software Engineering Performance Metrics Dashboard To Improve Results Infographics PDF. This layout presents information on Software Engineering Performance, Metrics Dashboard Improve Results. It is also available for immediate download and adjustment. So, changes can be made in the color, design, graphics or any other component to create a unique layout.

Business Model Opening Restaurant Coffee Shop Business Dashboard Inspiration PDF
This slide shows the coffee shop business dashboard which includes profit by state, average sales by month, profit, sales by product type, etc. Deliver and pitch your topic in the best possible manner with this business model opening restaurant coffee shop business dashboard inspiration pdf. Use them to share invaluable insights on profit v budgeted, average sales, sales by product and impress your audience. This template can be altered and modified as per your expectations. So, grab it now.

Monthly Social Media Dashboard Ppt PowerPoint Presentation Show Picture
This is a monthly social media dashboard ppt powerpoint presentation show picture. This is a four stage process. The stages in this process are business, finance, marketing, analysis, investment.
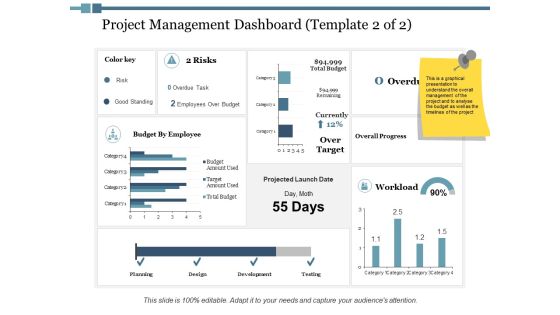
Project Management Dashboard Workload Ppt PowerPoint Presentation Inspiration Show
This is a project management dashboard workload ppt powerpoint presentation inspiration show. This is a four stage process. The stages in this process are finance, marketing, management, investment, analysis.

Change Management Performance Dashboard Ppt PowerPoint Presentation Professional Slides
This is a change management performance dashboard ppt powerpoint presentation professional slides. This is a three stage process. The stages in this process are finance, marketing, management, investment, analysis.
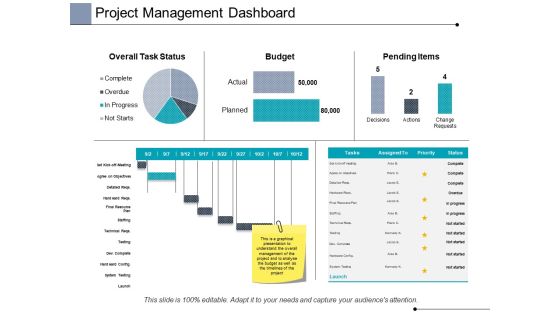
Project Management Dashboard Ppt PowerPoint Presentation Infographic Template Graphics
This is a project management dashboard ppt powerpoint presentation infographic template graphics. This is a three stage process. The stages in this process are finance, analysis, business, investment, marketing.

dashboard marketing business ppt powerpoint presentation gallery slide portrait
This is a dashboard marketing business ppt powerpoint presentation gallery slide portrait. This is a three stage process. The stages in this process are finance, marketing, management, investment, analysis.
Employee Weekly Efficiency Dashboard Ppt PowerPoint Presentation Icon Backgrounds
This is a employee weekly efficiency dashboard ppt powerpoint presentation icon backgrounds. This is a four stage process. The stages in this process are finance, analysis, business, investment, marketing.
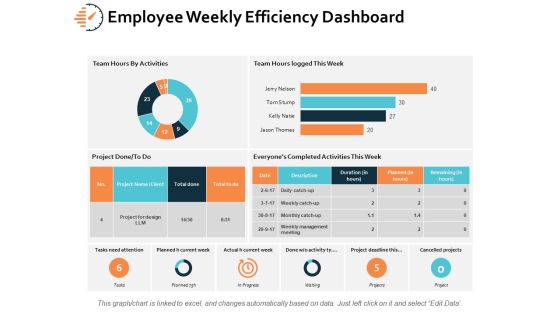
Employee Weekly Efficiency Dashboard Ppt PowerPoint Presentation Infographics Microsoft
This is a employee weekly efficiency dashboard ppt powerpoint presentation infographics microsoft. This is a six stage process. The stages in this process are finance, analysis, business, investment, marketing.
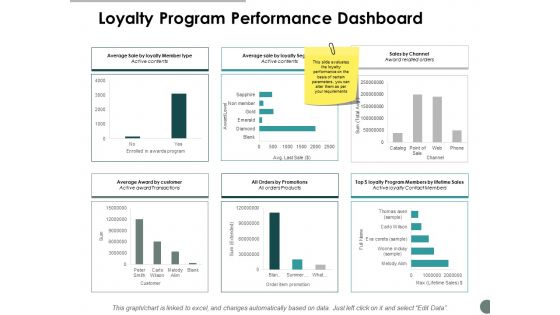
Loyalty Program Performance Dashboard Ppt Powerpoint Presentation Professional Templates
This is a loyalty program performance dashboard ppt powerpoint presentation professional templates. This is a six stage process. The stages in this process are finance, marketing, management, investment, analysis.

Employee Engagement Dashboard Ppt PowerPoint Presentation Professional File Formats
This is a employee engagement dashboard ppt powerpoint presentation professional file formats. This is a four stage process. The stages in this process are finance, marketing, management, investment, analysis.
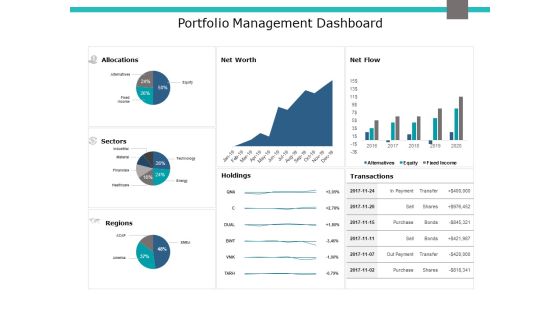
Portfolio Management Dashboard Ppt PowerPoint Presentation Gallery Example Introduction
This is a portfolio management dashboard ppt powerpoint presentation gallery example introduction. This is a three stage process. The stages in this process are area chart, finance, marketing, management, investment.

Portfolio Management Securities Allocation Dashboard Ppt PowerPoint Presentation Pictures Objects
This is a portfolio management securities allocation dashboard ppt powerpoint presentation pictures objects. This is a five stage process. The stages in this process are finance, marketing, management, investment.

Marketing Management Dashboard Stratgegy Ppt PowerPoint Presentation Summary Samples
This is a marketing management dashboard stratgegy ppt powerpoint presentation summary samples. This is a four stage process. The stages in this process are finance, marketing, management, investment, analysis.

Marketing Management Dashboard Ppt PowerPoint Presentation Portfolio Layout Ideas
This is a marketing management dashboard ppt powerpoint presentation portfolio layout ideas. This is a four stage process. The stages in this process are finance, marketing, management, investment, analysis.

Inventory And Logistics Dashboard Ppt PowerPoint Presentation Professional Styles
This is a inventory and logistics dashboard ppt powerpoint presentation professional styles. This is a four stage process. The stages in this process are finance, marketing, management, investment, analysis.

Project Management Monthly Growth Dashboard Ppt PowerPoint Presentation Pictures Guide
This is a project management monthly growth dashboard ppt powerpoint presentation pictures guide. This is a four stage process. The stages in this process are finance, marketing, management, investment, analysis.

Quality Control Kpi Dashboard Ppt PowerPoint Presentation Slides Topics
This is a quality control kpi dashboard ppt powerpoint presentation slides topics. This is a four stage process. The stages in this process are finance, marketing, management, investment, analysis.

Loyalty Program Performance Dashboard Ppt Powerpoint Presentation Gallery Inspiration
This is a loyalty program performance dashboard ppt powerpoint presentation gallery inspiration. This is a six stage process. The stages in this process are finance, marketing, analysis, investment, strategy.

Marketing Management Dashboard Finance Ppt PowerPoint Presentation Ideas Slide Download
This is a marketing management dashboard finance ppt powerpoint presentation ideas slide download. The topics discussed in this diagram are marketing, business, management, planning, strategy This is a completely editable PowerPoint presentation, and is available for immediate download.

Customer Service Metrics Dashboard For Email And Chat Infographics PDF
This slide showcases dashboard for customer service metrics that can help to identify the customer satisfaction score plus implement strategies in case of decline. Its key KPIs are first response time, requester wait time, first response time and time to close. Pitch your topic with ease and precision using this Customer Service Metrics Dashboard For Email And Chat Infographics PDF. This layout presents information on Customer Service, Metrics Dashboard, Email And Chat. It is also available for immediate download and adjustment. So, changes can be made in the color, design, graphics or any other component to create a unique layout.

Call Centre Performance Dashboard With Customer Service Metrics Background PDF
This slide showcases dashboard for call centre performance that can help to evaluate the call abandon rate of customers and implement training of staff for improving customer satisfaction KPIs. Its key elements are total calls, avg answer speed and customer effort score. Showcasing this set of slides titled Call Centre Performance Dashboard With Customer Service Metrics Background PDF. The topics addressed in these templates are Call Centre Performance Dashboard, Customer Service Metrics. All the content presented in this PPT design is completely editable. Download it and make adjustments in color, background, font etc. as per your unique business setting.

Crm Sales Rep Dashboard Ppt PowerPoint Presentation Influencers
This is a crm sales rep dashboard ppt powerpoint presentation influencers. This is a three stage process. The stages in this process are opp duration by pipeline, actual vs goal, opportunities est close next 25 days.

Marketing Management Dashboard Business Ppt PowerPoint Presentation Show Format
This is a marketing management dashboard business ppt powerpoint presentation show format. This is a four stage process. The stages in this process are finance, marketing, management, investment, analysis.

Marketing Management Dashboard Marketing Ppt PowerPoint Presentation Slides Graphics
This is a marketing management dashboard marketing ppt powerpoint presentation slides graphics. This is a three stage process. The stages in this process are finance, marketing, management, investment, analysis.
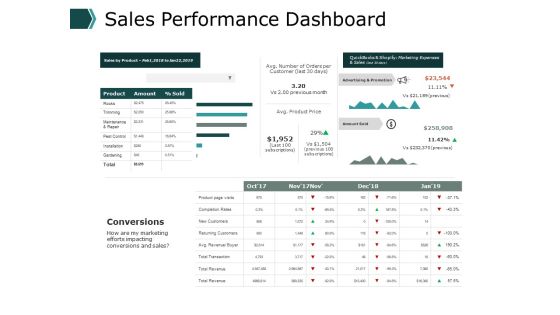
Sales Performance Dashboard Business Ppt PowerPoint Presentation Pictures Visuals
This is a sales performance dashboard business ppt powerpoint presentation pictures visuals . This is a three stage process. The stages in this process are finance, marketing, management, investment, analysis.

Inventory And Logistics Dashboard Ppt PowerPoint Presentation Gallery Clipart
This is a inventory and logistics dashboard ppt powerpoint presentation gallery clipart. This is a four stage process. The stages in this process are finance, marketing, management, investment, analysis.
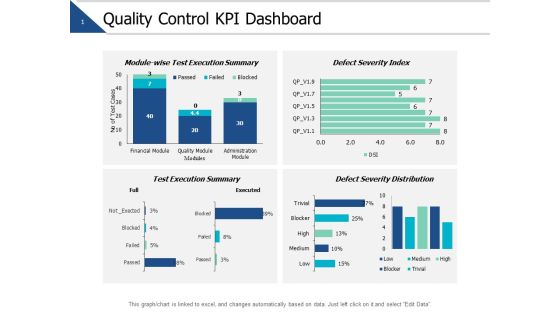
Quality Control Kpi Dashboard Ppt PowerPoint Presentation Show Portrait
This is a quality control kpi dashboard ppt powerpoint presentation show portrait. This is a four stage process. The stages in this process are finance, marketing, management, investment, analysis.
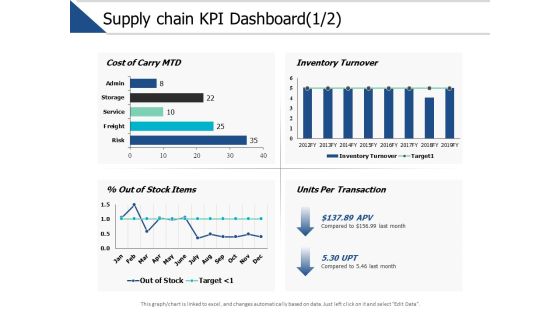
Supply Chain Kpi Dashboard Management Ppt PowerPoint Presentation Model Picture
This is a supply chain kpi dashboard management ppt powerpoint presentation model picture. This is a three stage process. The stages in this process are finance, marketing, management, investment, analysis.
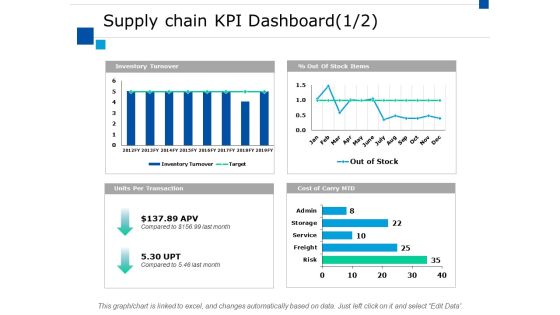
Supply Chain Kpi Dashboard Ppt PowerPoint Presentation Styles Clipart
This is a supply chain kpi dashboard ppt powerpoint presentation styles clipart. This is a four stage process. The stages in this process are finance, marketing, analysis, investment, million.
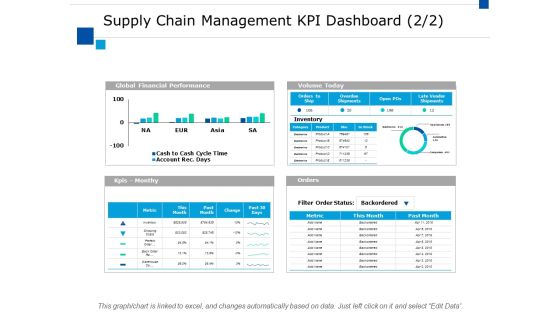
Supply Chain Management Kpi Dashboard Ppt PowerPoint Presentation File Slides
This is a supply chain management kpi dashboard ppt powerpoint presentation file slides. This is a four stage process. The stages in this process are finance, marketing, analysis, investment, million.

Data Center Infrastructure Management KPI Dashboard Designs PDF
This slide covers data center infrastructure management KPI dashboard. It involves details such as cabinets with free data and power ports, data ports usage per user and items per connected power supplies. Showcasing this set of slides titled Data Center Infrastructure Management KPI Dashboard Designs PDF. The topics addressed in these templates are Data Center Infrastructure, Management KPI Dashboard. All the content presented in this PPT design is completely editable. Download it and make adjustments in color, background, font etc. as per your unique business setting.

Data Mining Dashboard Of Gender And Age Demographics Icons PDF
The following slide highlights the data profiling dashboard of gender and age demographics illustrating gender and age per month, gender and general age, average age per month and individual per age group to find the gender and age composition of area Showcasing this set of slides titled data mining dashboard of gender and age demographics icons pdf . The topics addressed in these templates are data mining dashboard of gender and age demographics . All the content presented in this PPT design is completely editable. Download it and make adjustments in color, background, font etc. as per your unique business setting.

Data Dashboard For Multi Websites Performance Comparison Themes PDF
This slide showcases website statistics dashboard that can help to do the comparative assessment of visitors and traffic performance of multiple websites. Its key components are website overview, traffic sources and conversions. Showcasing this set of slides titled Data Dashboard For Multi Websites Performance Comparison Themes PDF. The topics addressed in these templates are Data Dashboard For Multi Websites Performance Comparison. All the content presented in this PPT design is completely editable. Download it and make adjustments in color, background, font etc. as per your unique business setting.
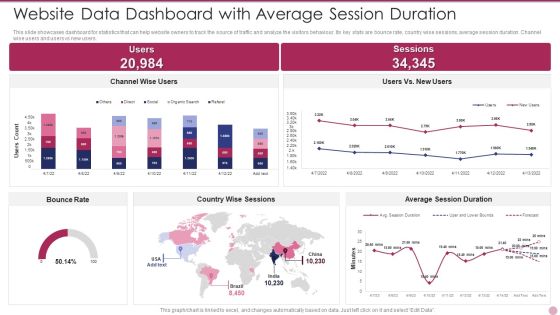
Website Data Dashboard With Average Session Duration Ideas PDF
This slide showcases dashboard for statistics that can help website owners to track the source of traffic and analyze the visitors behaviour. Its key stats are bounce rate, country wise sessions, average session duration. Channel wise users and users vs new users. Pitch your topic with ease and precision using this Website Data Dashboard With Average Session Duration Ideas PDF. This layout presents information on Website Data Dashboard With Average Session Duration. It is also available for immediate download and adjustment. So, changes can be made in the color, design, graphics or any other component to create a unique layout.

 Home
Home