Cost Dashboard

Dashboard Ppt PowerPoint Presentation Infographic Template Graphics Design
This is a dashboard ppt powerpoint presentation infographic template graphics design. This is a three stage process. The stages in this process are business, strategy, marketing, analysis, finance, dashboard.

Key Success Indicators Dashboard Ppt PowerPoint Presentation Model Gallery
This is a key success indicators dashboard ppt powerpoint presentation model gallery. This is a five stage process. The stages in this process are business, strategy, marketing, analysis, finance, dashboard.
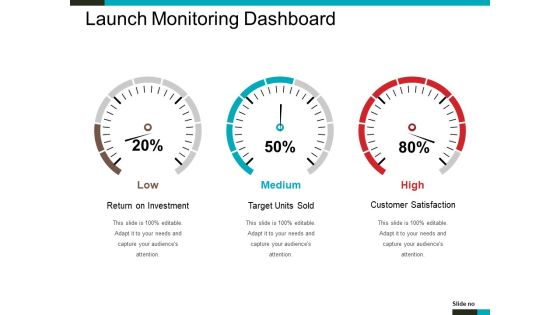
Launch Monitoring Dashboard Ppt PowerPoint Presentation Gallery Files
This is a launch monitoring dashboard ppt powerpoint presentation gallery files. This is a three stage process. The stages in this process are low, medium, high, dashboard, business, percentage.
Monthly Sales Performance Tracking And Monitoring Dashboard Sample PDF
This slide showcases a dashboard presenting various metrics to measure and analyze sales performance for revenue growth. It includes key components such as number of sales, revenue, profit, cost, sales revenue, sales increment, cost analysis and cross sell. Do you have to make sure that everyone on your team knows about any specific topic I yes, then you should give Monthly Sales Performance Tracking And Monitoring Dashboard Sample PDF a try. Our experts have put a lot of knowledge and effort into creating this impeccable Monthly Sales Performance Tracking And Monitoring Dashboard Sample PDF. You can use this template for your upcoming presentations, as the slides are perfect to represent even the tiniest detail. You can download these templates from the Slidegeeks website and these are easy to edit. So grab these today.

Business Development Program Dashboard For Training Program Evaluation Infographics PDF
This slide showcases dashboard that can help organization to evaluate the training program implemented in organization. Its key components are training cost, number of participants, hours of training, cost per participant and occupancy rate. Get a simple yet stunning designed Business Development Program Dashboard For Training Program Evaluation Infographics PDF. It is the best one to establish the tone in your meetings. It is an excellent way to make your presentations highly effective. So, download this PPT today from Slidegeeks and see the positive impacts. Our easy-to-edit Business Development Program Dashboard For Training Program Evaluation Infographics PDF can be your go-to option for all upcoming conferences and meetings. So, what are you waiting for Grab this template today.

Performance Dashboard To Measure Marketing Campaign Performance Brochure PDF
The following slide outlines key performance indicator KPI dashboard that can assist digital marketers to evaluate marketing campaign performance. The success metrics outlined in slide are total spend on advertisement, cost per thousand CPM, cost per click CPC, click-through rate CTR, etc. Want to ace your presentation in front of a live audience Our Performance Dashboard To Measure Marketing Campaign Performance Brochure PDF can help you do that by engaging all the users towards you.. Slidegeeks experts have put their efforts and expertise into creating these impeccable powerpoint presentations so that you can communicate your ideas clearly. Moreover, all the templates are customizable, and easy-to-edit and downloadable. Use these for both personal and commercial use.

Facebook Ads Dashboard Highlighting Marketing Campaign Results Slides PDF
The purpose of this slide is to highlight a comprehensive key performance indicator KPI dashboard which will allow marketers to measure return on investment ROI from social media campaign. The key metrics covered are total ad spend, cost per thousand CPM, cost per click CPC, click through rate CTR, etc. From laying roadmaps to briefing everything in detail, our templates are perfect for you. You can set the stage with your presentation slides. All you have to do is download these easy to edit and customizable templates. Facebook Ads Dashboard Highlighting Marketing Campaign Results Slides PDF will help you deliver an outstanding performance that everyone would remember and praise you for. Do download this presentation today.
Implementing Marketing Strategies Content Marketing Dashboard For Effective Icons PDF
Purpose of the following slide is to show key metrics that can help the organization to track their content marketing efforts, these metrics are ad cost, visits, cost per click etc.. Whether you have daily or monthly meetings, a brilliant presentation is necessary. Implementing Marketing Strategies Content Marketing Dashboard For Effective Icons PDF can be your best option for delivering a presentation. Represent everything in detail using Implementing Marketing Strategies Content Marketing Dashboard For Effective Icons PDF and make yourself stand out in meetings. The template is versatile and follows a structure that will cater to your requirements. All the templates prepared by Slidegeeks are easy to download and edit. Our research experts have taken care of the corporate themes as well. So, give it a try and see the results.
Monthly Sales Performance Tracking And Monitoring Dashboard Inspiration PDF
This slide showcases a dashboard presenting various metrics to measure and analyze sales performance for revenue growth. It includes key components such as number of sales, revenue, profit, cost, sales revenue, sales increment, cost analysis and cross sell. Coming up with a presentation necessitates that the majority of the effort goes into the content and the message you intend to convey. The visuals of a PowerPoint presentation can only be effective if it supplements and supports the story that is being told. Keeping this in mind our experts created Monthly Sales Performance Tracking And Monitoring Dashboard Inspiration PDF to reduce the time that goes into designing the presentation. This way, you can concentrate on the message while our designers take care of providing you with the right template for the situation.

Dashboard To Analyze Impact Of Warehouse Management System Infographics PDF
This slide covers cost analysis for implementing automation procurement tools in logistics and supply chain management. It involves optimization tools, cost involved on monthly basis and its impact on operations. Get a simple yet stunning designed Dashboard To Analyze Impact Of Warehouse Management System Infographics PDF. It is the best one to establish the tone in your meetings. It is an excellent way to make your presentations highly effective. So, download this PPT today from Slidegeeks and see the positive impacts. Our easy-to-edit Dashboard To Analyze Impact Of Warehouse Management System Infographics PDF can be your go-to option for all upcoming conferences and meetings. So, what are you waiting for. Grab this template today.

Corporate Training Program Dashboard For Training Program Evaluation Summary PDF
This slide showcases dashboard that can help organization to evaluate the training program implemented in organization. Its key components are training cost, number of participants, hours of training, cost per participant and occupancy rate Are you in need of a template that can accommodate all of your creative concepts This one is crafted professionally and can be altered to fit any style. Use it with Google Slides or PowerPoint. Include striking photographs, symbols, depictions, and other visuals. Fill, move around, or remove text boxes as desired. Test out color palettes and font mixtures. Edit and save your work, or work with colleagues. Download Corporate Training Program Dashboard For Training Program Evaluation Summary PDF and observe how to make your presentation outstanding. Give an impeccable presentation to your group and make your presentation unforgettable.

Retailer Channel Partner Boot Camp Partner Performance Dashboard Sample PDF
This slide covers the partner performance dashboard for quarterly actual and target sales and pipelines deals. Presenting retailer channel partner boot camp partner performance dashboard sample pdf to provide visual cues and insights. Share and navigate important information on three stages that need your due attention. This template can be used to pitch topics like performance dashboard, target sales, marketing progress. In addition, this PPT design contains high-resolution images, graphics, etc, that are easily editable and available for immediate download.

Dashboard Ppt PowerPoint Presentation Infographic Template Graphic Tips
This is a dashboard ppt powerpoint presentation infographic template graphic tips. This is a three stage process. The stages in this process are low, medium, high, finance.
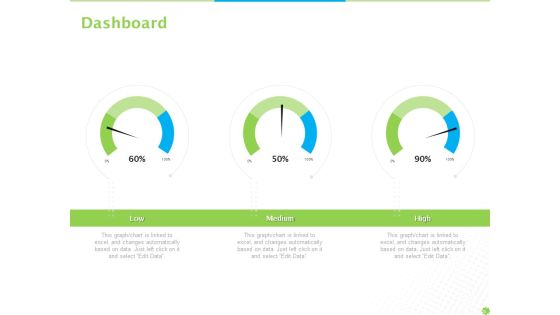
Price Architecture Dashboard Ppt PowerPoint Presentation Portfolio Objects PDF
Presenting price architecture dashboard ppt powerpoint presentation portfolio objects pdf to provide visual cues and insights. Share and navigate important information on one stages that need your due attention. This template can be used to pitch topics like dashboard. In addition, this PPT design contains high-resolution images, graphics, etc, that are easily editable and available for immediate download.

Convertible Debt Financing Pitch Deck Dashboard Template Background PDF
Presenting convertible debt financing pitch deck dashboard template background pdf to provide visual cues and insights. Share and navigate important information on three stages that need your due attention. This template can be used to pitch topics like dashboard . In addition, this PPT design contains high-resolution images, graphics, etc, that are easily editable and available for immediate download.
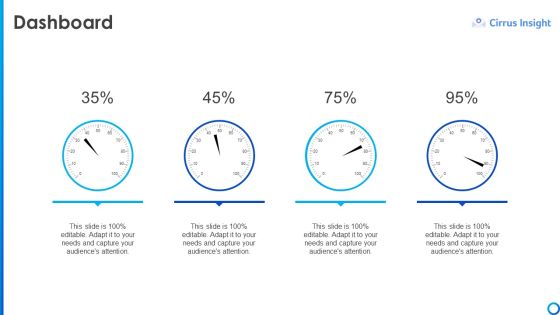
Software Funding Elevator Pitch Deck Dashboard Ppt Professional Portfolio PDF
Presenting software funding elevator pitch deck dashboard ppt professional portfolio pdf to provide visual cues and insights. Share and navigate important information on four stages that need your due attention. This template can be used to pitch topics like dashboard. In addtion, this PPT design contains high resolution images, graphics, etc, that are easily editable and available for immediate download.
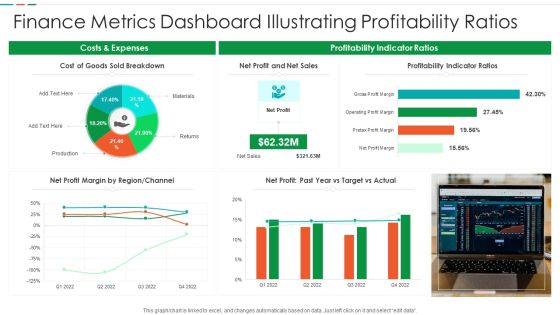
Finance Metrics Dashboard Illustrating Profitability Ratios Diagrams PDF
This graph or chart is linked to excel, and changes automatically based on data. Just left click on it and select edit data. Pitch your topic with ease and precision using this Finance Metrics Dashboard Illustrating Profitability Ratios Diagrams PDF. This layout presents information on Cost Goods Sold, Net Profit Net, Sales Profitability Indicator. It is also available for immediate download and adjustment. So, changes can be made in the color, design, graphics or any other component to create a unique layout.
Project Management Tracking Dashboard To Review Decision Download PDF
The below slide depicts the key performing indicators in project decision making. It includes elements such as overall status, progress, progress, time, cost and work volume. Pitch your topic with ease and precision using this Project Management Tracking Dashboard To Review Decision Download PDF. This layout presents information on Progress, Activity Status, Overall Status. It is also available for immediate download and adjustment. So, changes can be made in the color, design, graphics or any other component to create a unique layout.
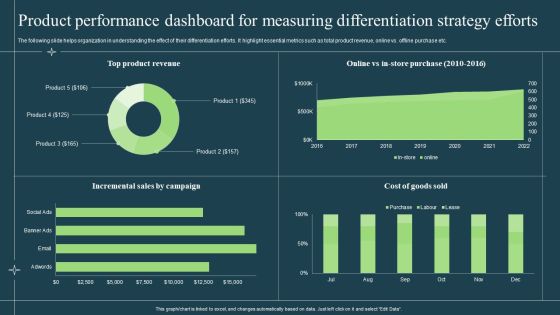
Product Performance Dashboard For Measuring Differentiation Strategy Efforts Diagrams PDF
The following slide helps organization in understanding the effect of their differentiation efforts. It highlight essential metrics such as total product revenue, online vs. offline purchase etc. Deliver an awe inspiring pitch with this creative Product Performance Dashboard For Measuring Differentiation Strategy Efforts Diagrams PDF bundle. Topics like Product, Incremental Sales, Cost Of Goods can be discussed with this completely editable template. It is available for immediate download depending on the needs and requirements of the user.

Effective Outcome Launch Roadmap Dashboard Ppt Professional Files PDF
Presenting this set of slides with name effective outcome launch roadmap dashboard ppt professional files pdf. This is a one stage process. The stages in this process are dashboard. This is a completely editable PowerPoint presentation and is available for immediate download. Download now and impress your audience.
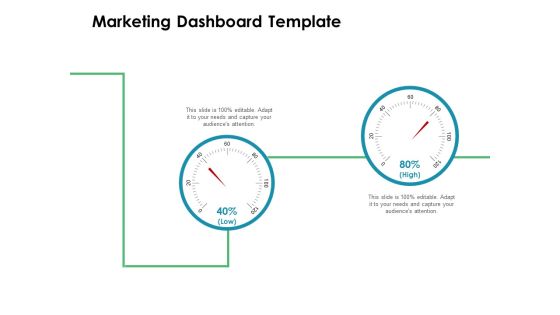
Value Creation Initiatives Marketing Dashboard Ppt Layouts Brochure PDF
This is a value creation initiatives marketing dashboard ppt layouts brochure pdf template with various stages. Focus and dispense information on two stages using this creative set, that comes with editable features. It contains large content boxes to add your information on topics like marketing dashboard. You can also showcase facts, figures, and other relevant content using this PPT layout. Grab it now.

Reach Your Target Audience Marketing Dashboard Ppt Pictures Show PDF
This is a reach your target audience marketing dashboard ppt pictures show pdf template with various stages. Focus and dispense information on three stages using this creative set, that comes with editable features. It contains large content boxes to add your information on topics like marketing dashboard. You can also showcase facts, figures, and other relevant content using this PPT layout. Grab it now.

Business Venture Tactical Planning Complete PPT Deck Dashboard Elements PDF
This is a business venture tactical planning complete ppt deck dashboard elements pdf template with various stages. Focus and dispense information on three stages using this creative set, that comes with editable features. It contains large content boxes to add your information on topic like dashboard. You can also showcase facts, figures, and other relevant content using this PPT layout. Grab it now.

Finance Dashboard Ppt PowerPoint Presentation Model Graphics Example
This is a finance dashboard ppt powerpoint presentation model graphics example. This is a two stage process. The stages in this process are sales, operating expenses, operating income, net income.

Change Management Performance Dashboard Ppt PowerPoint Presentation Professional Portrait
This is a change management performance dashboard ppt powerpoint presentation professional portrait. This is a three stage process. The stages in this process are finance, marketing, analysis, business, investment.

Launch Monitoring Dashboard Ppt PowerPoint Presentation Slides Structure
This is a launch monitoring dashboard ppt powerpoint presentation slides structure. This is a three stage process. The stages in this process are return on investment, target units sold, customer satisfaction.
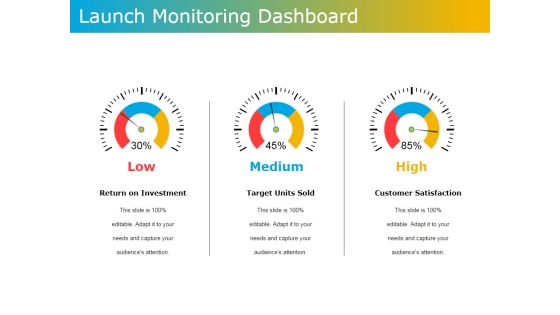
Launch Monitoring Dashboard Ppt PowerPoint Presentation File Aids
This is a launch monitoring dashboard ppt powerpoint presentation file aids. This is a three stage process. The stages in this process are return on investment, target units sold, customer satisfaction, medium, high.
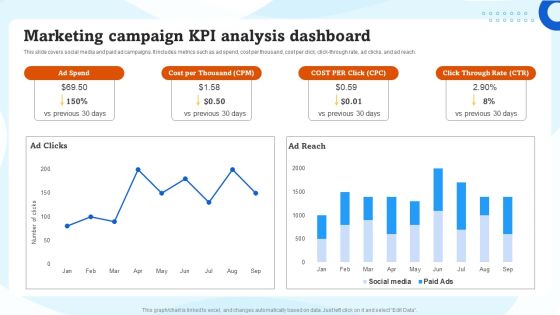
Marketing Campaign KPI Analysis Dashboard Ppt Inspiration Example File PDF
This slide covers social media and paid ad campaigns. It includes metrics such as ad spend, cost per thousand, cost per click, click-through rate, ad clicks, and ad reach. Coming up with a presentation necessitates that the majority of the effort goes into the content and the message you intend to convey. The visuals of a PowerPoint presentation can only be effective if it supplements and supports the story that is being told. Keeping this in mind our experts created Marketing Campaign KPI Analysis Dashboard Ppt Inspiration Example File PDF to reduce the time that goes into designing the presentation. This way, you can concentrate on the message while our designers take care of providing you with the right template for the situation.
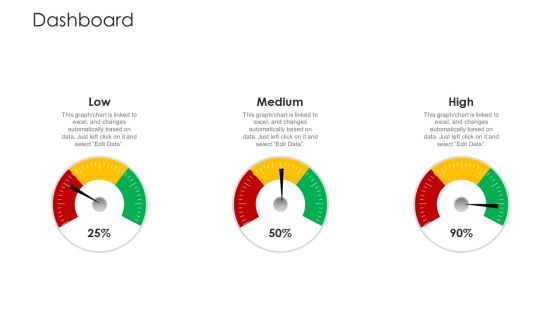
Establishing Operational Risk Framework Banking Dashboard Ppt Model Summary PDF
Presenting establishing operational risk framework banking dashboard ppt model summary pdf to provide visual cues and insights. Share and navigate important information on three stages that need your due attention. This template can be used to pitch topics like low, medium, high. In addition, this PPT design contains high-resolution images, graphics, etc, that are easily editable and available for immediate download.

Early Stage Funding Dashboard Ppt Gallery Slideshow PDF
Presenting early stage funding dashboard ppt gallery slideshow pdf to provide visual cues and insights. Share and navigate important information on three stages that need your due attention. This template can be used to pitch topics like low, medium, high. In addtion, this PPT design contains high resolution images, graphics, etc, that are easily editable and available for immediate download.
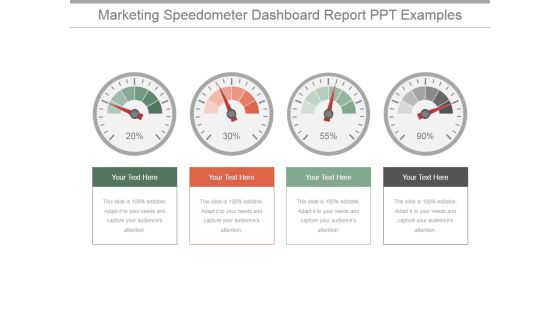
Marketing Speedometer Dashboard Report Ppt PowerPoint Presentation Designs Download
This is a marketing speedometer dashboard report ppt powerpoint presentation designs download. This is a four stage process. The stages in this process are dashboard, measurement, percentage, business, finance.

Performance Dashboard Template 2 Ppt PowerPoint Presentation Show Backgrounds
This is a performance dashboard template 2 ppt powerpoint presentation show backgrounds. This is a four stage process. The stages in this process are performance dashboard, business, marketing, management, finance.

Dashboard Ppt PowerPoint Presentation Introduction Ppt PowerPoint Presentation Pictures
This is a dashboard ppt powerpoint presentation introduction ppt powerpoint presentation pictures. This is a three stage process. The stages in this process are business, strategy, marketing, success, dashboard.

Computer Security Incident Handling Dashboard Ppt Model Introduction PDF
Presenting this set of slides with name computer security incident handling dashboard ppt model introduction pdf. This is a three stage process. The stages in this process are minimum, medium, maximum. This is a completely editable PowerPoint presentation and is available for immediate download. Download now and impress your audience.

Train Employees Health Safety Dashboard Ppt Model Layout Ideas PDF
Presenting this set of slides with name train employees health safety dashboard ppt model layout ideas pdf. This is a three stage process. The stages in this process are low, medium, high. This is a completely editable PowerPoint presentation and is available for immediate download. Download now and impress your audience.

Agile Sprint Marketing Dashboard Template Ppt File Layout Ideas PDF
Presenting this set of slides with name agile sprint marketing dashboard template ppt file layout ideas pdf. This is a three stage process. The stages in this process are sprint planning, sprint review, sprint retrospective, the scrum process. This is a completely editable PowerPoint presentation and is available for immediate download. Download now and impress your audience.

Brand Building Brand Performance Dashboard Ppt Icon Diagrams PDF
Presenting this set of slides with name brand building brand performance dashboard ppt icon diagrams pdf. This is a three stage process. The stages in this process are customer recognition, enhanced sales, competitive edge. This is a completely editable PowerPoint presentation and is available for immediate download. Download now and impress your audience.

Brand Identity How Build It Dashboard Ppt Summary Clipart PDF
Presenting this set of slides with name brand identity how build it dashboard ppt summary clipart pdf. This is a three stage process. The stages in this process are low, medium, high. This is a completely editable PowerPoint presentation and is available for immediate download. Download now and impress your audience.
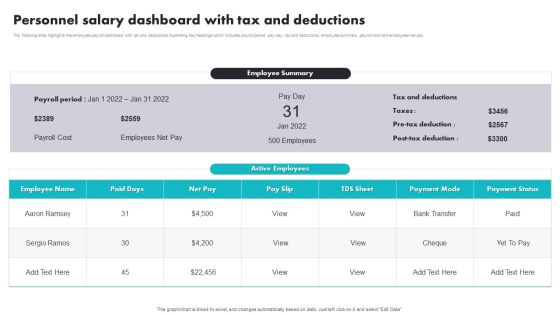
Personnel Salary Dashboard With Tax And Deductions Inspiration PDF
The following slide highlights the employee payroll dashboard with tax and deductions illustrating key headings which includes payroll period, pay day, tax and deductions, employee summary, payroll cost and employees net pay. Showcasing this set of slides titled Personnel Salary Dashboard With Tax And Deductions Inspiration PDF. The topics addressed in these templates are Personnel Salary Dashboard, Tax And Deductions. All the content presented in this PPT design is completely editable. Download it and make adjustments in color, background, font etc. as per your unique business setting.
Employee Training And Development Plan Performance Tracking Dashboard Portrait PDF
Mentioned slide outlines key performance indicator KPI dashboard which can be used by organization to monitor training and development strategies. The major metrics covered in the template are cost per participant, per hour, number of trainees , etc. Showcasing this set of slides titled Employee Training And Development Plan Performance Tracking Dashboard Portrait PDF. The topics addressed in these templates are Employee Training, Development Plan Performance, Tracking Dashboard. All the content presented in this PPT design is completely editable. Download it and make adjustments in color, background, font etc. as per your unique business setting.

Dashboard Of Digital Advertisement Data Mining Professional PDF
The following slide highlights the dashboard of digital advertisement data profiling illustrating key headings which includes campaign name, period, ads spend results, ads generating actions, ad conversion and cost and campaign performance. Pitch your topic with ease and precision using this dashboard of digital advertisement data mining professional pdf . This layout presents information on dashboard of digital advertisement data mining . It is also available for immediate download and adjustment. So, changes can be made in the color, design, graphics or any other component to create a unique layout.

Consumption Based Pricing Model Business Performance Dashboard Demonstration PDF
The following slide display a business performance dashboard that highlights the average revenue per unit, customer acquisition cost and profit earned. Crafting an eye catching presentation has never been more straightforward. Let your presentation shine with this tasteful yet straightforward Consumption Based Pricing Model Business Performance Dashboard Demonstration PDF template. It offers a minimalistic and classy look that is great for making a statement. The colors have been employed intelligently to add a bit of playfulness while still remaining professional. Construct the ideal Consumption Based Pricing Model Business Performance Dashboard Demonstration PDF that effortlessly grabs the attention of your audience. Begin now and be certain to wow your customers.

Business Newsletter Referral Marketing Program Performance KPI Dashboard Formats PDF
This slide represents KPI dashboard designed to track performance of the program conducted to attract new leads at lower cost with the help of existing customers to generate leads that best fit the organization. It includes key metrics such as total revenue generated, monthly recurring revenue, paying customers etc. Showcasing this set of slides titled Business Newsletter Referral Marketing Program Performance KPI Dashboard Formats PDF. The topics addressed in these templates are Dashboard, Paying Customers, Monthly Recurring Revenue, Total Revenue Generated. All the content presented in this PPT design is completely editable. Download it and make adjustments in color, background, font etc. as per your unique business setting.
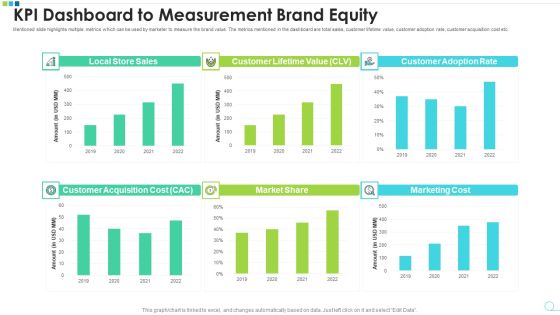
KPI Dashboard To Measurement Brand Equity Microsoft PDF
Mentioned slide highlights multiple metrics which can be used by marketer to measure the brand value. The metrics mentioned in the dashboard are total sales, customer lifetime value, customer adoption rate, customer acquisition cost etc. Pitch your topic with ease and precision using this kpi dashboard to measurement brand equity microsoft pdf. This layout presents information on kpi dashboard to measurement brand equity. It is also available for immediate download and adjustment. So, changes can be made in the color, design, graphics or any other component to create a unique layout.
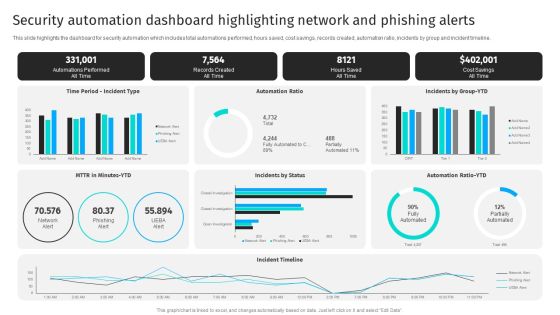
Security Automation Dashboard Highlighting Network And Phishing Alerts Professional PDF
This slide highlights the dashboard for security automation which includes total automations performed, hours saved, cost savings, records created, automation ratio, incidents by group and incident timeline.Get a simple yet stunning designed Security Automation Dashboard Highlighting Network And Phishing Alerts Professional PDF. It is the best one to establish the tone in your meetings. It is an excellent way to make your presentations highly effective. So, download this PPT today from Slidegeeks and see the positive impacts. Our easy-to-edit Security Automation Dashboard Highlighting Network And Phishing Alerts Professional PDF can be your go-to option for all upcoming conferences and meetings. So, what are you waiting for Grab this template today.

Leadership Recruitment Dashboard With Recruitment Funnel Slides PDF
The slide shows a dashboard for managing recruitment process of an organization for leadership hiring. It includes cost of hiring by different levels, turnover rate by different age groups, hiring funnel and average time taken by each department for hiring. Pitch your topic with ease and precision using this Leadership Recruitment Dashboard With Recruitment Funnel Slides PDF. This layout presents information on Leadership Recruitment, Dashboard With Recruitment. It is also available for immediate download and adjustment. So, changes can be made in the color, design, graphics or any other component to create a unique layout.
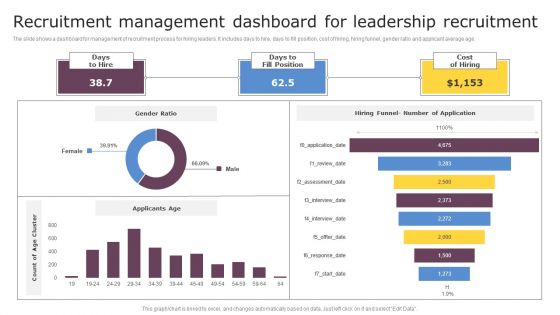
Recruitment Management Dashboard For Leadership Recruitment Graphics PDF
The slide shows a dashboard for management of recruitment process for hiring leaders. It includes days to hire, days to fill position, cost of hiring, hiring funnel, gender ratio and applicant average age. Showcasing this set of slides titled Recruitment Management Dashboard For Leadership Recruitment Graphics PDF. The topics addressed in these templates are Recruitment Management, Dashboard For Leadership. All the content presented in this PPT design is completely editable. Download it and make adjustments in color, background, font etc. as per your unique business setting.
KPI Dashboard For Tracking Brand Communication Techniques Performance Topics PDF
The following slide illustrates dashboard which helps brand managers to improve their communication campaign performance. It presents information related to campaigns, cost per acquisitions, etc. Pitch your topic with ease and precision using this KPI Dashboard For Tracking Brand Communication Techniques Performance Topics PDF. This layout presents information on KPI Dashboard, Tracking Brand Communication, Techniques Performance. It is also available for immediate download and adjustment. So, changes can be made in the color, design, graphics or any other component to create a unique layout.
KPI Dashboard For Tracking Marcom Mix Strategy Progress Ideas PDF
Following slide showcases marketing mix progress monitoring dashboard to determine business performance. It includes elements such as clicks, impressions, click through rate, conversion rate, cost per click and monthly overview to Google ads. Showcasing this set of slides titled KPI Dashboard For Tracking Marcom Mix Strategy Progress Ideas PDF. The topics addressed in these templates are Kpi Dashboard, Tracking Marcom, Mix Strategy Progress. All the content presented in this PPT design is completely editable. Download it and make adjustments in color, background, font etc. as per your unique business setting.
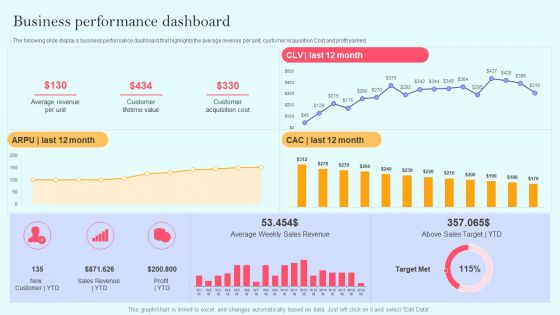
Recurring Income Generation Model Business Performance Dashboard Clipart PDF
The following slide display a business performance dashboard that highlights the average revenue per unit, customer Acquisition Cost and profit earned. Crafting an eye catching presentation has never been more straightforward. Let your presentation shine with this tasteful yet straightforward Recurring Income Generation Model Business Performance Dashboard Clipart PDF template. It offers a minimalistic and classy look that is great for making a statement. The colors have been employed intelligently to add a bit of playfulness while still remaining professional. Construct the ideal Recurring Income Generation Model Business Performance Dashboard Clipart PDF that effortlessly grabs the attention of your audience. Begin now and be certain to wow your customers.

Seed Funding Pitch Deck Dashboard Ppt Pictures Example PDF
This is a seed funding pitch deck dashboard ppt pictures example pdf template with various stages. Focus and dispense information on two stages using this creative set, that comes with editable features. It contains large content boxes to add your information on topics like roadmap to good infrastructure maturity. You can also showcase facts, figures, and other relevant content using this PPT layout. Grab it now.
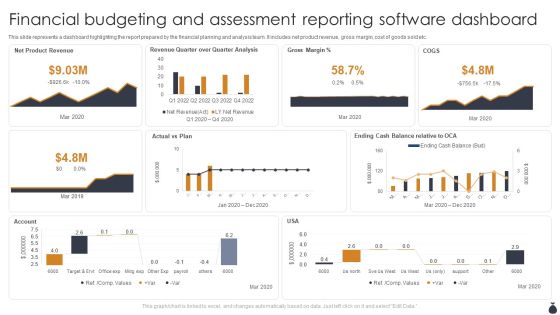
Financial Budgeting And Assessment Reporting Software Dashboard Template PDF
This slide represents a dashboard highlighting the report prepared by the financial planning and analysis team. It includes net product revenue, gross margin, cost of goods sold etc. Showcasing this set of slides titled Financial Budgeting And Assessment Reporting Software Dashboard Template PDF. The topics addressed in these templates are Net Product Revenue, Actual Vs Plan, Account. All the content presented in this PPT design is completely editable. Download it and make adjustments in color, background, font etc. as per your unique business setting.

Prospective Buyer Retention Dashboard With Key Performance Indicators Themes PDF
This slide shows the dashboard representing the key performance metrics for retention of potential customers of the organization. It shows no. of active users, churn rate, cost of customer acquisition, their life time value, monthly recurring revenue etc.Pitch your topic with ease and precision using this Prospective Buyer Retention Dashboard With Key Performance Indicators Themes PDF. This layout presents information on Recurring Revenue, Revenue Growth, Customer Acquisition. It is also available for immediate download and adjustment. So, changes can be made in the color, design, graphics or any other component to create a unique layout.
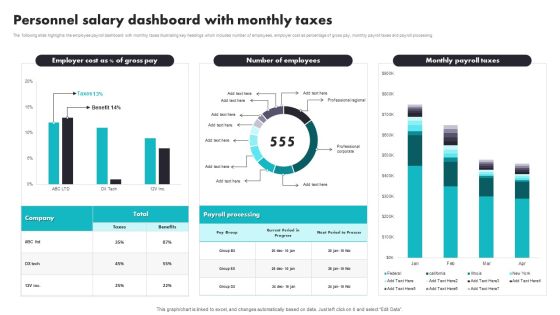
Personnel Salary Dashboard With Monthly Taxes Introduction PDF
The following slide highlights the employee payroll dashboard with monthly taxes illustrating key headings which includes number of employees, employer cost as percentage of gross pay, monthly payroll taxes and payroll processing. Pitch your topic with ease and precision using this Personnel Salary Dashboard With Monthly Taxes Introduction PDF. This layout presents information on Payroll Processing, Benefits. It is also available for immediate download and adjustment. So, changes can be made in the color, design, graphics or any other component to create a unique layout.

Stock Requirement Plan Dashboard With Financial Overview Formats PDF
The following slide highlights the material requirement planning dashboard with financial overview. It depicts project details, project requirement, cost progress, hours progress, material planning, late orders and planning expectations. Showcasing this set of slides titled Stock Requirement Plan Dashboard With Financial Overview Formats PDF. The topics addressed in these templates are Project Requirement, Planning Expectations, Project Details. All the content presented in this PPT design is completely editable. Download it and make adjustments in color, background, font etc. as per your unique business setting.

Digital Marketing KPI Dashboard With Engagement Rate Background PDF
The following slide showcases a comprehensive KPI dashboard which allows the company to track the digital marketing performance. Total visits, cost per click, engagement rate, total impressions, product sales trend, revenue by various channels are some of the key metrics mentioned in the slide. Showcasing this set of slides titled Digital Marketing KPI Dashboard With Engagement Rate Background PDF. The topics addressed in these templates are Demographics, Revenue, Sales. All the content presented in this PPT design is completely editable. Download it and make adjustments in color, background, font etc. as per your unique business setting.

Freelance Content Marketing Performance Metrics Dashboard Elements PDF
The following slide highlights the freelance content marketing performance metrics dashboard. It depicts content visitor and number of leads for last 24 hours, cost per click, number of content visitor, daily content visitor, lead generation source, top converting landing pages, top converting marketing channels and return on investment. Showcasing this set of slides titled Freelance Content Marketing Performance Metrics Dashboard Elements PDF. The topics addressed in these templates are Lead Generation Source, Return On Investment, Converting Marketing Channels. All the content presented in this PPT design is completely editable. Download it and make adjustments in color, background, font etc. as per your unique business setting.

Dashboard To Track Organizational Managing Business Cash Position Mockup PDF
This slide depicts a dashboard to track organizational cash flow management position and analyse the trends of cash flows. The key elements are revenue, cost of goods sold, operating expenses, capital expenses and cash flow from activities. Showcasing this set of slides titled Dashboard To Track Organizational Managing Business Cash Position Mockup PDF. The topics addressed in these templates are Revenue, Working Capital, Free Cash Flow. All the content presented in this PPT design is completely editable. Download it and make adjustments in color, background, font etc. as per your unique business setting.

Healthcare Strategic Marketing Analysis And Planning Kpi Dashboard Elements PDF
The following dashboard depicts the application of marketing intelligence in the field of healthcare, which will be used by clinical laboratories, hospitals and private institutions to track the effectiveness of marketing campaigns. Key performance indicators are total convergence, cost per conversion, referral form filled by patients, patient request etc. Showcasing this set of slides titled Healthcare Strategic Marketing Analysis And Planning Kpi Dashboard Elements PDF. The topics addressed in these templates are Quarterly Conversion Breakdown, Annual Conversion Breakdown, Patient Request. All the content presented in this PPT design is completely editable. Download it and make adjustments in color, background, font etc. as per your unique business setting.
Financial Procedure Dashboard Indicating Yearly Revenue Analysis Icons PDF
This slide illustrates finance process dashboard indicating yearly revenue analysis which contains gross profit margin, operating profit ratio, net profit, revenue and cost of goods sold cogs operating expenses, etc. It can be referred by company owners who can compare it with previous years performance and make related decisions for future. Showcasing this set of slides titled Financial Procedure Dashboard Indicating Yearly Revenue Analysis Icons PDF. The topics addressed in these templates are Operating Profit Percentage, Net Profit Percentage, Operating Profit Ratio. All the content presented in this PPT design is completely editable. Download it and make adjustments in color, background, font etc. as per your unique business setting.

 Home
Home