Cost Comparison

Price Components Affected By Internal Environment Demonstration PDF
The following slide highlights the following price components affected by internal environment illustrating key headings which includes price component, details, value and impact. Where price component depicts cost, marketing strategy, marketing objective, product lifecycle and company image. Pitch your topic with ease and precision using this Price Components Affected By Internal Environment Demonstration PDF. This layout presents information on Marketing Objective, Marketing Strategy, Cost. It is also available for immediate download and adjustment. So, changes can be made in the color, design, graphics or any other component to create a unique layout.

Application Development Best Practice Tools And Templates Software Technology Competitors Icons PDF
This slide evaluates the software technology in a competitors analysis based on different features such as cost, license agreement, feature set, maturity, extensibility, ease of use, etc. Deliver an awe inspiring pitch with this creative application development best practice tools and templates software technology competitors icons pdf bundle. Topics like cost, license agreement, feature set, maturity, extensibility, ease of use can be discussed with this completely editable template. It is available for immediate download depending on the needs and requirements of the user.

Comparative Analysis Of Manual And Automated BPT Framework Portrait PDF
The following slide highlights the comparative analysis of manual and automated business process testing. It showcases parameters, manual testing and automated testing, where parameters includes testing accuracy, process efficiency, business productivity, testing burden, testing cost, redundant script utilization rate and maintenance rate. Presenting Comparative Analysis Of Manual And Automated BPT Framework Portrait PDF to dispense important information. This template comprises three stages. It also presents valuable insights into the topics including Business Productivity, Process Efficiency, Testing Cost. This is a completely customizable PowerPoint theme that can be put to use immediately. So, download it and address the topic impactfully.

Campaigns Done Ppt PowerPoint Presentation Visual Aids Icon
This is a campaigns done ppt powerpoint presentation visual aids icon. This is a four stage process. The stages in this process are daily budget, max pub cost, max of budget, margin .
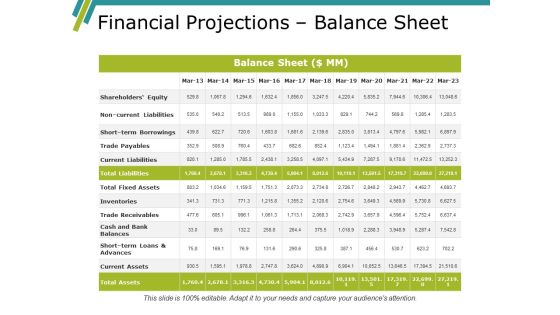
Financial Projections Balance Sheet Ppt PowerPoint Presentation Ideas Slide Portrait
This is a financial projections balance sheet ppt powerpoint presentation ideas slide portrait. This is a three stage process. The stages in this process are balance sheet, total assets, cost, planning, management.
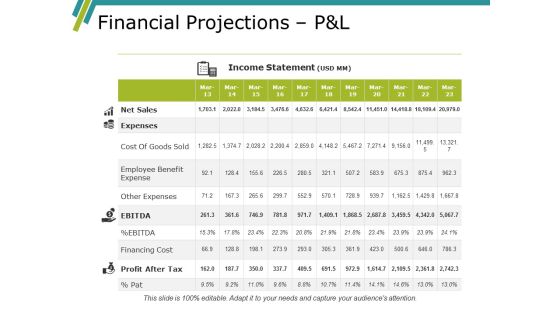
Financial Projections Pandl Ppt PowerPoint Presentation Outline Objects
This is a financial projections pandl ppt powerpoint presentation outline objects. This is a eleven stage process. The stages in this process are balance sheet, total assets, cost, planning, management.
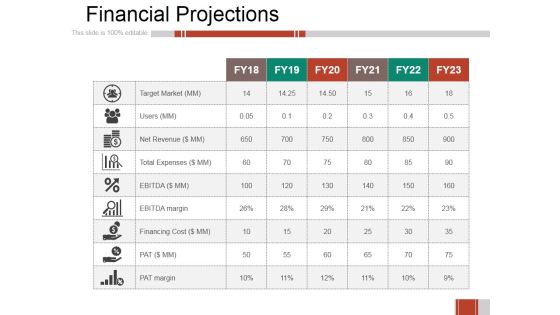
Financial Projections Ppt PowerPoint Presentation Styles Microsoft
This is a financial projections ppt powerpoint presentation styles microsoft. This is a six stage process. The stages in this process are target market, users, net revenue, total expenses, financing cost.

Project Conclusion Report Deadline Milestones Ppt PowerPoint Presentation Outline Guidelines
This is a project conclusion report deadline milestones ppt powerpoint presentation outline guidelines. This is a four stage process. The stages in this process are staff costs, material, travel expenses, advertising expenses, hardware.

Building Brand Preference Ppt PowerPoint Presentation Outline File Formats
This is a building brand preference ppt powerpoint presentation outline file formats. This is a five stage process. The stages in this process are factors, acquisition cost, advertisement, social media presence, sponsor public events.

Building Brand Preference Ppt PowerPoint Presentation Professional Diagrams
This is a building brand preference ppt powerpoint presentation professional diagrams. This is a five stage process. The stages in this process are acquisition cost, advertisement, social media presence, sponsor public events, freebies.

Building Brand Preference Ppt PowerPoint Presentation Icon Layout Ideas
This is a building brand preference ppt powerpoint presentation icon layout ideas. This is a three stage process. The stages in this process are acquisition cost, advertisement, social media presence, sponsor public events, freebies.
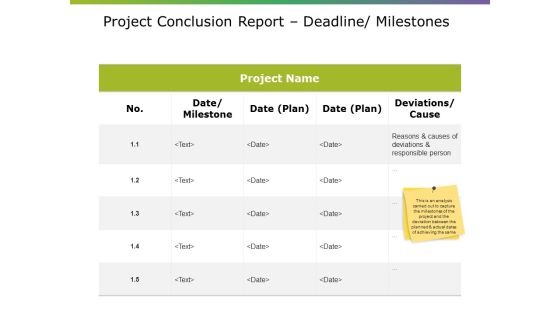
Project Conclusion Report Deadline Milestones Ppt PowerPoint Presentation Pictures Layouts
This is a project conclusion report deadline milestones ppt powerpoint presentation pictures layouts. This is a five stage process. The stages in this process are project name, table, cost, data, management.

Project Conclusion Report Open Issues Ppt PowerPoint Presentation Background Designs
This is a project conclusion report open issues ppt powerpoint presentation background designs. This is a three stage process. The stages in this process are project name, table, cost, data, management.

Project Progress Summary Ppt PowerPoint Presentation Portfolio Backgrounds
This is a project progress summary ppt powerpoint presentation portfolio backgrounds. This is a three stage process. The stages in this process are project name, table, cost, data, management.
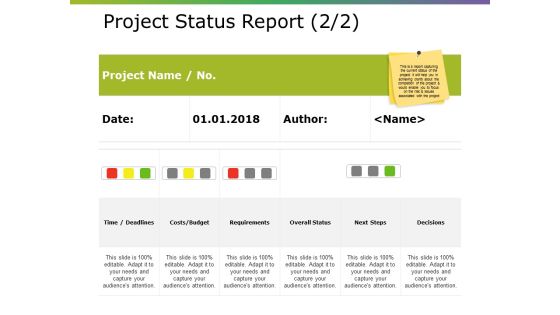
Project Status Report Template Ppt PowerPoint Presentation Layouts Background
This is a project status report template ppt powerpoint presentation layouts background. This is a four stage process. The stages in this process are project name, table, cost, data, management.
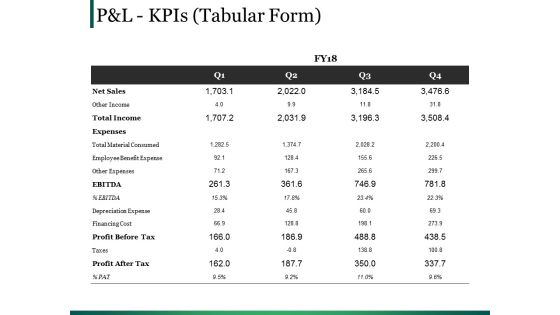
Pandl Kpis Template 1 Ppt PowerPoint Presentation Infographics Tips
This is a pandl kpis template 1 ppt powerpoint presentation infographics tips. This is a four stage process. The stages in this process are ebitda, total income, table, cost, management.

Project Conclusion Report Deadline Milestones Ppt PowerPoint Presentation Inspiration
This is a project conclusion report deadline milestones ppt powerpoint presentation inspiration. This is a four stage process. The stages in this process are cost, planning, table, project report, data management.
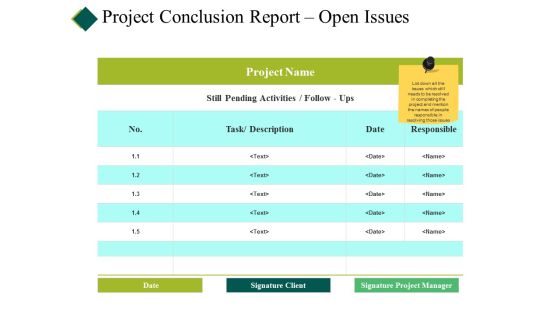
Project Conclusion Report Open Issues Ppt PowerPoint Presentation Show Summary
This is a project conclusion report open issues ppt powerpoint presentation show summary. This is a four stage process. The stages in this process are cost, planning, table, project report, data management.

Project Progress Summary Ppt PowerPoint Presentation Inspiration Styles
This is a project progress summary ppt powerpoint presentation inspiration styles. This is a three stage process. The stages in this process are cost, planning, table, project report, data management.
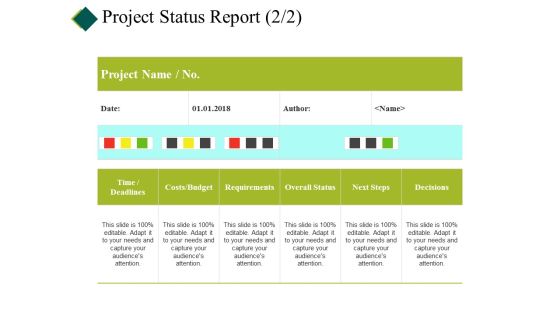
Project Status Report Template Ppt PowerPoint Presentation Infographics Ideas
This is a project status report template ppt powerpoint presentation infographics ideas. This is a five stage process. The stages in this process are cost, planning, table, project report, data management.

Project Status Report Ppt PowerPoint Presentation Infographics Designs Download
This is a project status report ppt powerpoint presentation infographics designs download. This is a four stage process. The stages in this process are cost, planning, table, project report, data management.
Project Timeline Ppt PowerPoint Presentation Icon Graphics Design
This is a project timeline ppt powerpoint presentation icon graphics design. This is a six stage process. The stages in this process are cost, planning, table, project report, data management.
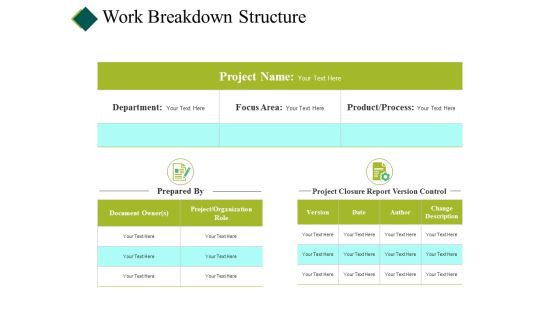
Work Breakdown Structure Ppt PowerPoint Presentation Show Example File
This is a work breakdown structure ppt powerpoint presentation show example file. This is a three stage process. The stages in this process are cost, planning, table, project report, data management.
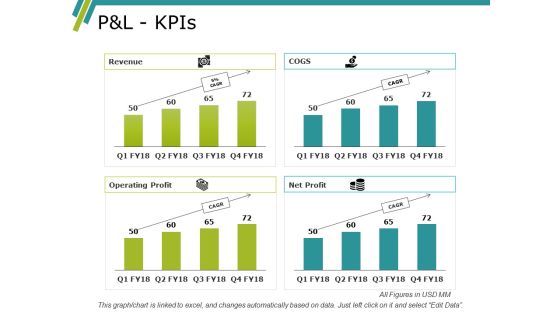
Pandl Kpis Ppt PowerPoint Presentation Slides Designs Download
This is a pandl kpis ppt powerpoint presentation slides designs download. This is a four stage process. The stages in this process are net sales, table, planning, cost, management.

Key Technologies Where Bank Require Digital Transformation Develop Organizational Productivity Enhancing Business Process Introduction PDF
The slide shows the key technologies mobile bank technology, blockchain, AI technology etc. for digital transformation in the company, along with the strategic details and estimated cost. Deliver an awe inspiring pitch with this creative key technologies where bank require digital transformation develop organizational productivity enhancing business process introduction pdf bundle. Topics like technology, strategy, costs, efficiency, process can be discussed with this completely editable template. It is available for immediate download depending on the needs and requirements of the user.
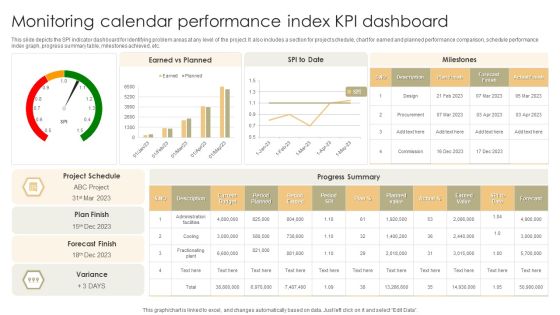
Monitoring Calendar Performance Index KPI Dashboard Slides PDF
This slide depicts the SPI indicator dashboard for identifying problem areas at any level of the project. It also includes a section for project schedule, chart for earned and planned performance comparison, schedule performance index graph, progress summary table, milestones achieved, etc. Pitch your topic with ease and precision using this Monitoring Calendar Performance Index KPI Dashboard Slides PDF. This layout presents information on Current Budget, Planned Value, Earned Value. It is also available for immediate download and adjustment. So, changes can be made in the color, design, graphics or any other component to create a unique layout.
Online Shopping Survey Outcome In Percentage Icons PDF
The slide showcases percentage results to analyze experience of online shopping to identify areas for enhancing shopping experience. It includes key elements such as reasons for online shopping, elements considered by customers and shopping platforms. Pitch your topic with ease and precision using this Online Shopping Survey Outcome In Percentage Icons PDF. This layout presents information on Price Comparison, Product Information, Online Reviews. It is also available for immediate download and adjustment. So, changes can be made in the color, design, graphics or any other component to create a unique layout.

Dual Branding Campaign To Boost Sales Of Product Or Services Dashboard For Dual Branding Campaign Performance Infographics PDF
This slide showcases dashboard that can help organization to measure performance after launching dual branding campaign. Its key components are sales comparison, revenue by client, revenue by source and new customers by source. The best PPT templates are a great way to save time, energy, and resources. Slidegeeks have 100 percent editable powerpoint slides making them incredibly versatile. With these quality presentation templates, you can create a captivating and memorable presentation by combining visually appealing slides and effectively communicating your message. Download Dual Branding Campaign To Boost Sales Of Product Or Services Dashboard For Dual Branding Campaign Performance Infographics PDF from Slidegeeks and deliver a wonderful presentation.

Patient Health And Risk Key Performance Indicator Dashboard Ppt Infographic Template Summary PDF
The following slide highlights the patient health and safety key performance indicator dashboard illustrating admission by department, admission by cost, patient satisfaction, total patients, operations cost, patient density, total staff, waiting time, treatment satisfaction and treatment confidence. Pitch your topic with ease and precision using this Patient Health And Risk Key Performance Indicator Dashboard Ppt Infographic Template Summary PDF. This layout presents information on Admission By Department, Admission Vs Cost, Patient Satisfaction. It is also available for immediate download and adjustment. So, changes can be made in the color, design, graphics or any other component to create a unique layout.

Personnel Management Dashboard With Salary And Overtime Data Ideas PDF
The following slide highlights the payroll management dashboard with salary and overtime data illustrating key headings which includes employee cost, average salary, overtime per day, Average base salary and average overtime cost. Pitch your topic with ease and precision using this Personnel Management Dashboard With Salary And Overtime Data Ideas PDF. This layout presents information on Average, Customer Service, Cost. It is also available for immediate download and adjustment. So, changes can be made in the color, design, graphics or any other component to create a unique layout.
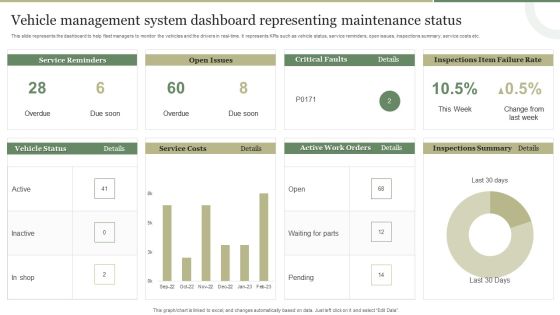
Vehicle Management System Dashboard Representing Maintenance Status Template PDF
This slide represents the dashboard representing the key metrics of the vehicle management system to monitor the vehicles and drivers in real-time. It includes key metrics such as service reminders, fuel costs, open issues, recent comments etc. Pitch your topic with ease and precision using this Vehicle Management System Dashboard Representing Maintenance Status Template PDF This layout presents information on Fuel Costs, Total Cost, Service Reminder, Recent Comments. It is also available for immediate download and adjustment. So, changes can be made in the color, design, graphics or any other component to create a unique layout.

New Market Entry Tactics Comparative Assessment Themes PDF
Following slide demonstrates comparative analysis between various marketing strategies to determine best strategy for business expansion. It includes key components such as market entry strategy, entry location, entry cost, manager, marketing strategy and level of risk. Pitch your topic with ease and precision using this New Market Entry Tactics Comparative Assessment Themes PDF. This layout presents information on Manager, Cost, Location, Marketing Strategy. It is also available for immediate download and adjustment. So, changes can be made in the color, design, graphics or any other component to create a unique layout.

Comparative Analysis Of Applications Of Artificial Intelligence AI Platforms Ideas PDF
This slide showcases comparative assessment of AI platforms. It provides information about ease of use, features, integration, performance, business intelligence, e-commerce support, cloud migration, customer data management, etc. Showcasing this set of slides titled Comparative Analysis Of Applications Of Artificial Intelligence AI Platforms Ideas PDF. The topics addressed in these templates are User Rating Comparison, Features And Functionality, Business Intelligence. All the content presented in this PPT design is completely editable. Download it and make adjustments in color, background, font etc. as per your unique business setting.

Competitive Content Marketing Assessment Plan Template PDF
This slide represents competitor content marketing analysis plan. It includes channels, quantity, frequency, quality, owner and cost. Showcasing this set of slides titled Competitive Content Marketing Assessment Plan Template PDF. The topics addressed in these templates are Quantity, Cost, Owner. All the content presented in this PPT design is completely editable. Download it and make adjustments in color, background, font etc. as per your unique business setting.

Competitive Analysis Products Feature Ppt Pictures Visuals PDF
The The slide provides the Competitive landscape of the company on the basis of products features i.e. online availability, cost, customers, criteria etc.Deliver an awe inspiring pitch with this creative competitive analysis products feature ppt pictures visuals pdf. bundle. Topics like online product, interest rate less than, online product can be discussed with this completely editable template. It is available for immediate download depending on the needs and requirements of the user.

Competitive Analysis Products Feature Ppt Ideas Design Ideas PDF
The slide provides the Competitive landscape of the company on the basis of products features i.e. online availability, cost, customers, criteria etc.Deliver an awe-inspiring pitch with this creative competitive analysis products feature ppt ideas design ideas pdf. bundle. Topics like online product, interest rate less than, online product can be discussed with this completely editable template. It is available for immediate download depending on the needs and requirements of the user.

Competitive Analysis Products Feature Ppt Infographic Template Graphics Download PDF
The slide provides the Competitive landscape of the company on the basis of products features i.e. online availability, cost, customers, criteria etc.Deliver and pitch your topic in the best possible manner with this competitive analysis products feature ppt infographic template graphics download pdf. Use them to share invaluable insights on online product, serves in rural and remote areas and impress your audience. This template can be altered and modified as per your expectations. So, grab it now.

Competitive Analysis Products Feature Ppt Gallery Icons PDF
The slide provides the Competitive landscape of the company on the basis of products features i.e. online availability, cost, customers, criteria etc.Deliver an awe-inspiring pitch with this creative competitive analysis products feature ppt gallery icons pdf. bundle. Topics like online product, serves in rural and remote areas can be discussed with this completely editable template. It is available for immediate download depending on the needs and requirements of the user.
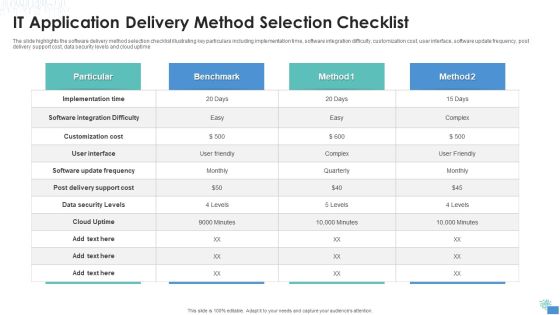
IT Application Delivery Method Selection Checklist Themes PDF
The slide highlights the software delivery method selection checklist illustrating key particulars including implementation time, software integration difficulty, customization cost, user interface, software update frequency, post delivery support cost, data security levels and cloud uptime.Pitch your topic with ease and precision using this IT Application Delivery Method Selection Checklist Themes PDF This layout presents information on Implementation Time, Customization Cost, Software Integration It is also available for immediate download and adjustment. So, changes can be made in the color, design, graphics or any other component to create a unique layout.

Quarterly Sales Employee Representative Performance Assessment Scorecard For Service Business Professional PDF
This slide provides insights about quarterly sales performance assessment matrix which can be used by business to forecast organisation future profitability. It includes elements such as revenue, sales amount, units sold, production cost, profits and profit percentage to sales. Pitch your topic with ease and precision using this Quarterly Sales Employee Representative Performance Assessment Scorecard For Service Business Professional PDF. This layout presents information on Revenue, Sales Amount, Units Sold, Production Cost, Cost, Profits, Profit Percentage To Sales. It is also available for immediate download and adjustment. So, changes can be made in the color, design, graphics or any other component to create a unique layout.
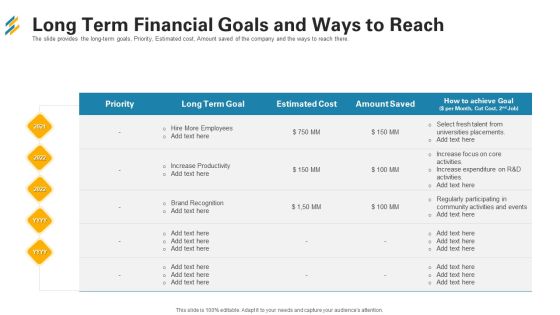
Long Term Financial Goals And Ways To Reach Ppt Gallery Example PDF
The slide provides the long-term goals, Priority, Estimated cost, Amount saved of the company and the ways to reach there. Deliver an awe inspiring pitch with this creative long term financial goals and ways to reach ppt gallery example pdf bundle. Topics like estimated cost, employees, priority can be discussed with this completely editable template. It is available for immediate download depending on the needs and requirements of the user.

Supply Chain Solutions Business Outline Distribution Centres Attributes And Drivers Designs PDF
This slide highlights the attributers and driver for logistics company to choose appropriate location for distribution centers which includes cost, footprint, facility, connectivity and technology. Deliver and pitch your topic in the best possible manner with this Supply Chain Solutions Business Outline Distribution Centres Attributes And Drivers Designs PDF. Use them to share invaluable insights on Cost, Accessibility, Technology and impress your audience. This template can be altered and modified as per your expectations. So, grab it now.

Improving Brand Recognition With Message And Differentiation Strategy Product Value Statement Background PDF
Purpose of the following slide is to show the product value statement , the following slide highlights the functional value, emotional value, economic value and symbolic value of the product. Presenting improving brand recognition with message and differentiation strategy product value statement background pdf to provide visual cues and insights. Share and navigate important information on five stages that need your due attention. This template can be used to pitch topics like value, proposition, comparison, signifies, economic . In addtion, this PPT design contains high resolution images, graphics, etc, that are easily editable and available for immediate download.

Acquisition Firm Business Outline Procurement Tender Evaluation Process Flow Icons PDF
This slide provides the details of the procurement evaluation process which covers the following steps such as comparing supplier prices and costs, capabilities fulfilment, product quality assess, etc. This is a acquisition firm business outline procurement tender evaluation process flow icons pdf template with various stages. Focus and dispense information on nine stages using this creative set, that comes with editable features. It contains large content boxes to add your information on topics like prices and costs, service, capabilities, supplier audit, evaluate costs. You can also showcase facts, figures, and other relevant content using this PPT layout. Grab it now.

Agile Certificate Coaching Company Certifications Certified Scrum Master CSM Guidelines PDF
This slide provides information regarding scrum certification for Certified Scrum Master with details about career path, prerequisites, average salary, training cost, etc. This is a agile certificate coaching company certifications certified scrum master csm guidelines pdf template with various stages. Focus and dispense information on eight stages using this creative set, that comes with editable features. It contains large content boxes to add your information on topics like training cost, career path, description, prerequisites, renewal cost. You can also showcase facts, figures, and other relevant content using this PPT layout. Grab it now.

Circle Chart With Increasing Percentage Values PowerPoint Slides
Circle Chart with Increasing Percentage Values power point Slides: - Show your achievements and targets with the ideal background. Above is the diagram to display how your business has been growing or your achievements. The slide is of the three circles having water at different levels in them. Therefore it becomes easy to show that in the first circle, the growth is at this much percent, then the second one and in the last circle, completed 85% of the targets. This PowerPoint template is easy to use to show the progress, and comparisons. All icons are editable. Choose them as per your need.
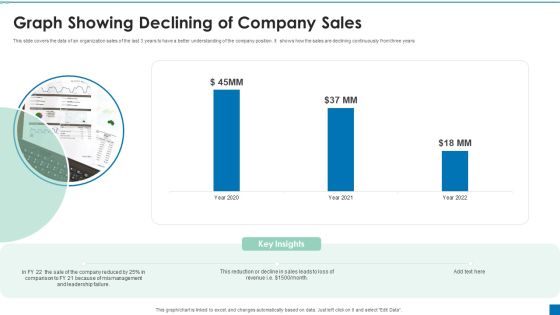
Graph Showing Declining Of Company Sales Ppt PowerPoint Presentation Portfolio Graphics Example PDF
This slide covers the data of an organization sales of the last 3 years to have a better understanding of the company position. It shows how the sales are declining continuously from three years.Pitch your topic with ease and precision using this Graph Showing Declining Of Company Sales Ppt PowerPoint Presentation Portfolio Graphics Example PDF. This layout presents information on Reduction Decline, Comparison, Mismanagement. It is also available for immediate download and adjustment. So, changes can be made in the color, design, graphics or any other component to create a unique layout.

Monthly Budget For Inbound And Outbound Marketing Activities Infographics PDF
The following slide displays a budget sheet which can be used by companies to plan inbound and outbound marketing activities cost. The template provides information about content, video, social media marketing, trade shows, telemarketing, print advertisement monthly cost. Presenting Monthly Budget For Inbound And Outbound Marketing Activities Infographics PDF to dispense important information. This template comprises two stages. It also presents valuable insights into the topics including Content Marketing, Telemarketing, Social Media Marketing. This is a completely customizable PowerPoint theme that can be put to use immediately. So, download it and address the topic impactfully.

6 Year Revenue Declining Graph Ppt PowerPoint Presentation Outline Sample PDF
This slide shows the revenues of the company over the last years to have a clear idea of organization growth and financial status . It includes the 6 year 2017 to 2022 revenue earned by the company.Showcasing this set of slides titled 6 Year Revenue Declining Graph Ppt PowerPoint Presentation Outline Sample PDF. The topics addressed in these templates are Revenue Company, Highest Comparison, Conditions Restrictions. All the content presented in this PPT design is completely editable. Download it and make adjustments in color, background, font etc. as per your unique business setting.

Shareholder Governance Enhance Comprehensive Corporate Performance Shareholder Information Dividend Introduction PDF
This slide shows the shareholder information of the company that provides information on shareholding sizes and geographical concentration. Also, this slide provides information on the dividend criteria of the company. Deliver and pitch your topic in the best possible manner with this shareholder governance enhance comprehensive corporate performance shareholder information dividend introduction pdf. Use them to share invaluable insights on shareholding, concentration, comparison, payment, progressive and impress your audience. This template can be altered and modified as per your expectations. So, grab it now.
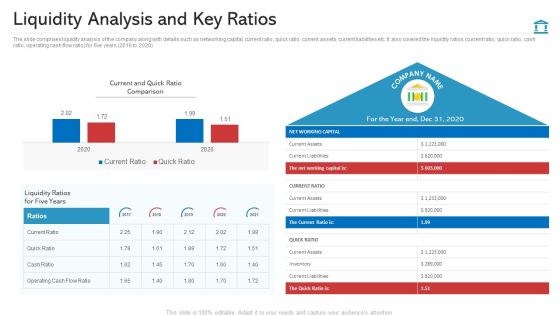
Liquidity Analysis And Key Ratios Structure PDF
The slide comprises liquidity analysis of the company along with details such as networking capital, current ratio, quick ratio, current assets, current liabilities etc. It also covered the liquidity ratios current ratio, quick ratio, cash ratio, operating cash flow ratio for five years 2016 to 2020 Deliver and pitch your topic in the best possible manner with this liquidity analysis and key ratios structure pdf. Use them to share invaluable insights on net working capital, current and quick ratio comparison, current liabilities and impress your audience. This template can be altered and modified as per your expectations. So, grab it now.

Comparative Analysis Of Debt Recovery Agency Portrait PDF
This slide showcases comparative analysis of various debt collection service providers and agencies which can be referred by creditors who want to realize and collect their pending payments. It includes information about ranking, agency, rating, best for, hidden costs, online portal dashboard, credit analysis and pricing.Pitch your topic with ease and precision using this Comparative Analysis Of Debt Recovery Agency Portrait PDF This layout presents information on Corporate Companies, Businesses Or Individuals, Credit Analysis It is also available for immediate download and adjustment. So, changes can be made in the color, design, graphics or any other component to create a unique layout.

Construction Sector Project Risk Management Effect Of Project Safety Management On Companies Information PDF
This slide covers the benefits of safety management to the firm such as Zero Legacy Costs, Maintain budget controls, Quality assurance, Offsets production losses etc. Deliver an awe inspiring pitch with this creative construction sector project risk management effect of project safety management on companies information pdf bundle. Topics like cost, maintain, budget, administration can be discussed with this completely editable template. It is available for immediate download depending on the needs and requirements of the user.
Sales Performance Monthly Strategy Dashboard Icons PDF
Below slide showcases the monthly dashboard of sales performance . Company can measure and evaluate their monthly sales performance using key factors that are sales comparison, monthly sales, planned vs actual sales and gross margin by Pitch your topic with ease and precision using this sales performance monthly strategy dashboard icons pdf. This layout presents information on sales performance monthly strategy dashboard. It is also available for immediate download and adjustment. So, changes can be made in the color, design, graphics or any other component to create a unique layout.
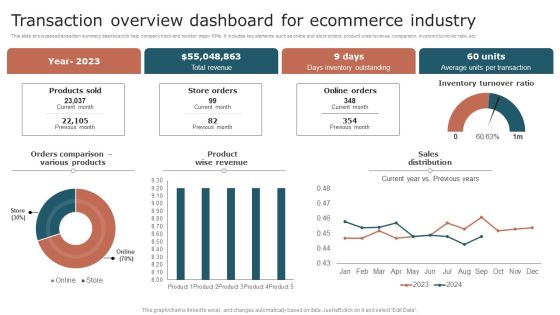
Transaction Overview Dashboard For Ecommerce Industry Summary PDF
This slide showcases transaction summary dashboard to help company track and monitor major KPIs. It includes key elements such as online and store orders, product wise revenue, comparison, inventory turnover ratio, etc. Pitch your topic with ease and precision using this Transaction Overview Dashboard For Ecommerce Industry Summary PDF. This layout presents information on Revenue, Inventory Outstanding, Transaction. It is also available for immediate download and adjustment. So, changes can be made in the color, design, graphics or any other component to create a unique layout.
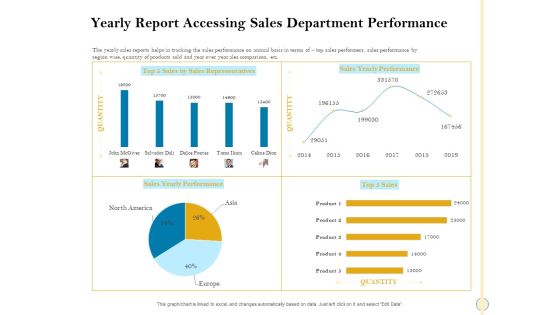
Sales Optimization Best Practices To Close More Deals Yearly Report Accessing Sales Department Performance Download PDF
The yearly sales reports helps in tracking the sales performance on annual basis in terms of top sales performers, sales performance by region wise, quantity of products sold and year over year ales comparison, etc. Deliver an awe inspiring pitch with this creative sales optimization best practices to close more deals yearly report accessing sales department performance download pdf bundle. Topics like yearly report accessing sales department performance can be discussed with this completely editable template. It is available for immediate download depending on the needs and requirements of the user.

Sales Assistance Boost Overall Efficiency Yearly Report Accessing Sales Department Performance Rules PDF
The yearly sales reports helps in tracking the sales performance on annual basis in terms of top sales performers, sales performance by region wise, quantity of products sold and year over year ales comparison, etc. Deliver an awe-inspiring pitch with this creative sales assistance boost overall efficiency yearly report accessing sales department performance rules pdf bundle. Topics like yearly report accessing sales department performance can be discussed with this completely editable template. It is available for immediate download depending on the needs and requirements of the user.
Performance Analysis Of New Product Development Product Performance Dashboards Icons PDF
The following slide displays the dashboard which highlights the performance of the product, multiple metrics such as Revenues, New customer, gross profit, customer satisfaction and global sales breakdown. Deliver and pitch your topic in the best possible manner with this performance analysis of new product development product performance dashboards icons pdf. Use them to share invaluable insights on revenue, sales comparison, customer satisfaction, gross profit, new customers, sale by product category and impress your audience. This template can be altered and modified as per your expectations. So, grab it now.
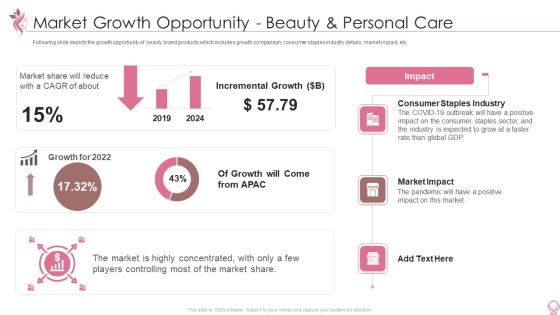
Cosmetics And Personal Care Venture Startup Market Growth Opportunity Beauty And Personal Care Download PDF Brochure PDF
Following slide depicts the growth opportunity of beauty brand products which includes growth comparison, consumer staples industry details, market impact, etc. Deliver and pitch your topic in the best possible manner with this cosmetics and personal care venture startup market growth opportunity beauty and personal care download pdf brochure pdf. Use them to share invaluable insights on market share, growth for 2022, consumer staples industry, market impact, incremental growth and impress your audience. This template can be altered and modified as per your expectations. So, grab it now.
Developing Significant Business Product And Customer Performance Tracking Clipart PDF
This slide provides information regarding dashboard utilized by firm to monitor performance of products offered and customer associated. The performance is tracked through revenues generated, new customer acquired, customer satisfaction, sales comparison, etc. Deliver and pitch your topic in the best possible manner with this Developing Significant Business Product And Customer Performance Tracking Clipart PDF. Use them to share invaluable insights on Revenue, New Customer, Revenue and impress your audience. This template can be altered and modified as per your expectations. So, grab it now.
 Home
Home