Cost Comparison

Business Services Icon With Pie Graph And Dollar Sign Ppt Styles Good PDF
Pitch your topic with ease and precision using this business services icon with pie graph and dollar sign ppt styles good pdf. This layout presents information on business services icon with pie graph and dollar sign. It is also available for immediate download and adjustment. So, changes can be made in the color, design, graphics or any other component to create a unique layout.

Environmental Problems Chart Showing Contribution Towards Global Pollution Elements PDF
Pitch your topic with ease and precision using this environmental problems chart showing contribution towards global pollution elements pdf. This layout presents information on environmental problems chart showing contribution towards global pollution. It is also available for immediate download and adjustment. So, changes can be made in the color, design, graphics or any other component to create a unique layout.

Graph Showing Key Insights Of Environmental Problems Structure PDF
Pitch your topic with ease and precision using this graph showing key insights of environmental problems structure pdf. This layout presents information on graph showing key insights of environmental problems. It is also available for immediate download and adjustment. So, changes can be made in the color, design, graphics or any other component to create a unique layout.
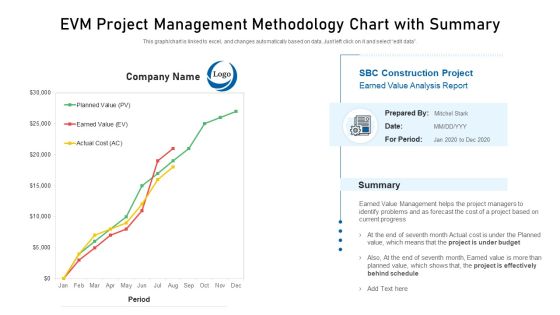
EVM Project Management Methodology Chart With Summary Clipart PDF
Pitch your topic with ease and precision using this evm project management methodology chart with summary clipart pdf. This layout presents information on project based, value management, forecast. It is also available for immediate download and adjustment. So, changes can be made in the color, design, graphics or any other component to create a unique layout.

Business Target Accomplishment Growth Report Ppt Visual Aids Summary PDF
Pitch your topic with ease and precision using this business target accomplishment growth report ppt visual aids summary pdf. This layout presents information on business target accomplishment growth report. It is also available for immediate download and adjustment. So, changes can be made in the color, design, graphics or any other component to create a unique layout.

Business Target With Monthly Promotion Plan Growth Report Ppt Pictures Good PDF
Pitch your topic with ease and precision using this business target with monthly promotion plan growth report ppt pictures good pdf. This layout presents information on business target with monthly promotion plan growth report. It is also available for immediate download and adjustment. So, changes can be made in the color, design, graphics or any other component to create a unique layout.

Business Chart For Retail Online Business Categories Ppt PowerPoint Presentation Infographics Diagrams PDF
Pitch your topic with ease and precision using this business chart for retail online business categories ppt powerpoint presentation infographics diagrams pdf. This layout presents information on business chart for retail online business categories. It is also available for immediate download and adjustment. So, changes can be made in the color, design, graphics or any other component to create a unique layout.

Chart Showing Market Share Percentage Of Financial Sector Ppt PowerPoint Presentation Show Guide PDF
Pitch your topic with ease and precision using this chart showing market share percentage of financial sector ppt powerpoint presentation show guide pdf. This layout presents information on chart showing market share percentage of financial sector. It is also available for immediate download and adjustment. So, changes can be made in the color, design, graphics or any other component to create a unique layout.

Company Industry Market Sales Volume Projection Chart Ppt PowerPoint Presentation Infographic Template Clipart PDF
Pitch your topic with ease and precision using this company industry market sales volume projection chart ppt powerpoint presentation infographic template clipart pdf. This layout presents information on company industry market sales volume projection chart. It is also available for immediate download and adjustment. So, changes can be made in the color, design, graphics or any other component to create a unique layout.
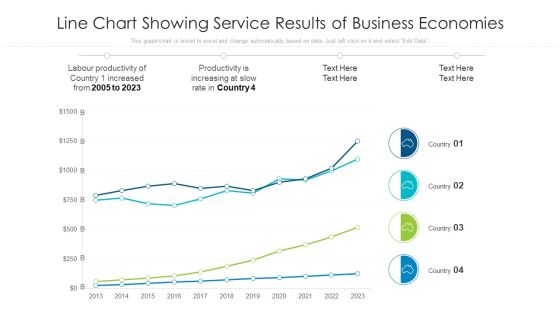
Line Chart Showing Service Results Of Business Economies Ppt PowerPoint Presentation Model Tips PDF
Pitch your topic with ease and precision using this line chart showing service results of business economies ppt powerpoint presentation model tips pdf. This layout presents information on line chart showing service results of business economies. It is also available for immediate download and adjustment. So, changes can be made in the color, design, graphics or any other component to create a unique layout.
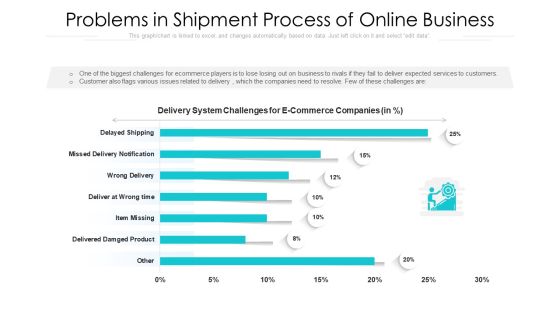
Problems In Shipment Process Of Online Business Ppt Professional Themes PDF
Pitch your topic with ease and precision using this problems in shipment process of online business ppt professional themes pdf. This layout presents information on problems in shipment process of online business. It is also available for immediate download and adjustment. So, changes can be made in the color, design, graphics or any other component to create a unique layout.
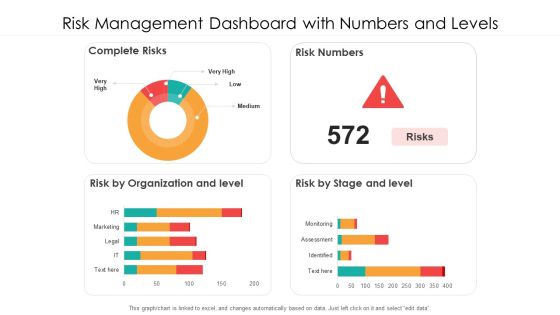
Risk Management Dashboard With Numbers And Levels Ppt PowerPoint Presentation Infographics Picture PDF
Pitch your topic with ease and precision using this risk management dashboard with numbers and levels ppt powerpoint presentation infographics picture pdf. This layout presents information on complete risks, risk numbers, risk by organization and level. It is also available for immediate download and adjustment. So, changes can be made in the color, design, graphics or any other component to create a unique layout.
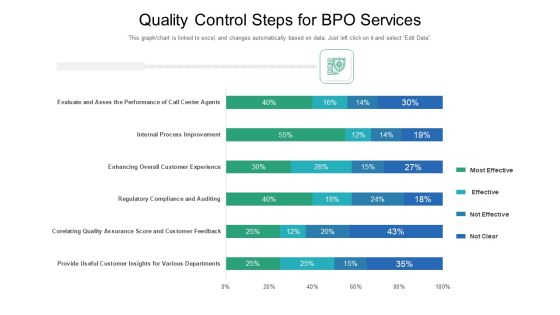
Quality Control Steps For BPO Services Ppt Infographic Template Maker PDF
Pitch your topic with ease and precision using this quality control steps for bpo services ppt infographic template maker pdf. This layout presents information on customer experience, process improvement, performance. It is also available for immediate download and adjustment. So, changes can be made in the color, design, graphics or any other component to create a unique layout.
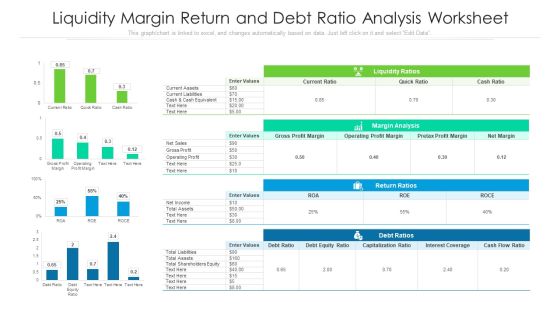
Liquidity Margin Return And Debt Ratio Analysis Worksheet Ppt PowerPoint Presentation File Design Ideas PDF
Pitch your topic with ease and precision using this liquidity margin return and debt ratio analysis worksheet ppt powerpoint presentation file design ideas pdf. This layout presents information on liquidity ratios, margin analysis, return ratios. It is also available for immediate download and adjustment. So, changes can be made in the color, design, graphics or any other component to create a unique layout.

Project Task Planning Dashboard With Status Ppt PowerPoint Presentation Gallery Visual Aids PDF
Pitch your topic with ease and precision using this project task planning dashboard with status ppt powerpoint presentation gallery visual aids pdf. This layout presents information on task creation vs completion, milestones covered, overall project. It is also available for immediate download and adjustment. So, changes can be made in the color, design, graphics or any other component to create a unique layout.

Key Skills Of Accounts Manager With Critical Thinking Ppt PowerPoint Presentation Model Vector PDF
Pitch your topic with ease and precision using this key skills of accounts manager with critical thinking ppt powerpoint presentation model vector pdf. This layout presents information on key skills of accounts manager with critical thinking. It is also available for immediate download and adjustment. So, changes can be made in the color, design, graphics or any other component to create a unique layout.

Chart Representing Consumer Review For Various Sources And Years Ppt Summary Background PDF
Pitch your topic with ease and precision using this chart representing consumer review for various sources and years ppt summary background pdf. This layout presents information on chart representing consumer review for various sources and years. It is also available for immediate download and adjustment. So, changes can be made in the color, design, graphics or any other component to create a unique layout.

Horizontal Bar Chart Representing Consumer Review On Three Scale Ppt Gallery Diagrams PDF
Pitch your topic with ease and precision using this horizontal bar chart representing consumer review on three scale ppt gallery diagrams pdf. This layout presents information on horizontal bar chart representing consumer review on three scale. It is also available for immediate download and adjustment. So, changes can be made in the color, design, graphics or any other component to create a unique layout.
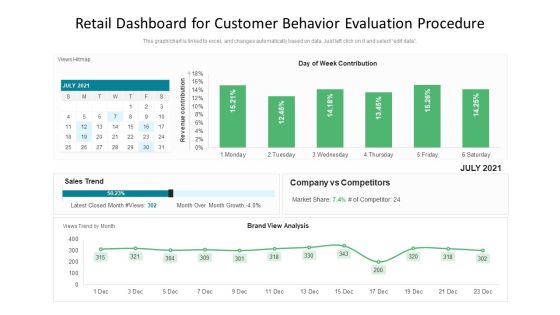
Retail Dashboard For Customer Behavior Evaluation Procedure Ppt Layouts Pictures PDF
Pitch your topic with ease and precision using this retail dashboard for customer behavior evaluation procedure ppt layouts pictures pdf. This layout presents information on retail dashboard for customer behavior evaluation procedure. It is also available for immediate download and adjustment. So, changes can be made in the color, design, graphics or any other component to create a unique layout.
Stock And Inventory Dashboard With Employee Hours Ppt PowerPoint Presentation File Icon PDF
Pitch your topic with ease and precision using this stock and inventory dashboard with employee hours ppt powerpoint presentation file icon pdf. This layout presents information on performance, employee, inventory value, inventory turnover. It is also available for immediate download and adjustment. So, changes can be made in the color, design, graphics or any other component to create a unique layout.
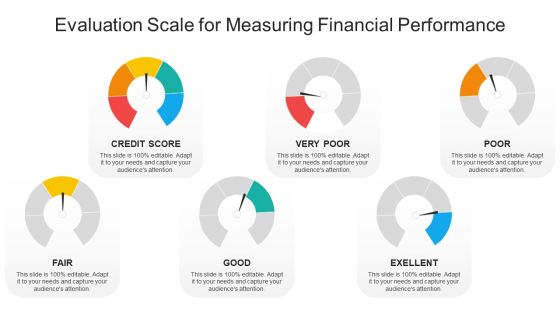
Evaluation Scale For Measuring Financial Performance Ppt PowerPoint Presentation File Professional PDF
Pitch your topic with ease and precision using this evaluation scale for measuring financial performance ppt powerpoint presentation file professional pdf. This layout presents information on evaluation scale for measuring financial performance. It is also available for immediate download and adjustment. So, changes can be made in the color, design, graphics or any other component to create a unique layout.

Business Annual Revenue Split Chart By Quarters Ppt PowerPoint Presentation Background Image PDF
Pitch your topic with ease and precision using this business annual revenue split chart by quarters ppt powerpoint presentation background image pdf. This layout presents information on business annual revenue split chart by quarters. It is also available for immediate download and adjustment. So, changes can be made in the color, design, graphics or any other component to create a unique layout.

Chart Showing Revenue Split By Customer Categories Ppt PowerPoint Presentation Show Smartart PDF
Pitch your topic with ease and precision using this chart showing revenue split by customer categories ppt powerpoint presentation show smartart pdf. This layout presents information on chart showing revenue split by customer categories. It is also available for immediate download and adjustment. So, changes can be made in the color, design, graphics or any other component to create a unique layout.

Industry Wise Revenue Split Of The Business Ppt PowerPoint Presentation Infographic Template Infographics PDF
Pitch your topic with ease and precision using this industry wise revenue split of the business ppt powerpoint presentation infographic template infographics pdf. This layout presents information on industry wise revenue split of the business. It is also available for immediate download and adjustment. So, changes can be made in the color, design, graphics or any other component to create a unique layout.
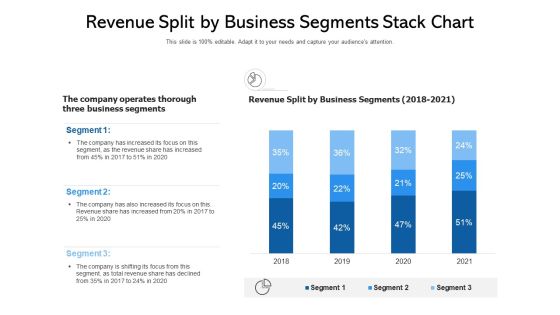
Revenue Split By Business Segments Stack Chart Ppt PowerPoint Presentation Ideas Sample PDF
Pitch your topic with ease and precision using this revenue split by business segments stack chart ppt powerpoint presentation ideas sample pdf. This layout presents information on revenue split by business segments stack chart. It is also available for immediate download and adjustment. So, changes can be made in the color, design, graphics or any other component to create a unique layout.

Bar Chart With Percentage Representing Annual Variance Ppt PowerPoint Presentation Gallery Portfolio PDF
Pitch your topic with ease and precision using this bar chart with percentage representing annual variance ppt powerpoint presentation gallery portfolio pdf. This layout presents information on bar chart with percentage representing annual variance. It is also available for immediate download and adjustment. So, changes can be made in the color, design, graphics or any other component to create a unique layout.

Bar Chart With Percentage Representing Inventory Ppt PowerPoint Presentation File Outfit PDF
Pitch your topic with ease and precision using this bar chart with percentage representing inventory ppt powerpoint presentation file outfit pdf. This layout presents information on bar chart with percentage representing inventory. It is also available for immediate download and adjustment. So, changes can be made in the color, design, graphics or any other component to create a unique layout.

Bar Chart With Percentage Showing Total Company Expenditures Ppt PowerPoint Presentation File Background PDF
Pitch your topic with ease and precision using this bar chart with percentage showing total company expenditures ppt powerpoint presentation file background pdf. This layout presents information on bar chart with percentage showing total company expenditures. It is also available for immediate download and adjustment. So, changes can be made in the color, design, graphics or any other component to create a unique layout.

Service Level Agreement Management Dashboard Indicating Customer Satisfaction Status Designs PDF
Pitch your topic with ease and precision using this service level agreement management dashboard indicating customer satisfaction status designs pdf. This layout presents information on customer satisfaction, service level management, contracts by manufacturer. It is also available for immediate download and adjustment. So, changes can be made in the color, design, graphics or any other component to create a unique layout.
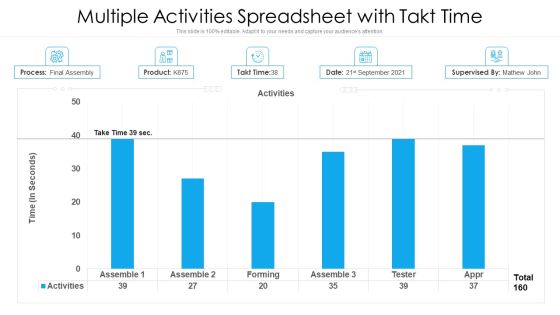
Multiple Activities Spreadsheet With Takt Time Ppt PowerPoint Presentation Slides Template PDF
Pitch your topic with ease and precision using this multiple activities spreadsheet with takt time ppt powerpoint presentation slides template pdf. This layout presents information on multiple activities spreadsheet with takt time. It is also available for immediate download and adjustment. So, changes can be made in the color, design, graphics or any other component to create a unique layout.

Compensation Management Operations Dashboard Icons PDF
Deliver and pitch your topic in the best possible manner with this compensation management operations dashboard icons pdf. Use them to share invaluable insights on compensation per sale, compensation per plan, compensation per plan, top 10, compensation per component with rank and impress your audience. This template can be altered and modified as per your expectations. So, grab it now.
Problem Tracker Dashboard For Marketing Project Topics PDF
Pitch your topic with ease and precision using this problem tracker dashboard for marketing project topics pdf. This layout presents information on problem tracker dashboard for marketing project. It is also available for immediate download and adjustment. So, changes can be made in the color, design, graphics or any other component to create a unique layout.

Graph Showing Financial Prediction Of Company Sales Revenue Topics PDF
Pitch your topic with ease and precision using this graph showing financial prediction of company sales revenue topics pdf. This layout presents information on graph showing financial prediction of company sales revenue. It is also available for immediate download and adjustment. So, changes can be made in the color, design, graphics or any other component to create a unique layout.
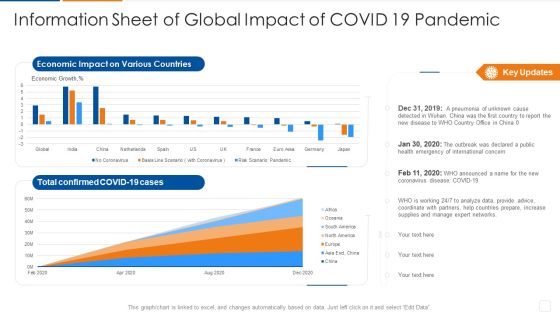
Information Sheet Of Global Impact Of Covid 19 Pandemic Designs PDF
Pitch your topic with ease and precision using this information sheet of global impact of covid 19 pandemic designs pdf. This layout presents information on information sheet of global impact of covid 19 pandemic. It is also available for immediate download and adjustment. So, changes can be made in the color, design, graphics or any other component to create a unique layout.
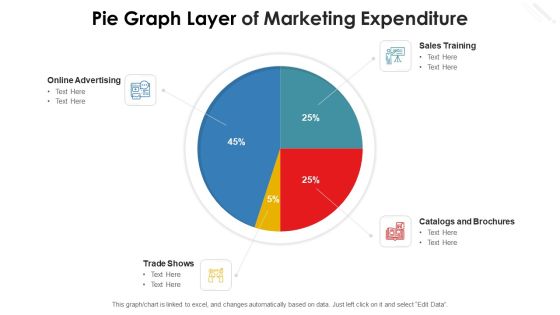
Pie Graph Layer Of Marketing Expenditure Themes PDF
Pitch your topic with ease and precision using this pie graph layer of marketing expenditure themes pdf. This layout presents information on online advertising, trade shows, sales training, catalogs and brochures. It is also available for immediate download and adjustment. So, changes can be made in the color, design, graphics or any other component to create a unique layout.

Pie Graph Layer Of Organizational Report Themes PDF
Pitch your topic with ease and precision using this pie graph layer of organizational report themes pdf. This layout presents information on revenues increased by, business growth and expansion, customer traffic increased by. It is also available for immediate download and adjustment. So, changes can be made in the color, design, graphics or any other component to create a unique layout.

Pie Graph Layer Showing Sector Wise Sales In 2022 Microsoft PDF
Pitch your topic with ease and precision using this pie graph layer showing sector wise sales in 2022 microsoft pdf. This layout presents information on consumer goods, information technology, automobile, financial services, engineering. It is also available for immediate download and adjustment. So, changes can be made in the color, design, graphics or any other component to create a unique layout.

Proportion Circle Graphics For Financial Risk Models Summary PDF
Pitch your topic with ease and precision using this proportion circle graphics for financial risk models summary pdf. This layout presents information on proportion circle graphics for financial risk models. It is also available for immediate download and adjustment. So, changes can be made in the color, design, graphics or any other component to create a unique layout.

Proportion Circle Illustration For Product Profitability Analysis Designs PDF
Pitch your topic with ease and precision using this proportion circle illustration for product profitability analysis designs pdf. This layout presents information on proportion circle illustration for product profitability analysis. It is also available for immediate download and adjustment. So, changes can be made in the color, design, graphics or any other component to create a unique layout.

Proportion Circle Infographics For Financial Statement Analysis Mockup PDF
Pitch your topic with ease and precision using this proportion circle infographics for financial statement analysis mockup pdf. This layout presents information on proportion circle infographics for financial statement analysis. It is also available for immediate download and adjustment. So, changes can be made in the color, design, graphics or any other component to create a unique layout.
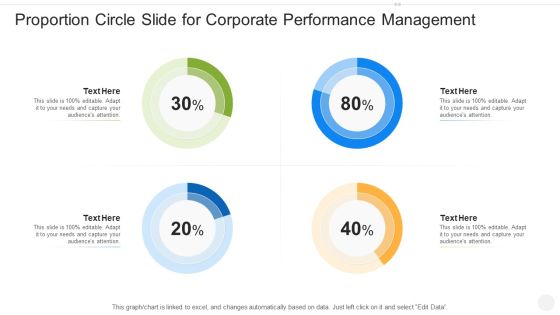
Proportion Circle Slide For Corporate Performance Management Rules PDF
Pitch your topic with ease and precision using this proportion circle slide for corporate performance management rules pdf. This layout presents information on proportion circle slide for corporate performance management. It is also available for immediate download and adjustment. So, changes can be made in the color, design, graphics or any other component to create a unique layout.

Company Hardware And Software Sales Accomplishment Rate Rules PDF
Pitch your topic with ease and precision using this company hardware and software sales accomplishment rate rules pdf. This layout presents information on company hardware and software sales accomplishment rate. It is also available for immediate download and adjustment. So, changes can be made in the color, design, graphics or any other component to create a unique layout.
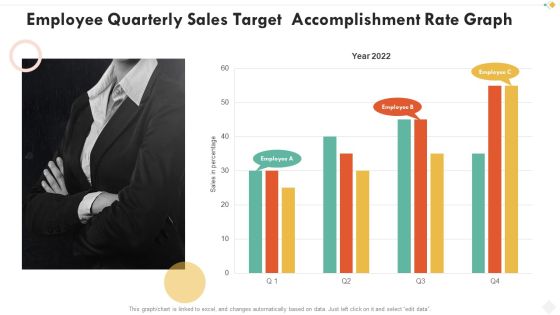
Employee Quarterly Sales Target Accomplishment Rate Graph Demonstration PDF
Pitch your topic with ease and precision using this employee quarterly sales target accomplishment rate graph demonstration pdf. This layout presents information on employee quarterly sales target accomplishment rate graph. It is also available for immediate download and adjustment. So, changes can be made in the color, design, graphics or any other component to create a unique layout.
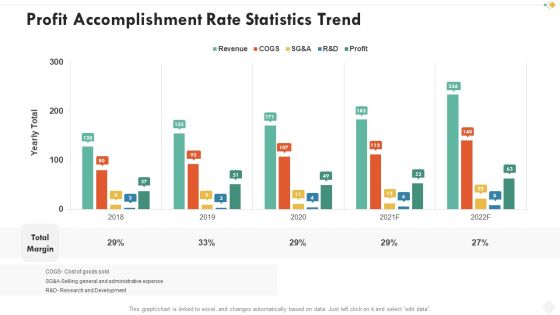
Profit Accomplishment Rate Statistics Trend Background PDF
Pitch your topic with ease and precision using this profit accomplishment rate statistics trend background pdf. This layout presents information on profit accomplishment rate statistics trend. It is also available for immediate download and adjustment. So, changes can be made in the color, design, graphics or any other component to create a unique layout.
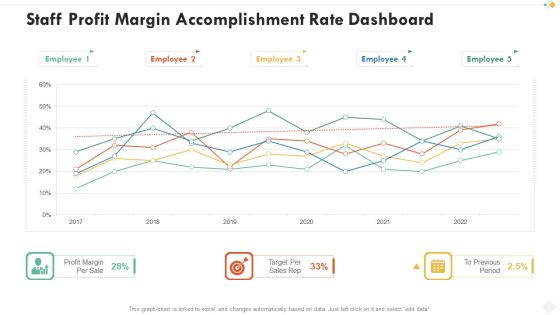
Staff Profit Margin Accomplishment Rate Dashboard Themes PDF
Pitch your topic with ease and precision using this staff profit margin accomplishment rate dashboard themes pdf. This layout presents information on staff profit margin accomplishment rate dashboard. It is also available for immediate download and adjustment. So, changes can be made in the color, design, graphics or any other component to create a unique layout.

Five Point Scale Likert Scale With Survey Objectives Inspiration PDF
Pitch your topic with ease and precision using this five point scale likert scale with survey objectives inspiration pdf. This layout presents information on survey, customer. It is also available for immediate download and adjustment. So, changes can be made in the color, design, graphics or any other component to create a unique layout.
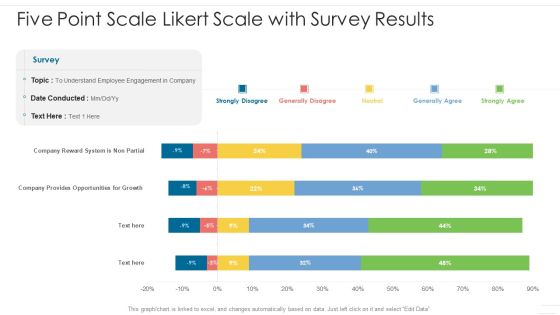
Five Point Scale Likert Scale With Survey Results Diagrams PDF
Pitch your topic with ease and precision using this five point scale likert scale with survey results diagrams pdf. This layout presents information on service, customer, survey. It is also available for immediate download and adjustment. So, changes can be made in the color, design, graphics or any other component to create a unique layout.

Balance Sheet Calculation With Financial Dashboard Background PDF
Pitch your topic with ease and precision using this balance sheet calculation with financial dashboard background pdf. This layout presents information on balance sheet calculation with financial dashboard. It is also available for immediate download and adjustment. So, changes can be made in the color, design, graphics or any other component to create a unique layout.
Reporting Sheet For Effective Tracking And Application Programming Interface Administration Introduction PDF
Pitch your topic with ease and precision using this reporting sheet for effective tracking and application programming interface administration introduction pdf. This layout presents information on reporting sheet for effective tracking and application programming interface administration. It is also available for immediate download and adjustment. So, changes can be made in the color, design, graphics or any other component to create a unique layout.

Graph Showing The Statistics Of Employee Engagement Count By Region Formats PDF
Pitch your topic with ease and precision using this graph showing the statistics of employee engagement count by region formats pdf. This layout presents information on graph showing the statistics of employee engagement count by region. It is also available for immediate download and adjustment. So, changes can be made in the color, design, graphics or any other component to create a unique layout.
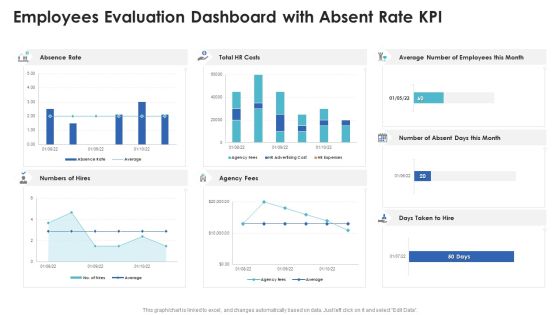
Employees Evaluation Dashboard With Absent Rate Kpi Microsoft PDF
Pitch your topic with ease and precision using this employees evaluation dashboard with absent rate kpi microsoft pdf. This layout presents information on employees evaluation dashboard with absent rate kpi. It is also available for immediate download and adjustment. So, changes can be made in the color, design, graphics or any other component to create a unique layout.

Employees Evaluation Dashboard With Employee And Salary Data Infographics PDF
Pitch your topic with ease and precision using this employees evaluation dashboard with employee and salary data infographics pdf. This layout presents information on employees evaluation dashboard with employee and salary data. It is also available for immediate download and adjustment. So, changes can be made in the color, design, graphics or any other component to create a unique layout.

Employees Evaluation Dashboard With Male Female Demographics Data Ideas PDF
Pitch your topic with ease and precision using this employees evaluation dashboard with male female demographics data ideas pdf. This layout presents information on employees evaluation dashboard with male female demographics data. It is also available for immediate download and adjustment. So, changes can be made in the color, design, graphics or any other component to create a unique layout.
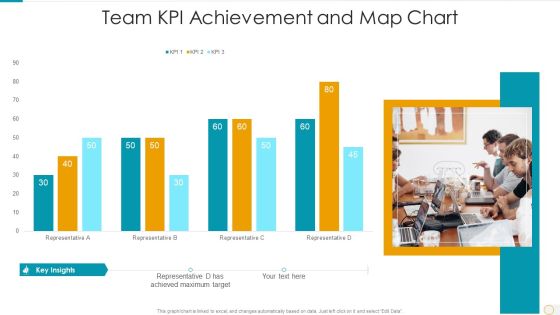
Team Kpi Achievement And Map Chart Portrait PDF
Pitch your topic with ease and precision using this team kpi achievement and map chart portrait pdf. This layout presents information on team kpi achievement and map chart. It is also available for immediate download and adjustment. So, changes can be made in the color, design, graphics or any other component to create a unique layout.

Comparative Assessment Chart Highlighting Sales Distribution Among 3 Groups Designs PDF
Pitch your topic with ease and precision using this comparative assessment chart highlighting sales distribution among 3 groups designs pdf. This layout presents information on comparative assessment chart highlighting sales distribution among 3 groups. It is also available for immediate download and adjustment. So, changes can be made in the color, design, graphics or any other component to create a unique layout.

Use Pareto Chart Graph Software For Quality Administration Structure PDF
Pitch your topic with ease and precision using this use pareto chart graph software for quality administration structure pdf. This layout presents information on use pareto chart graph software for quality administration. It is also available for immediate download and adjustment. So, changes can be made in the color, design, graphics or any other component to create a unique layout.

Progress Indicator Ring Diagram For Business To Business Trading Graphics PDF
Pitch your topic with ease and precision using this progress indicator ring diagram for business to business trading graphics pdf. This layout presents information on progress indicator ring diagram for business to business trading. It is also available for immediate download and adjustment. So, changes can be made in the color, design, graphics or any other component to create a unique layout.

Progress Indicator Ring Graphics For Business Customer Satisfaction Background PDF
Pitch your topic with ease and precision using this progress indicator ring graphics for business customer satisfaction background pdf. This layout presents information on progress indicator ring graphics for business customer satisfaction. It is also available for immediate download and adjustment. So, changes can be made in the color, design, graphics or any other component to create a unique layout.
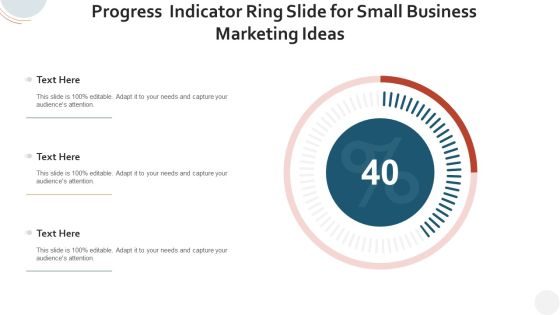
Progress Indicator Ring Slide For Small Business Marketing Ideas Guidelines PDF
Pitch your topic with ease and precision using this progress indicator ring slide for small business marketing ideas guidelines pdf. This layout presents information on progress indicator ring slide for small business marketing ideas. It is also available for immediate download and adjustment. So, changes can be made in the color, design, graphics or any other component to create a unique layout.

Progress Indicator Ring Visual For Forecasting Expected Results Diagrams PDF
Pitch your topic with ease and precision using this progress indicator ring visual for forecasting expected results diagrams pdf. This layout presents information on progress indicator ring visual for forecasting expected results. It is also available for immediate download and adjustment. So, changes can be made in the color, design, graphics or any other component to create a unique layout.
 Home
Home