AI PPT Maker
Templates
PPT Bundles
Design Services
Business PPTs
Business Plan
Management
Strategy
Introduction PPT
Roadmap
Self Introduction
Timelines
Process
Marketing
Agenda
Technology
Medical
Startup Business Plan
Cyber Security
Dashboards
SWOT
Proposals
Education
Pitch Deck
Digital Marketing
KPIs
Project Management
Product Management
Artificial Intelligence
Target Market
Communication
Supply Chain
Google Slides
Research Services
 One Pagers
All Categories
-
Home
- Customer Favorites
- Cost Benefit
Cost Benefit

2013 Business Growth Success PowerPoint Templates Ppt Backgrounds For Slides 1212
We present our 2013 Business Growth Success PowerPoint Templates PPT Backgrounds For Slides 1212.Use our Globe PowerPoint Templates because it helps you to clearly delegate the different tasks along with their necessary resources and responsibilities. Download our Finance PowerPoint Templates because this Layout helps you to expand your plans to overcome obstacles and reassure the team that they shall continue to roll along merrily. Download and present our Business PowerPoint Templates because project your ideas to you colleagues and complete the full picture. Present our New year PowerPoint Templates because you can Take your team along by explaining your plans. Download and present our Success PowerPoint Templates because the plans are in your head, stage by stage, year by year.Use these PowerPoint slides for presentations relating to 2013 business graph, Globe, Finance, Business, New year, Success. The prominent colors used in the PowerPoint template are Blue, Blue light, Yellow. You can be sure our 2013 Business Growth Success PowerPoint Templates PPT Backgrounds For Slides 1212 are Dazzling. We assure you our Business PowerPoint templates and PPT Slides are Pretty. Use our 2013 Business Growth Success PowerPoint Templates PPT Backgrounds For Slides 1212 are designed to make your presentations professional. Customers tell us our Business PowerPoint templates and PPT Slides will save the presenter time. Use our 2013 Business Growth Success PowerPoint Templates PPT Backgrounds For Slides 1212 are Appealing. The feedback we get is that our Globe PowerPoint templates and PPT Slides will impress their bosses and teams.

Steps To Create Daily Manufacturing Overview Report Demonstration PDF
The slide showcases steps to develop daily production report helps producers keep track of money and resources. It covers steps like create a realistic plan, have clear objectives, organize the tasks, assign tasks and monitor and evaluate. Presenting Steps To Create Daily Manufacturing Overview Report Demonstration PDF to dispense important information. This template comprises five stages. It also presents valuable insights into the topics including Objectives, Assign Tasks, Evaluate. This is a completely customizable PowerPoint theme that can be put to use immediately. So, download it and address the topic impactfully.

Defining The Process To Obtain Business License In Usa Opening Retail Store In Untapped Background PDF
The following slide showcases multistep process which can be used to acquire a business license for the opening of new retail store in USA. The major steps are registration, forming the legal entity, licensing requirements, applying for professional licenses and completing tax registrations.Coming up with a presentation necessitates that the majority of the effort goes into the content and the message you intend to convey. The visuals of a PowerPoint presentation can only be effective if it supplements and supports the story that is being told. Keeping this in mind our experts created Defining The Process To Obtain Business License In Usa Opening Retail Store In Untapped Background PDF to reduce the time that goes into designing the presentation. This way, you can concentrate on the message while our designers take care of providing you with the right template for the situation.

3d Men Working On Laptop For Growth Business PowerPoint Templates Ppt Backgrounds For Slides 1112
We present our 3d Men Working On Laptop For Growth Business PowerPoint Templates PPT Backgrounds For Slides 1112.Download our Business PowerPoint Templates because profit levels have been steady over the recent past. Spread your heightened excitement to others in the room. Present our Technology PowerPoint Templates because we provide the means to project your views. Download our Success PowerPoint Templates because your quest has taken you well onto the path of success. Use our People PowerPoint Templates because it depicts Rolling along while gathering profits along the way is the aim. Use our Finance PowerPoint Templates because you envisage some areas of difficulty in the near future. The overall financial situation could be a source of worry.Use these PowerPoint slides for presentations relating to Businessman works on laptop, business, finance, people, success, technology. The prominent colors used in the PowerPoint template are White, Gray, Orange. People tell us our 3d Men Working On Laptop For Growth Business PowerPoint Templates PPT Backgrounds For Slides 1112 are No-nonsense. Presenters tell us our on PowerPoint templates and PPT Slides are Glamorous. Presenters tell us our 3d Men Working On Laptop For Growth Business PowerPoint Templates PPT Backgrounds For Slides 1112 are Spectacular. Use our people PowerPoint templates and PPT Slides are Cheerful. We assure you our 3d Men Working On Laptop For Growth Business PowerPoint Templates PPT Backgrounds For Slides 1112 are Festive. The feedback we get is that our finance PowerPoint templates and PPT Slides are Charming.

6 Diverging Branches Of The Process Relative Circular Arrow Chart PowerPoint Templates
We present our 6 diverging branches of the process Relative Circular Arrow Chart PowerPoint templates.Download and present our Communication PowerPoint Templates because it can convey all the options that present themselves. Use our Business PowerPoint Templates because you are ready to flap your wings and launch off. All poised are you to touch the sky with glory. Present our Process and Flows PowerPoint Templates because you can expound on how you plan to gain their confidence and assure them of continued and consistent excellence in quality of service. Download and present our Shapes PowerPoint Templates because they are Gauranteed to focus the minds of your team. Present our Arrows PowerPoint Templates because there is a crucial aspect that requires extra attention.Use these PowerPoint slides for presentations relating to Arrow, Brochure, Business, Chart, Circle, Cyclic, Data, Diagram, Financial, Goal, Graph, Illustration, Info, Information, Investment, Manage, Marketing, Model, Option, Part, Pie, Presentation, Process, Result, Sphere, Statistics, Stock, Strategy, Template, Wheel. The prominent colors used in the PowerPoint template are Blue, Gray, Black. The feedback we get is that our 6 diverging branches of the process Relative Circular Arrow Chart PowerPoint templates are the best it can get when it comes to presenting. People tell us our Cyclic PowerPoint templates and PPT Slides are Dazzling. Presenters tell us our 6 diverging branches of the process Relative Circular Arrow Chart PowerPoint templates are One-of-a-kind. Use our Circle PowerPoint templates and PPT Slides are Fancy. Use our 6 diverging branches of the process Relative Circular Arrow Chart PowerPoint templates are Majestic. Use our Chart PowerPoint templates and PPT Slides are designed by a team of presentation professionals.

Football 2013 Championship Competition PowerPoint Templates Ppt Backgrounds For Slides 1112
We present our Football 2013 Championship Competition PowerPoint Templates PPT Backgrounds For Slides 1112.Use our Sports PowerPoint Templates because,Archers are known for their steadfast focus. Use our Competition PowerPoint Templates because,This slide helps you to communicate your concerns and educate your team along the path to success. Use our Events PowerPoint Templates because,You can get advantage to prioritise your ideas. Use our Holidays PowerPoint Templates because,You are buzzing with ideas. Use our New year PowerPoint Templates because,You require care and diligence to function well.Use these PowerPoint slides for presentations relating to Happy new year 2013, events, holidays, competition, sports, new year . The prominent colors used in the PowerPoint template are Red, Green, White. Customers tell us our Football 2013 Championship Competition PowerPoint Templates PPT Backgrounds For Slides 1112 are Fabulous. Professionals tell us our year PowerPoint templates and PPT Slides are Awesome. PowerPoint presentation experts tell us our Football 2013 Championship Competition PowerPoint Templates PPT Backgrounds For Slides 1112 are Spiffy. PowerPoint presentation experts tell us our events PowerPoint templates and PPT Slides are Luxurious. Presenters tell us our Football 2013 Championship Competition PowerPoint Templates PPT Backgrounds For Slides 1112 are Liberated. Professionals tell us our holidays PowerPoint templates and PPT Slides are Upbeat.
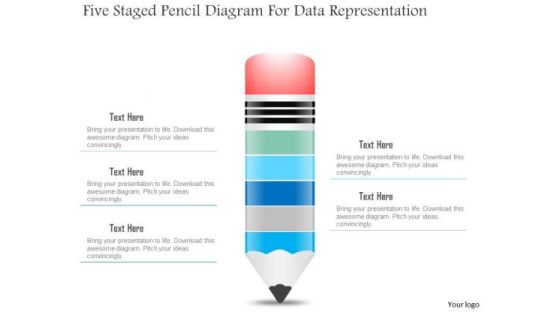
Business Diagram Five Staged Pencil Diagram For Data Representation PowerPoint Slide
This business slide displays five staged pencil diagram. It contains pencil graphic divided into five parts. This diagram slide depicts processes, stages, steps, points, options and education information display. Use this diagram, in your presentations to express your views innovatively.
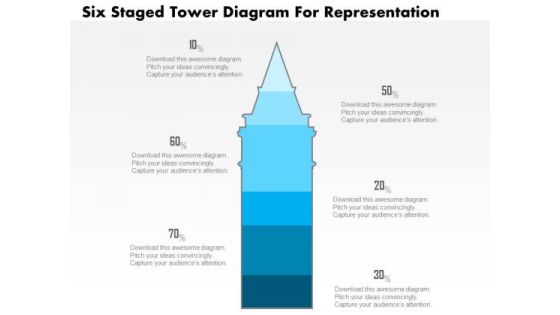
Business Diagram Five Staged Tower Diagram For Representation PowerPoint Slide
This business slide displays five staged tower diagram. It contains blue tower graphic divided into five parts. This diagram slide depicts processes, stages, steps, points, options information display. Use this diagram, in your presentations to express your views innovatively.

6 Arrows Different Aspects Same Issue Restaurant Business Plan PowerPoint Slides
We present our 6 arrows different aspects same issue restaurant business plan PowerPoint Slides.Download our Arrows PowerPoint Templates because you can Unravel the desired and essential elements of your overall strategy. Present our Shapes PowerPoint Templates because Our PowerPoint Templates and Slides will embellish your thoughts. See them provide the desired motivation to your team. Download and present our Circle Charts PowerPoint Templates because it depicts Rolling along while gathering profits along the way is the aim. Present our Signs PowerPoint Templates because Our PowerPoint Templates and Slides will let you Hit the right notes. Watch your audience start singing to your tune. Use our Business PowerPoint Templates because you too have got the framework of your companys growth in place.Use these PowerPoint slides for presentations relating to 3d, achievement, aim, arrow, business, career, chart, communication, competition, concept, direction, financial, flying, forward, gain, going, gold, golden, graphic, group, grow, grow up, growing, growth, icon, illustration, image, leader, leadership, line, market, motion, one, progress, reflection, sign, silver, success, symbol, team, teamwork, together, turn, two, up, upward, way, white, win, winner. The prominent colors used in the PowerPoint template are Red, Gray, White. People tell us our 6 arrows different aspects same issue restaurant business plan PowerPoint Slides are Radiant. Use our business PowerPoint templates and PPT Slides will make you look like a winner. Use our 6 arrows different aspects same issue restaurant business plan PowerPoint Slides are Upbeat. PowerPoint presentation experts tell us our chart PowerPoint templates and PPT Slides are Tranquil. People tell us our 6 arrows different aspects same issue restaurant business plan PowerPoint Slides are Zippy. Customers tell us our chart PowerPoint templates and PPT Slides are Dynamic.

Bookkeeping Automation Software Comparative Analysis Sample PDF
The following slide highlights comparative analysis of accounting automation to generate key financial reports. It includes elements such as software, features, budget per month, free trial, user rating and pros. It includes features such as control bookkeeping including payroll, create electronic bills, manage inventory etc. Showcasing this set of slides titled Bookkeeping Automation Software Comparative Analysis Sample PDF. The topics addressed in these templates are Budget, Medium Business, Sales Support. All the content presented in this PPT design is completely editable. Download it and make adjustments in color, background, font etc. as per your unique business setting.

Clinical Services Company Profile Competitor Comparison Analysis Report Infographics PDF
The slide comparative analysis of company with competitors on the basis ratings, number of employees, funding, market capitalization, revenue, net profit and total assets. It describes the company position in global market. This is a Clinical Services Company Profile Competitor Comparison Analysis Report Infographics PDF template with various stages. Focus and dispense information on one stages using this creative set, that comes with editable features. It contains large content boxes to add your information on topics like Employees, Revenue, Net Profit. You can also showcase facts, figures, and other relevant content using this PPT layout. Grab it now.

Pharmaceutical And Clinical Research Summary Competitor Comparison Analysis Report Information PDF
The slide comparative analysis of company with competitors on the basis ratings, number of employees, funding, market capitalization, revenue, net profit and total assets. It describes the company position in global market. Deliver and pitch your topic in the best possible manner with this Pharmaceutical And Clinical Research Summary Competitor Comparison Analysis Report Information PDF. Use them to share invaluable insights on Employees, Revenue, Net Profit and impress your audience. This template can be altered and modified as per your expectations. So, grab it now.

8 Stages Circular Spoke Diagram Small Business Plan Example PowerPoint Slides
We present our 8 stages circular spoke diagram small business plan example PowerPoint Slides.Present our Circle Charts PowerPoint Templates because Our PowerPoint Templates and Slides will provide weight to your words. They will bring out the depth of your thought process. Use our Business PowerPoint Templates because Our PowerPoint Templates and Slides team portray an attitude of elegance. Personify this quality by using them regularly. Use our Flow Charts PowerPoint Templates because You can Zap them with our PowerPoint Templates and Slides. See them reel under the impact. Download our Arrows PowerPoint Templates because You can Rise to the occasion with our PowerPoint Templates and Slides. You will bring your audience on their feet in no time. Download our Shapes PowerPoint Templates because It will Give impetus to the hopes of your colleagues. Our PowerPoint Templates and Slides will aid you in winning their trust.Use these PowerPoint slides for presentations relating to Training, plans, vision, icon, chart, project, mission, model, map, corporate, tool, business, concept, hierarchy, success, representation, diagram, guide,process, capability, marketing, theory, idea, abstract, mind, illustration, strategy, clipart, guidelines, organization, commerce, conceptual, capacity, improvement, resource, theoretical, action . The prominent colors used in the PowerPoint template are Blue, Gray, White.

Enterprise Consumer Technology Management Issue That The Organization Is Facing Rules PDF
The following slide highlights multiple issues that the organization is facing for the past financial year, these issues can be low revenues , and other generals issues. Get a simple yet stunning designed Enterprise Consumer Technology Management Issue That The Organization Is Facing Rules PDF. It is the best one to establish the tone in your meetings. It is an excellent way to make your presentations highly effective. So, download this PPT today from Slidegeeks and see the positive impacts. Our easy to edit Enterprise Consumer Technology Management Issue That The Organization Is Facing Rules PDF can be your go to option for all upcoming conferences and meetings. So, what are you waiting for Grab this template today.
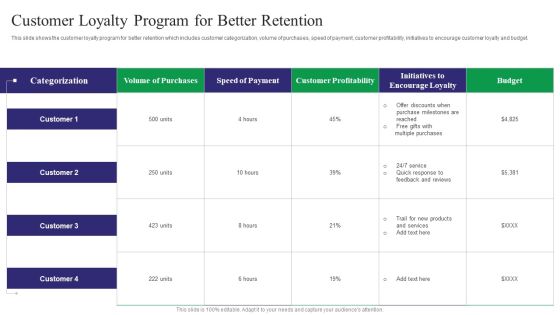
Reducing Customer Turnover Rates Customer Loyalty Program For Better Retention Mockup PDF
This slide shows the customer loyalty program for better retention which includes customer categorization, volume of purchases, speed of payment, customer profitability, initiatives to encourage customer loyalty and budget. Get a simple yet stunning designed Reducing Customer Turnover Rates Customer Loyalty Program For Better Retention Mockup PDF. It is the best one to establish the tone in your meetings. It is an excellent way to make your presentations highly effective. So, download this PPT today from Slidegeeks and see the positive impacts. Our easy-to-edit Reducing Customer Turnover Rates Customer Loyalty Program For Better Retention Mockup PDF can be your go-to option for all upcoming conferences and meetings. So, what are you waiting for Grab this template today.
Creating New Product Launch Campaign Strategy Defining The Journey Map For Target Customer Icons PDF
This slide shows customer journey map covering stages namely awareness, consideration, decision, delivery and use and loyalty and advocacy. Coming up with a presentation necessitates that the majority of the effort goes into the content and the message you intend to convey. The visuals of a PowerPoint presentation can only be effective if it supplements and supports the story that is being told. Keeping this in mind our experts created Creating New Product Launch Campaign Strategy Defining The Journey Map For Target Customer Icons PDF to reduce the time that goes into designing the presentation. This way, you can concentrate on the message while our designers take care of providing you with the right template for the situation.

Facilities Management Dashboard Highlighting Organization Power Consumption Introduction PDF
This slide highlights the dashboard for facilities management which includes HVAC, lighting, power, water, electricity, monthly consumption chart, occupancy rate, and service requests. Coming up with a presentation necessitates that the majority of the effort goes into the content and the message you intend to convey. The visuals of a PowerPoint presentation can only be effective if it supplements and supports the story that is being told. Keeping this in mind our experts created Facilities Management Dashboard Highlighting Organization Power Consumption Introduction PDF to reduce the time that goes into designing the presentation. This way, you can concentrate on the message while our designers take care of providing you with the right template for the situation.

Global Automotive Industry Analysis Estimated Global Motor Vehicle Production By Type Graphics PDF
This slide covers a graphical representation of worldwide automobile manufacturing forecasts. It also includes key insights about as passenger cars, Chinese motorists, etc. Coming up with a presentation necessitates that the majority of the effort goes into the content and the message you intend to convey. The visuals of a PowerPoint presentation can only be effective if it supplements and supports the story that is being told. Keeping this in mind our experts created Global Automotive Industry Analysis Estimated Global Motor Vehicle Production By Type Graphics PDF to reduce the time that goes into designing the presentation. This way, you can concentrate on the message while our designers take care of providing you with the right template for the situation.

Analysis Of Meat Segment In Food Manufacturing Industry Industry Analysis Of Food Formats PDF
This slide provides information regarding the market analysis of meat segment in food manufacturing industry in terms of leading states in meat production, species wise meat production, top exported products, opportunities in meat processing technology.Coming up with a presentation necessitates that the majority of the effort goes into the content and the message you intend to convey. The visuals of a PowerPoint presentation can only be effective if it supplements and supports the story that is being told. Keeping this in mind our experts created Analysis Of Meat Segment In Food Manufacturing Industry Industry Analysis Of Food Formats PDF to reduce the time that goes into designing the presentation. This way, you can concentrate on the message while our designers take care of providing you with the right template for the situation.
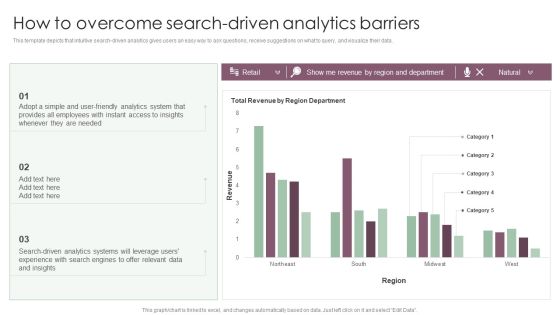
Information Analysis And BI Playbook How To Overcome Search Driven Analytics Barriers Formats PDF
This template depicts that intuitive search driven analytics gives users an easy way to ask questions, receive suggestions on what to query, and visualize their data. Coming up with a presentation necessitates that the majority of the effort goes into the content and the message you intend to convey. The visuals of a PowerPoint presentation can only be effective if it supplements and supports the story that is being told. Keeping this in mind our experts created Information Analysis And BI Playbook How To Overcome Search Driven Analytics Barriers Formats PDF to reduce the time that goes into designing the presentation. This way, you can concentrate on the message while our designers take care of providing you with the right template for the situation.

Integrating ITSM To Enhance Service Itsm Ticketing Tool Dashboard With Activity Status Microsoft PDF
This slide depicts information technology service management ITSM ticketing tool dashboard with activity status. It provides information about open tickets, closed tickets, requests, desktop support, alert level, completed tickets, etc. Crafting an eye-catching presentation has never been more straightforward. Let your presentation shine with this tasteful yet straightforward Integrating ITSM To Enhance Service Itsm Ticketing Tool Dashboard With Activity Status Microsoft PDF template. It offers a minimalistic and classy look that is great for making a statement. The colors have been employed intelligently to add a bit of playfulness while still remaining professional. Construct the ideal Integrating ITSM To Enhance Service Itsm Ticketing Tool Dashboard With Activity Status Microsoft PDF that effortlessly grabs the attention of your audience Begin now and be certain to wow your customers.
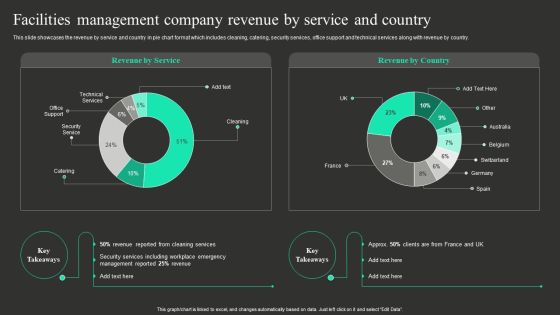
Facilities Management Company Revenue By Service And Country Information PDF
This slide showcases the revenue by service and country in pie chart format which includes cleaning, catering, security services, office support and technical services along with revenue by country. If you are looking for a format to display your unique thoughts, then the professionally designed Facilities Management Company Revenue By Service And Country Information PDF is the one for you. You can use it as a Google Slides template or a PowerPoint template. Incorporate impressive visuals, symbols, images, and other charts. Modify or reorganize the text boxes as you desire. Experiment with shade schemes and font pairings. Alter, share or cooperate with other people on your work. Download Facilities Management Company Revenue By Service And Country Information PDF and find out how to give a successful presentation. Present a perfect display to your team and make your presentation unforgettable.
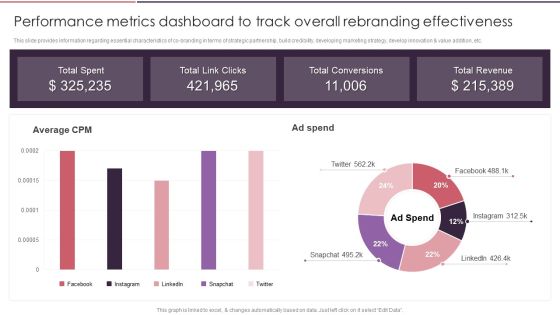
Rebranding Brand Fresh Face Development Performance Metrics Dashboard To Track Overall Rules PDF
This slide provides information regarding essential characteristics of co-branding in terms of strategic partnership, build credibility, developing marketing strategy, develop innovation and value addition, etc. Coming up with a presentation necessitates that the majority of the effort goes into the content and the message you intend to convey. The visuals of a PowerPoint presentation can only be effective if it supplements and supports the story that is being told. Keeping this in mind our experts created Rebranding Brand Fresh Face Development Performance Metrics Dashboard To Track Overall Rules PDF to reduce the time that goes into designing the presentation. This way, you can concentrate on the message while our designers take care of providing you with the right template for the situation.

Total Revenue From Food And Beverage Stores In The Usa Launching New Beverage Product Mockup PDF
The following slide outlines the industry sales generated from various type of food and beverage stores in the USA. It covers information about the grocery, liquor and specialty food stores. Coming up with a presentation necessitates that the majority of the effort goes into the content and the message you intend to convey. The visuals of a PowerPoint presentation can only be effective if it supplements and supports the story that is being told. Keeping this in mind our experts created Total Revenue From Food And Beverage Stores In The Usa Launching New Beverage Product Mockup PDF to reduce the time that goes into designing the presentation. This way, you can concentrate on the message while our designers take care of providing you with the right template for the situation.
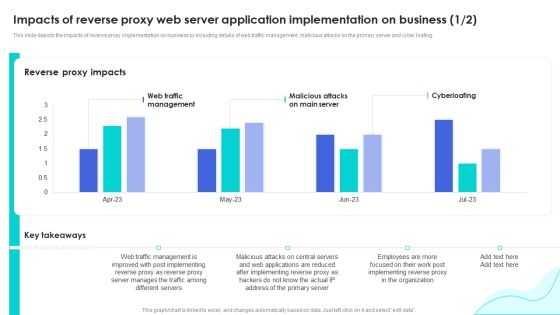
Reverse Proxy Web Server Impacts Of Reverse Proxy Web Server Application Inspiration PDF
This slide depicts the impacts of reverse proxy implementation on business by including details of web traffic management, malicious attacks on the primary server and cyber loafing. Coming up with a presentation necessitates that the majority of the effort goes into the content and the message you intend to convey. The visuals of a PowerPoint presentation can only be effective if it supplements and supports the story that is being told. Keeping this in mind our experts created Reverse Proxy Web Server Impacts Of Reverse Proxy Web Server Application Inspiration PDF to reduce the time that goes into designing the presentation. This way, you can concentrate on the message while our designers take care of providing you with the right template for the situation.

Product Development And Management Dashboard Product Development And Management Plan Brochure PDF
This slide represents product development and management dashboard. It covers project hours, hours spent on project tasks, to do list etc.Coming up with a presentation necessitates that the majority of the effort goes into the content and the message you intend to convey. The visuals of a PowerPoint presentation can only be effective if it supplements and supports the story that is being told. Keeping this in mind our experts created Product Development And Management Dashboard Product Development And Management Plan Brochure PDF to reduce the time that goes into designing the presentation. This way, you can concentrate on the message while our designers take care of providing you with the right template for the situation.
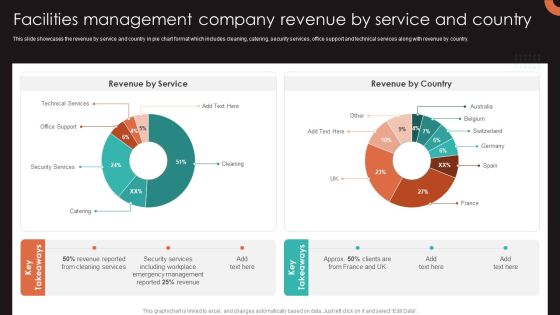
Facilities Management Company Revenue By Service And Country Mockup PDF
This slide showcases the revenue by service and country in pie chart format which includes cleaning, catering, security services, office support and technical services along with revenue by country. Here you can discover an assortment of the finest PowerPoint and Google Slides templates. With these templates, you can create presentations for a variety of purposes while simultaneously providing your audience with an eye catching visual experience. Download Facilities Management Company Revenue By Service And Country Mockup PDF to deliver an impeccable presentation. These templates will make your job of preparing presentations much quicker, yet still, maintain a high level of quality. Slidegeeks has experienced researchers who prepare these templates and write high quality content for you. Later on, you can personalize the content by editing the Facilities Management Company Revenue By Service And Country Mockup PDF.
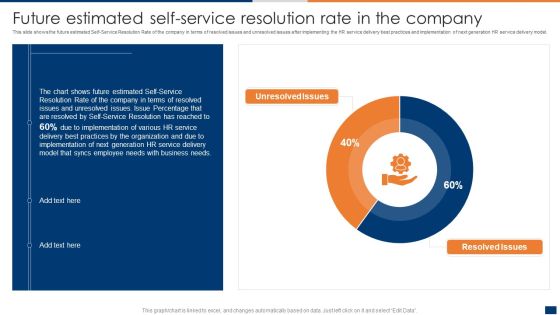
Future Estimated Self Service Resolution Rate In The Company Ppt PowerPoint Presentation File Show PDF
This slide shows the future estimated Self-Service Resolution Rate of the company in terms of resolved issues and unresolved issues after implementing the HR service delivery best practices and implementation of next generation HR service delivery model. Coming up with a presentation necessitates that the majority of the effort goes into the content and the message you intend to convey. The visuals of a PowerPoint presentation can only be effective if it supplements and supports the story that is being told. Keeping this in mind our experts created Future Estimated Self Service Resolution Rate In The Company Ppt PowerPoint Presentation File Show PDF to reduce the time that goes into designing the presentation. This way, you can concentrate on the message while our designers take care of providing you with the right template for the situation.

Targeted Marketing Strategic Plan For Audience Engagement Strategies Used By Marketers For Personalizing Email Campaigns Template PDF
This slide showcases various strategies that are implemented by marketers for email campaigns personalization. It includes tailored messaging, triggered emails, product recommendations in email etc. Coming up with a presentation necessitates that the majority of the effort goes into the content and the message you intend to convey. The visuals of a PowerPoint presentation can only be effective if it supplements and supports the story that is being told. Keeping this in mind our experts created Targeted Marketing Strategic Plan For Audience Engagement Strategies Used By Marketers For Personalizing Email Campaigns Template PDF to reduce the time that goes into designing the presentation. This way, you can concentrate on the message while our designers take care of providing you with the right template for the situation.

Adopting Flexible Work Policy Impact Of Flexible Working On Employees Performance Ideas PDF
The following slide showcases the impact of remote working on performance of the workforce. Employee productivity, job satisfaction, employee retention and absenteeism rate are the major factors that are mentioned in the slide along with key insights. Coming up with a presentation necessitates that the majority of the effort goes into the content and the message you intend to convey. The visuals of a PowerPoint presentation can only be effective if it supplements and supports the story that is being told. Keeping this in mind our experts created Adopting Flexible Work Policy Impact Of Flexible Working On Employees Performance Ideas PDF to reduce the time that goes into designing the presentation. This way, you can concentrate on the message while our designers take care of providing you with the right template for the situation.

Strategic FM Services Facilities Management Company Revenue By Service And Country Topics PDF
This slide showcases the revenue by service and country in pie chart format which includes cleaning, catering, security services, office support and technical services along with revenue by country. Crafting an eye catching presentation has never been more straightforward. Let your presentation shine with this tasteful yet straightforward Strategic FM Services Facilities Management Company Revenue By Service And Country Topics PDF template. It offers a minimalistic and classy look that is great for making a statement. The colors have been employed intelligently to add a bit of playfulness while still remaining professional. Construct the ideal Strategic FM Services Facilities Management Company Revenue By Service And Country Topics PDF that effortlessly grabs the attention of your audience Begin now and be certain to wow your customers.

Curastory Editing Platform Pitch Deck Growth Of Video Creator Economy Template PDF
This slide highlights the growth and development of the creator economy and favors video creation content. It includes audience favor video and brands favor video. Coming up with a presentation necessitates that the majority of the effort goes into the content and the message you intend to convey. The visuals of a PowerPoint presentation can only be effective if it supplements and supports the story that is being told. Keeping this in mind our experts created Curastory Editing Platform Pitch Deck Growth Of Video Creator Economy Template PDF to reduce the time that goes into designing the presentation. This way, you can concentrate on the message while our designers take care of providing you with the right template for the situation.
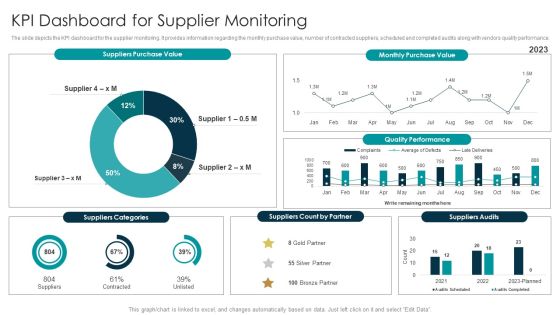
Tactical Approach For Vendor Reskilling KPI Dashboard For Supplier Monitoring Slides PDF
The slide depicts the KPI dashboard for the supplier monitoring. It provides information regarding the monthly purchase value, number of contracted suppliers, scheduled and completed audits along with vendors quality performance. Coming up with a presentation necessitates that the majority of the effort goes into the content and the message you intend to convey. The visuals of a PowerPoint presentation can only be effective if it supplements and supports the story that is being told. Keeping this in mind our experts created Tactical Approach For Vendor Reskilling KPI Dashboard For Supplier Monitoring Slides PDF to reduce the time that goes into designing the presentation. This way, you can concentrate on the message while our designers take care of providing you with the right template for the situation.

Vendor Relationship Management Strategic Plan KPI Dashboard For Supplier Monitoring Infographics PDF
The slide depicts the KPI dashboard for the supplier monitoring. It provides information regarding the monthly purchase value, number of contracted suppliers, scheduled and completed audits along with vendors quality performance. Coming up with a presentation necessitates that the majority of the effort goes into the content and the message you intend to convey. The visuals of a PowerPoint presentation can only be effective if it supplements and supports the story that is being told. Keeping this in mind our experts created Vendor Relationship Management Strategic Plan KPI Dashboard For Supplier Monitoring Infographics PDF to reduce the time that goes into designing the presentation. This way, you can concentrate on the message while our designers take care of providing you with the right template for the situation.

Competitor Assessment To Determine Companys Share Competitor Analysis Based On Companys Market Share Formats PDF
This slide covers the graphical representation of competitors market share. It also includes key takeaways such as market share of top competitors which is almost double of most others. Coming up with a presentation necessitates that the majority of the effort goes into the content and the message you intend to convey. The visuals of a PowerPoint presentation can only be effective if it supplements and supports the story that is being told. Keeping this in mind our experts created Competitor Assessment To Determine Companys Share Competitor Analysis Based On Companys Market Share Formats PDF to reduce the time that goes into designing the presentation. This way, you can concentrate on the message while our designers take care of providing you with the right template for the situation.
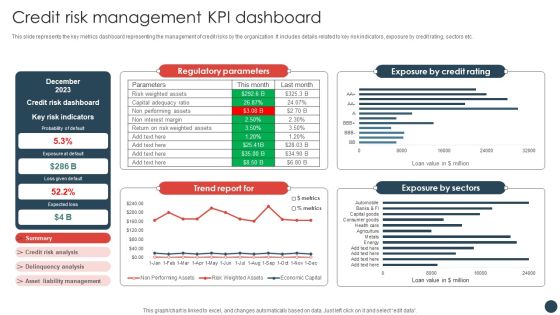
Strategic Risk Management Plan Credit Risk Management KPI Dashboard Information PDF
This slide represents the key metrics dashboard representing the management of credit risks by the organization. It includes details related to key risk indicators, exposure by credit rating, sectors etc.Coming up with a presentation necessitates that the majority of the effort goes into the content and the message you intend to convey. The visuals of a PowerPoint presentation can only be effective if it supplements and supports the story that is being told. Keeping this in mind our experts created Strategic Risk Management Plan Credit Risk Management KPI Dashboard Information PDF to reduce the time that goes into designing the presentation. This way, you can concentrate on the message while our designers take care of providing you with the right template for the situation.

Dashboard To Monitor Construction Site Injuries Construction Site Safety Plan Elements PDF
This slide showcase the dashboard to monitor workers injuries at the construction site. It includes details regarding the injuries type, severity. It also covers details of the monthly accident rate, working hours, and the count of injuries by body part. Coming up with a presentation necessitates that the majority of the effort goes into the content and the message you intend to convey. The visuals of a PowerPoint presentation can only be effective if it supplements and supports the story that is being told. Keeping this in mind our experts created Dashboard To Monitor Construction Site Injuries Construction Site Safety Plan Elements PDF to reduce the time that goes into designing the presentation. This way, you can concentrate on the message while our designers take care of providing you with the right template for the situation.

Dashboard For Tracking Customer Service Team Performance Consumer Contact Point Guide Diagrams PDF
This slide covers the KPI dashboard for analyzing the performance of client support department. It includes metrics such as first call resolution, unresolved calls, average response rate, the best day to call, average time to solve issues, etc. The Dashboard For Tracking Customer Service Team Performance Consumer Contact Point Guide Diagrams PDF is a compilation of the most recent design trends as a series of slides. It is suitable for any subject or industry presentation, containing attractive visuals and photo spots for businesses to clearly express their messages. This template contains a variety of slides for the user to input data, such as structures to contrast two elements, bullet points, and slides for written information. Slidegeeks is prepared to create an impression.
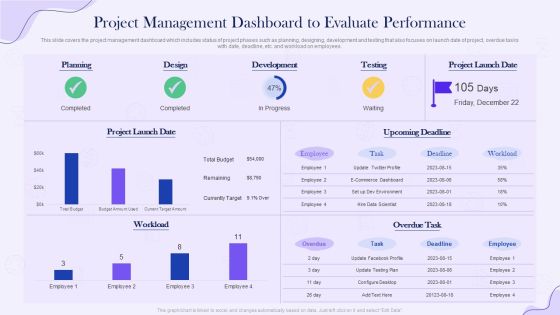
Project Time Management Execution Strategies Project Management Dashboard To Evaluate Performance Template PDF
This slide covers the project management dashboard which includes status of project phases such as planning, designing, development and testing that also focuses on launch date of project, overdue tasks with date, deadline, etc. and workload on employees. Coming up with a presentation necessitates that the majority of the effort goes into the content and the message you intend to convey. The visuals of a PowerPoint presentation can only be effective if it supplements and supports the story that is being told. Keeping this in mind our experts created Project Time Management Execution Strategies Project Management Dashboard To Evaluate Performance Template PDF to reduce the time that goes into designing the presentation. This way, you can concentrate on the message while our designers take care of providing you with the right template for the situation.

Guide To Develop And Estimate Brand Value Financial KPI Dashboard To Measure Brand Performance Formats PDF
Mentioned slide showcases KPI dashboard that can be used to check the financial performance of a brand. Metrics covered in the dashboard are return on assets, working capital ratio, return on equity etc.Coming up with a presentation necessitates that the majority of the effort goes into the content and the message you intend to convey. The visuals of a PowerPoint presentation can only be effective if it supplements and supports the story that is being told. Keeping this in mind our experts created Guide To Develop And Estimate Brand Value Financial KPI Dashboard To Measure Brand Performance Formats PDF to reduce the time that goes into designing the presentation. This way, you can concentrate on the message while our designers take care of providing you with the right template for the situation.
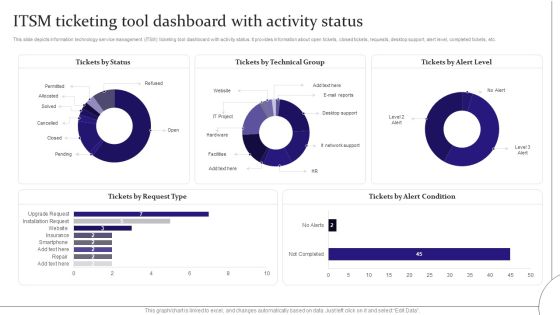
Digitalization Of Service Desk ITSM Ticketing Tool Dashboard With Activity Status Ppt Inspiration Model PDF
This slide depicts information technology service management ITSM ticketing tool dashboard with activity status. It provides information about open tickets, closed tickets, requests, desktop support, alert level, completed tickets, etc. Crafting an eye-catching presentation has never been more straightforward. Let your presentation shine with this tasteful yet straightforward Digitalization Of Service Desk ITSM Ticketing Tool Dashboard With Activity Status Ppt Inspiration Model PDF template. It offers a minimalistic and classy look that is great for making a statement. The colors have been employed intelligently to add a bit of playfulness while still remaining professional. Construct the ideal Digitalization Of Service Desk ITSM Ticketing Tool Dashboard With Activity Status Ppt Inspiration Model PDF that effortlessly grabs the attention of your audience Begin now and be certain to wow your customers.
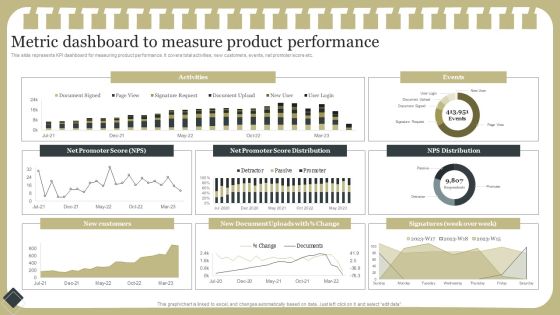
Effective Product Development Strategy Metric Dashboard To Measure Product Performance Information PDF
This slide represents KPI dashboard for measuring product performance. It covers total activities, new customers, events, net promoter score etc.Coming up with a presentation necessitates that the majority of the effort goes into the content and the message you intend to convey. The visuals of a PowerPoint presentation can only be effective if it supplements and supports the story that is being told. Keeping this in mind our experts created Effective Product Development Strategy Metric Dashboard To Measure Product Performance Information PDF to reduce the time that goes into designing the presentation. This way, you can concentrate on the message while our designers take care of providing you with the right template for the situation.

PIM Software Deployment To Enhance Conversion Rates Product Information Dashboard Representing Data Quality Statistics Download PDF
This slide represents the KPI dashboard representing PIM data quality statistics. It includes details related to top users, channels, number of entities created etc. Coming up with a presentation necessitates that the majority of the effort goes into the content and the message you intend to convey. The visuals of a PowerPoint presentation can only be effective if it supplements and supports the story that is being told. Keeping this in mind our experts created PIM Software Deployment To Enhance Conversion Rates Product Information Dashboard Representing Data Quality Statistics Download PDF to reduce the time that goes into designing the presentation. This way, you can concentrate on the message while our designers take care of providing you with the right template for the situation.
Elastic NLB Network Load Balancers Performance Tracker Dashboard Background PDF
This slide shows the dashboard for tracking the network load balancers performance by covering details of balancer status, balancer session, balancer throughput, etc. Coming up with a presentation necessitates that the majority of the effort goes into the content and the message you intend to convey. The visuals of a PowerPoint presentation can only be effective if it supplements and supports the story that is being told. Keeping this in mind our experts created Elastic NLB Network Load Balancers Performance Tracker Dashboard Background PDF to reduce the time that goes into designing the presentation. This way, you can concentrate on the message while our designers take care of providing you with the right template for the situation.

Key Performance Indicators Highlighting Current Problems Of Organization Application Deployment Project Plan Rules PDF
This slide represents the key performance indicators to track the problems faced by organization and draw effective strategies to tackle the problems. It includes key performance indicators of decline in organizational sales and customer engagement rate. Coming up with a presentation necessitates that the majority of the effort goes into the content and the message you intend to convey. The visuals of a PowerPoint presentation can only be effective if it supplements and supports the story that is being told. Keeping this in mind our experts created Key Performance Indicators Highlighting Current Problems Of Organization Application Deployment Project Plan Rules PDF to reduce the time that goes into designing the presentation. This way, you can concentrate on the message while our designers take care of providing you with the right template for the situation.

Executing Video Promotional KPI Metrics Dashboard To Evaluate Facebook Video Campaign Summary PDF
The following slide outlines a comprehensive KPI dashboard which can be used to analyze the performance of Facebook video campaign. It provides information about page video views, page video views organic etc. Coming up with a presentation necessitates that the majority of the effort goes into the content and the message you intend to convey. The visuals of a PowerPoint presentation can only be effective if it supplements and supports the story that is being told. Keeping this in mind our experts created Executing Video Promotional KPI Metrics Dashboard To Evaluate Facebook Video Campaign Summary PDF to reduce the time that goes into designing the presentation. This way, you can concentrate on the message while our designers take care of providing you with the right template for the situation.

System Deployment Project Key Performance Indicators Highlighting Current Problems Information PDF
This slide represents the key performance indicators to track the problems faced by organization and draw effective strategies to tackle the problems. It includes key performance indicators of decline in organizational sales and customer engagement rate. Coming up with a presentation necessitates that the majority of the effort goes into the content and the message you intend to convey. The visuals of a PowerPoint presentation can only be effective if it supplements and supports the story that is being told. Keeping this in mind our experts created System Deployment Project Key Performance Indicators Highlighting Current Problems Information PDF to reduce the time that goes into designing the presentation. This way, you can concentrate on the message while our designers take care of providing you with the right template for the situation.

Coca Cola Emotional Marketing Strategy Forecasting Market Share Amongst Major Brands Pictures PDF
This slide showcases projecting market share amongst major players. It provides details about compound annual growth rate CAGR, market cap, customer emotions, brand image, storytelling, product differentiation, sales volume, etc. Coming up with a presentation necessitates that the majority of the effort goes into the content and the message you intend to convey. The visuals of a PowerPoint presentation can only be effective if it supplements and supports the story that is being told. Keeping this in mind our experts created Coca Cola Emotional Marketing Strategy Forecasting Market Share Amongst Major Brands Pictures PDF to reduce the time that goes into designing the presentation. This way, you can concentrate on the message while our designers take care of providing you with the right template for the situation.
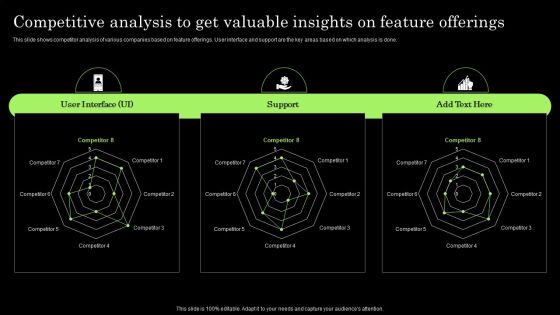
Tactical Brand Extension Launching Competitive Analysis To Get Valuable Insights Pictures PDF
This slide shows competitor analysis of various companies based on feature offerings. User interface and support are the key areas based on which analysis is done. Retrieve professionally designed Tactical Brand Extension Launching Competitive Analysis To Get Valuable Insights Pictures PDF to effectively convey your message and captivate your listeners. Save time by selecting pre-made slideshows that are appropriate for various topics, from business to educational purposes. These themes come in many different styles, from creative to corporate, and all of them are easily adjustable and can be edited quickly. Access them as PowerPoint templates or as Google Slides themes. You dont have to go on a hunt for the perfect presentation because Slidegeeks got you covered from everywhere.
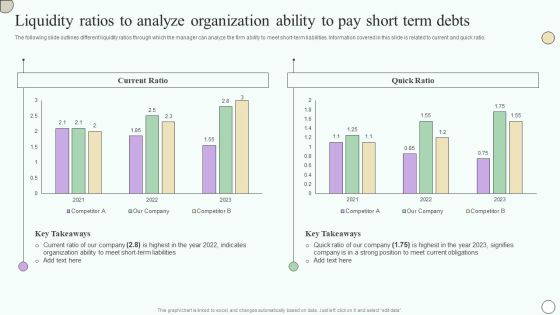
Estimating Business Overall Liquidity Ratios To Analyze Organization Ability To Pay Short Introduction PDF
The following slide outlines different liquidity ratios through which the manager can analyze the firm ability to meet short-term liabilities. Information covered in this slide is related to current and quick ratio. Coming up with a presentation necessitates that the majority of the effort goes into the content and the message you intend to convey. The visuals of a PowerPoint presentation can only be effective if it supplements and supports the story that is being told. Keeping this in mind our experts created Estimating Business Overall Liquidity Ratios To Analyze Organization Ability To Pay Short Introduction PDF to reduce the time that goes into designing the presentation. This way, you can concentrate on the message while our designers take care of providing you with the right template for the situation.

Overview Of Organizational Liquidity Ratios To Analyze Organization Ability To Pay Short Summary PDF
The following slide outlines different liquidity ratios through which the manager can analyze the firm ability to meet short-term liabilities. Information covered in this slide is related to current and quick ratio. Coming up with a presentation necessitates that the majority of the effort goes into the content and the message you intend to convey. The visuals of a PowerPoint presentation can only be effective if it supplements and supports the story that is being told. Keeping this in mind our experts created Overview Of Organizational Liquidity Ratios To Analyze Organization Ability To Pay Short Summary PDF to reduce the time that goes into designing the presentation. This way, you can concentrate on the message while our designers take care of providing you with the right template for the situation.

Food Organization Financial Trends Customer Survey Results For Eating At Restaurant Formats PDF
The slide highlights the survey results of customers to illustrate the attitude of people preferring restaurant for eating. The reasons selected by most customers are enjoyable experience, leisure time, and life style. Coming up with a presentation necessitates that the majority of the effort goes into the content and the message you intend to convey. The visuals of a PowerPoint presentation can only be effective if it supplements and supports the story that is being told. Keeping this in mind our experts created Food Organization Financial Trends Customer Survey Results For Eating At Restaurant Formats PDF to reduce the time that goes into designing the presentation. This way, you can concentrate on the message while our designers take care of providing you with the right template for the situation.
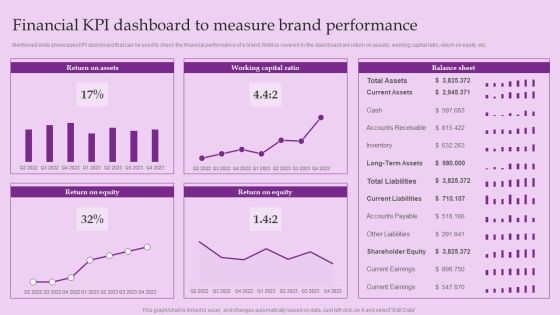
Financial KPI Dashboard To Measure Brand Performance Brand And Equity Evaluation Techniques Elements PDF
Mentioned slide showcases KPI dashboard that can be used to check the financial performance of a brand. Metrics covered in the dashboard are return on assets, working capital ratio, return on equity etc.Coming up with a presentation necessitates that the majority of the effort goes into the content and the message you intend to convey. The visuals of a PowerPoint presentation can only be effective if it supplements and supports the story that is being told. Keeping this in mind our experts created Financial KPI Dashboard To Measure Brand Performance Brand And Equity Evaluation Techniques Elements PDF to reduce the time that goes into designing the presentation. This way, you can concentrate on the message while our designers take care of providing you with the right template for the situation.
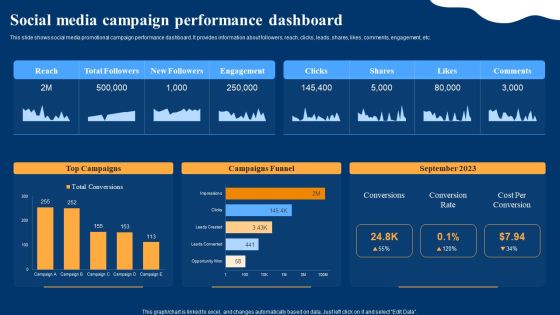
Optimizing Social Networks Social Media Campaign Performance Dashboard Guidelines PDF
This slide shows social media promotional campaign performance dashboard. It provides information about followers, reach, clicks, leads, shares, likes, comments, engagement, etc. Coming up with a presentation necessitates that the majority of the effort goes into the content and the message you intend to convey. The visuals of a PowerPoint presentation can only be effective if it supplements and supports the story that is being told. Keeping this in mind our experts created Optimizing Social Networks Social Media Campaign Performance Dashboard Guidelines PDF to reduce the time that goes into designing the presentation. This way, you can concentrate on the message while our designers take care of providing you with the right template for the situation.
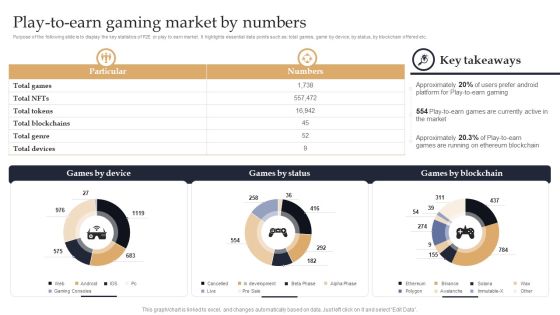
Web 3 0 Blockchain Based P2E Mobile Game Sector Report Promotional Plan Play To Earn Gaming Market By Numbers Summary PDF
Purpose of the following slide is to display the key statistics of P2E or play to earn market. It highlights essential data points such as total games, game by device, by status, by blockchain offered etc. Coming up with a presentation necessitates that the majority of the effort goes into the content and the message you intend to convey. The visuals of a PowerPoint presentation can only be effective if it supplements and supports the story that is being told. Keeping this in mind our experts created Web 3 0 Blockchain Based P2E Mobile Game Sector Report Promotional Plan Play To Earn Gaming Market By Numbers Summary PDF to reduce the time that goes into designing the presentation. This way, you can concentrate on the message while our designers take care of providing you with the right template for the situation.
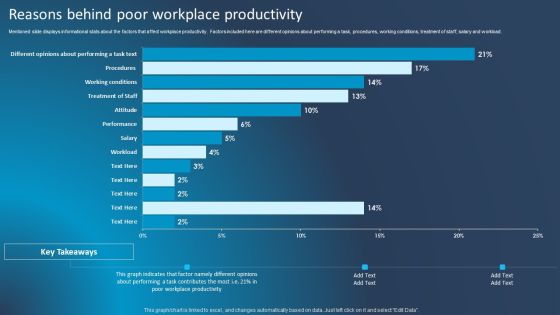
Improving Corporate Performance Reasons Behind Poor Workplace Productivity Designs PDF
Mentioned slide displays informational stats about the factors that affect workplace productivity. Factors included here are different opinions about performing a task, procedures, working conditions, treatment of staff, salary and workload. Coming up with a presentation necessitates that the majority of the effort goes into the content and the message you intend to convey. The visuals of a PowerPoint presentation can only be effective if it supplements and supports the story that is being told. Keeping this in mind our experts created Improving Corporate Performance Reasons Behind Poor Workplace Productivity Designs PDF to reduce the time that goes into designing the presentation. This way, you can concentrate on the message while our designers take care of providing you with the right template for the situation.

Increasing Customer Impact Of Good Customer Experience On Loyalty Slides PDF
This slide covers the graphical representation of the effect of excellent support services on customer loyalty. It impacts the percentage of customers likely to purchase more, recommend the company, forgive a bad experience, etc. Slidegeeks has constructed Increasing Customer Impact Of Good Customer Experience On Loyalty Slides PDF after conducting extensive research and examination. These presentation templates are constantly being generated and modified based on user preferences and critiques from editors. Here, you will find the most attractive templates for a range of purposes while taking into account ratings and remarks from users regarding the content. This is an excellent jumping-off point to explore our content and will give new users an insight into our top-notch PowerPoint Templates.

Strengthening Brand Performance Metrics Dashboard To Track Overall Rebranding Themes PDF
This slide provides information regarding essential characteristics of co-branding in terms of strategic partnership, build credibility, developing marketing strategy, develop innovation and value addition, etc. Coming up with a presentation necessitates that the majority of the effort goes into the content and the message you intend to convey. The visuals of a PowerPoint presentation can only be effective if it supplements and supports the story that is being told. Keeping this in mind our experts created Strengthening Brand Performance Metrics Dashboard To Track Overall Rebranding Themes PDF to reduce the time that goes into designing the presentation. This way, you can concentrate on the message while our designers take care of providing you with the right template for the situation.

Deploying AI To Enhance Global Big Data Analytics In Manufacturing Industry Market Professional PDF
This slide describes the global big data analytics in the manufacturing industry market, including CAGR rate, North Americas share in the market, year-over-year growth, market value in 2020, and growth of the solution category by 2028. Coming up with a presentation necessitates that the majority of the effort goes into the content and the message you intend to convey. The visuals of a PowerPoint presentation can only be effective if it supplements and supports the story that is being told. Keeping this in mind our experts created Deploying AI To Enhance Global Big Data Analytics In Manufacturing Industry Market Professional PDF to reduce the time that goes into designing the presentation. This way, you can concentrate on the message while our designers take care of providing you with the right template for the situation.
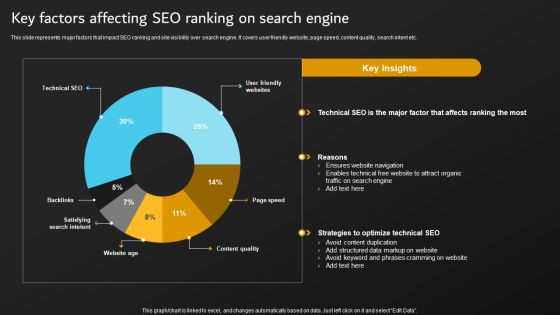
Implementation Of Digital Marketing Key Factors Affecting SEO Ranking On Search Summary PDF
This slide represents major factors that impact SEO ranking and site visibility over search engine. It covers user friendly website, page speed, content quality, search intent etc. Coming up with a presentation necessitates that the majority of the effort goes into the content and the message you intend to convey. The visuals of a PowerPoint presentation can only be effective if it supplements and supports the story that is being told. Keeping this in mind our experts created Implementation Of Digital Marketing Key Factors Affecting SEO Ranking On Search Summary PDF to reduce the time that goes into designing the presentation. This way, you can concentrate on the message while our designers take care of providing you with the right template for the situation.
