Cost Analysis

Data Collection Scatter Diagram Ppt PowerPoint Presentation Summary Deck
This is a data collection scatter diagram ppt powerpoint presentation summary deck. This is a three stage process. The stages in this process are business, marketing, strategy, finance, analysis.
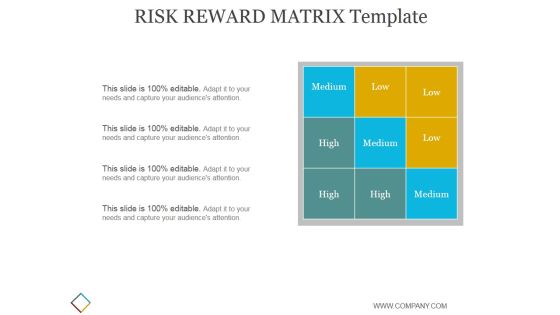
Risk Reward Matrix Template 2 Ppt PowerPoint Presentation Good
This is a risk reward matrix template 2 ppt powerpoint presentation good. This is a three stage process. The stages in this process are business, strategy, marketing, analysis, finance.
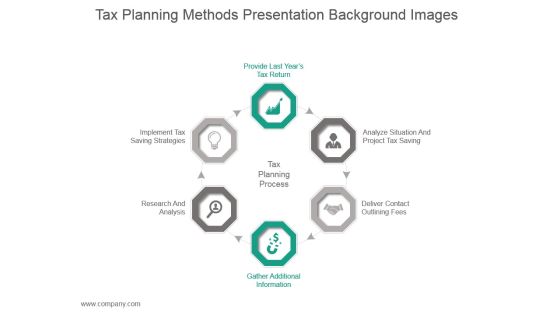
Tax Planning Methods Presentation Background Images
This is a tax planning methods presentation background images. This is a six stage process. The stages in this process are provide last years tax return, analyze situation and project tax saving, deliver contact outlining fees, tax planning process, implement tax saving strategies, research and analysis, gather additional information.

Business Framework Creative Funnel Diagram PowerPoint Presentation
This innovative image slide has been designed with graphic of business strategies in funnel. This business framework template may be used in your presentations to display business strategy analysis. This image slide will enhance the quality of your presentations.

Stock Photo Bar Graph With Cubes For Financial Data PowerPoint Slide
Graphic of bar graph and cubes are used to decorate this image template. This PPT contains the concept of financial data analysis. Use this PPT for finance and business related presentations.

Big Data Opportunities And Challenges Template 2 Ppt PowerPoint Presentation Summary
This is a big data opportunities and challenges template 2 ppt powerpoint presentation summary. This is a three stage process. The stages in this process are business, donut, marketing, finance, strategy, analysis, success.

Big Data Opportunities And Challenges Template 1 Ppt PowerPoint Presentation Infographic Template Summary
This is a big data opportunities and challenges template 1 ppt powerpoint presentation infographic template summary. This is a three stage process. The stages in this process are business, pie chart, finance, marketing, analysis, strategy.
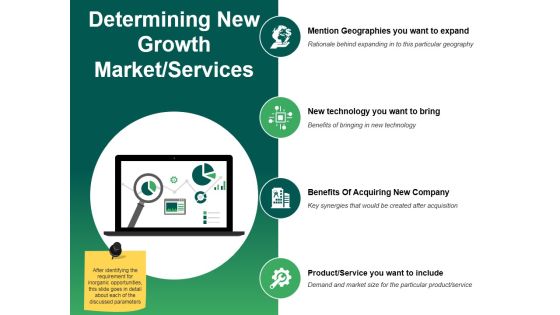
Determining New Growth Market Services Ppt PowerPoint Presentation Layouts Clipart Images
This is a determining new growth market services ppt powerpoint presentation layouts clipart images. This is a four stage process. The stages in this process are analysis, finance, server, business, marketing.

Bar Graph For Marketing Research Process Powerpoint Slides
This PowerPoint template has been designed with diagram of bar graph. This PPT slide can be used to prepare presentations for profit growth report and also for financial data analysis. You can download finance PowerPoint template to prepare awesome presentations.

Circle Diagram For Business Marketing Mix Powerpoint Slides
This PowerPoint template has been designed with nine steps circle chart. This PPT slide can be used to prepare presentations for profit growth report and also for financial data analysis. You can download finance PowerPoint template to prepare awesome presentations.

Test Tubes With Percentage Data For Comparison Powerpoint Slides
This PowerPoint template has been designed with test tubes and percentage data. You may download this PPT slide to display data comparison and analysis. Add this slide to your presentation and impress your superiors.
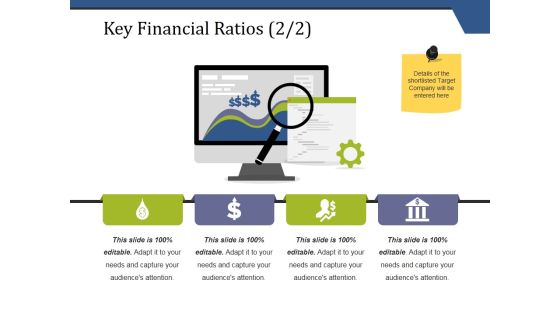
Key Financial Ratios Template 2 Ppt PowerPoint Presentation Pictures Styles
This is a key financial ratios template 2 ppt powerpoint presentation pictures styles. This is a four stage process. The stages in this process are business, finance, analysis, computer, technology, knowledge.
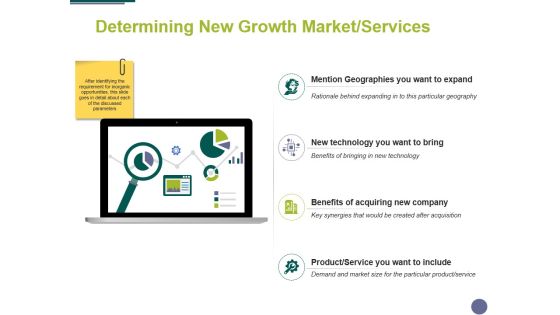
Determining New Growth Market Services Ppt PowerPoint Presentation Portfolio Topics
This is a determining new growth market services ppt powerpoint presentation portfolio topics. This is a four stage process. The stages in this process are server, analysis, finance, marketing, business.

Data Collection Histograms Ppt PowerPoint Presentation Icon Slides
This is a data collection histograms ppt powerpoint presentation icon slides. This is a two stage process. The stages in this process are bar chart, finance, marketing, business, analysis.
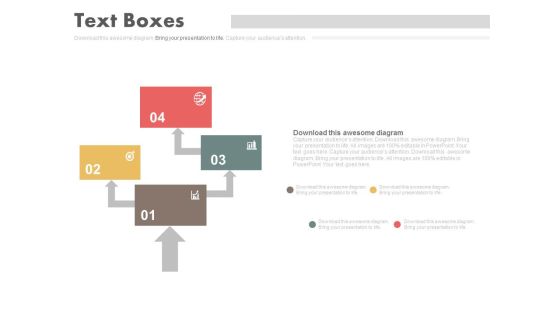
Four Steps Arrow Chart Design Powerpoint Slides
This PowerPoint template has been designed with four steps arrow chart. This PPT slide can be used to prepare presentations for marketing reports and also for financial data analysis. You can download finance PowerPoint template to prepare awesome presentations.

Pyramid For Financial Accounting Information Powerpoint Slides
This PowerPoint template has been designed with graphics of pyramid chart. This PPT slide can be used to prepare presentations for profit growth report and also for financial data analysis. You can download finance PowerPoint template to prepare awesome presentations.

Determining New Growth Market Services Ppt PowerPoint Presentation Ideas
This is a determining new growth market services ppt powerpoint presentation ideas. This is a four stage process. The stages in this process are business, computer, icons, marketing, strategy, analysis, finance.

7S Model Mckinsey Interne Analyses Ppt PowerPoint Presentation Complete Deck With Slides
This is a 7s model mckinsey interne analyses ppt powerpoint presentation complete deck with slides. This is a one stage process. The stages in this process are business, strategy, business, analysis, finance, marketing, work management.

Sales Rep Performance Scorecard Ppt PowerPoint Presentation Infographic Template Master Slide
This is a sales rep performance scorecard ppt powerpoint presentation infographic template master slide. This is a four stage process. The stages in this process are overall territory performance, finance, analysis, marketing, business.

Capital Asset Expenditure Ppt PowerPoint Presentation Complete Deck With Slides
This is a capital asset expenditure ppt powerpoint presentation complete deck with slides. This is a one stage process. The stages in this process are finance, analysis, marketing, business, strategy.

Property Plant And Equipment Expenditure Ppt PowerPoint Presentation Complete Deck With Slides
This is a property plant and equipment expenditure ppt powerpoint presentation complete deck with slides. This is a one stage process. The stages in this process are business, finance, analysis, property, plant.

Business Diagram Thermometer Graphics Indicating Progress Presentation Template
This power point template diagram has been designed with graphic of thermometer and bar graph. This PPT contains the concept of growth analysis. Use this PPT for business and marketing related presentations.
Investor Pitch Startup Ppt PowerPoint Presentation Complete Deck With Slides
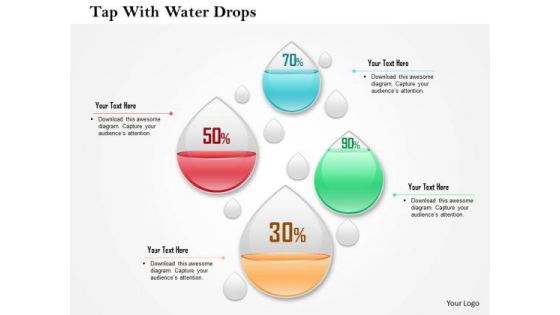
Business Diagram Four Water Drops With Percentage Values Presentation Template
This business diagram has been designed with graphic of four water drops and percentage values. This slide may be used to display percentage values for business analysis. Use this editable diagram for finance and business related presentations.
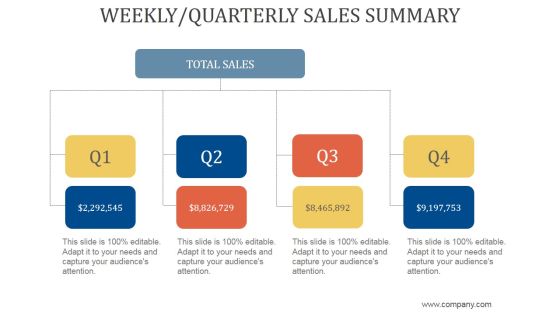
Weekly Quarterly Sales Summary Ppt PowerPoint Presentation Show
This is a weekly quarterly sales summary ppt powerpoint presentation show. This is a four stage process. The stages in this process are business, strategy, marketing, analysis, finance, arrow.
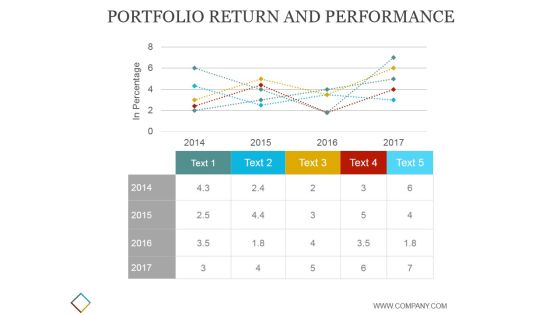
Portfolio Return And Performance Template Ppt PowerPoint Presentation Visuals
This is a portfolio return and performance template ppt powerpoint presentation visuals. This is a five stage process. The stages in this process are business, strategy, marketing, analysis, finance, chart and graph, growth.

Lean Project Management Ppt PowerPoint Presentation Complete Deck With Slides
This is a lean project management ppt powerpoint presentation complete deck with slides. This is a one stage process. The stages in this process are business, strategy, finance, analysis, project management, chart and graph.

Stacked Column Template 2 Ppt PowerPoint Presentation Visuals
This is a stacked column template 2 ppt powerpoint presentation visuals. This is a twelve stage process. The stages in this process are business, marketing, analysis, sales in percentage, finance, growth strategy.
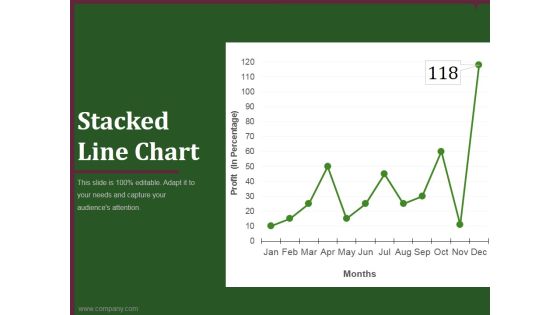
Stacked Line Chart Ppt PowerPoint Presentation Background Image
This is a stacked line chart ppt powerpoint presentation background image. This is a twelve stage process. The stages in this process are business, marketing, analysis, finance, growth strategy.
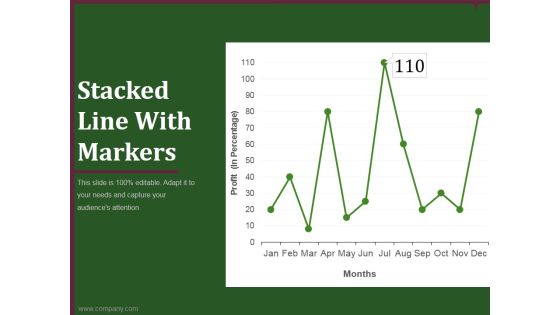
Stacked Line With Markers Template 1 Ppt PowerPoint Presentation Deck
This is a stacked line with markers template 1 ppt powerpoint presentation deck. This is a twelve stage process. The stages in this process are business, marketing, analysis, finance, growth strategy.

Brand Performance Dashboard Template 1 Ppt PowerPoint Presentation Layouts
This is a brand performance dashboard template 1 ppt powerpoint presentation layouts. This is a five stage process. The stages in this process are business, marketing, strategy, finance, analysis.

Stacked Line Chart Ppt PowerPoint Presentation Shapes
This is a stacked line chart ppt powerpoint presentation shapes. This is a two stage process. The stages in this process are product, profit in thousands, finance, analysis, growth.
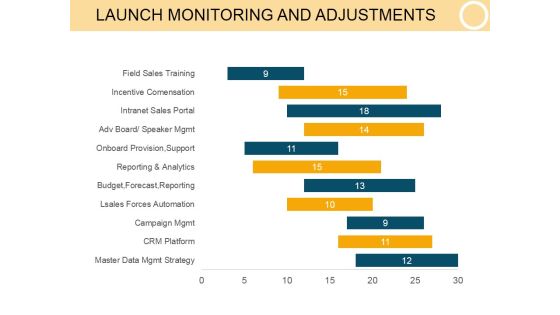
Launch Monitoring And Adjustments Template 1 Ppt PowerPoint Presentation Layout
This is a launch monitoring and adjustments template 1 ppt powerpoint presentation layout. This is a eleven stage process. The stages in this process are business, finance, marketing, strategy, analysis, success.

Column Chart Ppt PowerPoint Presentation Background Designs
This is a column chart ppt powerpoint presentation background designs. This is a two stage process. The stages in this process are bar graph, finance, marketing, strategy, analysis, business.

Scatter Bubble Chart Ppt PowerPoint Presentation Backgrounds
This is a scatter bubble chart ppt powerpoint presentation backgrounds. This is a one stage process. The stages in this process are bubble chart, finance, marketing, analysis, strategy, business.

Combo Chart Ppt PowerPoint Presentation Ideas Outfit
This is a combo chart ppt powerpoint presentation ideas outfit. This is a four stage process. The stages in this process are combo chart, finance, analysis, marketing, strategy, business.

Crm Dashboard Current Lead Status Ppt PowerPoint Presentation Infographic Template Visual Aids
This is a crm dashboard current lead status ppt powerpoint presentation infographic template visual aids. This is a six stage process. The stages in this process are bar graph, finance, marketing, strategy, business, analysis.

Crm Dashboard Deals By Expected Close Date Ppt PowerPoint Presentation Portfolio Icons
This is a crm dashboard deals by expected close date ppt powerpoint presentation portfolio icons. This is a three stage process. The stages in this process are bar graph, finance, marketing, strategy, business, analysis, growth.

Crm Dashboard Top Customers Ppt PowerPoint Presentation Styles Designs
This is a crm dashboard top customers ppt powerpoint presentation styles designs. This is a ten stage process. The stages in this process are business, customer, finance, bar graph, marketing, strategy, analysis.

Scatter Chart Ppt PowerPoint Presentation Pictures Slide Download
This is a scatter chart ppt powerpoint presentation pictures slide download. This is a two stage process. The stages in this process are scatter chart, finance, analysis, marketing, business.

Competency Rating Template 2 Ppt PowerPoint Presentation Summary Templates
This is a competency rating template 2 ppt powerpoint presentation summary templates. This is a eight stage process. The stages in this process are business, finance, marketing, strategy, analysis.
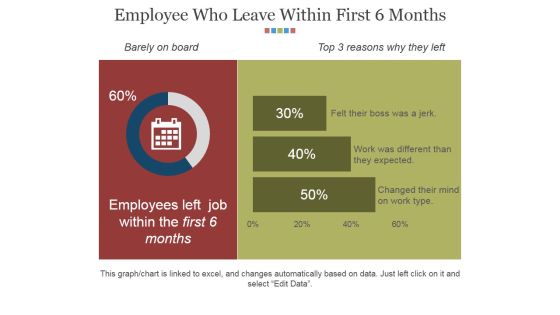
Employee Who Leave Within First 6 Months Ppt PowerPoint Presentation Gallery Grid
This is a employee who leave within first 6 months ppt powerpoint presentation gallery grid. This is a two stage process. The stages in this process are business, finance, marketing, strategy, analysis.

Bar Graph Ppt PowerPoint Presentation Slides Background Image
This is a bar graph ppt powerpoint presentation slides background image. This is a six stage process. The stages in this process are bar graph, finance, marketing, analysis, business.
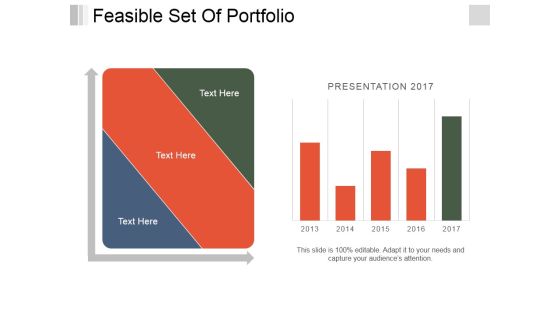
Feasible Set Of Portfolio Ppt PowerPoint Presentation Pictures Layouts
This is a feasible set of portfolio ppt powerpoint presentation pictures layouts. This is a two stage process. The stages in this process are business, finance, growth, marketing, strategy, analysis.
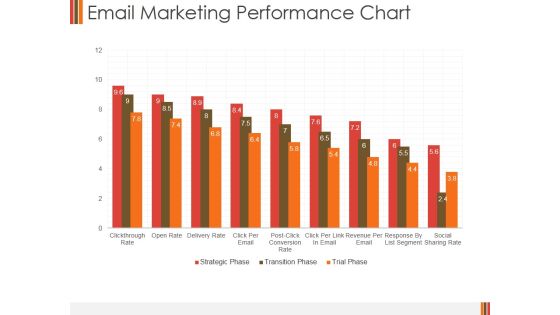
Email Marketing Performance Chart Ppt PowerPoint Presentation Portfolio Inspiration
This is a email marketing performance chart ppt powerpoint presentation portfolio inspiration. This is a nine stage process. The stages in this process are business, finance, marketing, performance chart, strategy, analysis.

Dashboard Ppt PowerPoint Presentation Infographic Template Graphics Design
This is a dashboard ppt powerpoint presentation infographic template graphics design. This is a three stage process. The stages in this process are business, strategy, marketing, analysis, finance, dashboard.

Our Charts And Graphs Ppt PowerPoint Presentation File Visuals
This is a our charts and graphs ppt powerpoint presentation file visuals. This is a one stage process. The stages in this process are business, strategy, marketing, analysis, finance.

Compare Work Performance In Ppt PowerPoint Presentation Infographic Template Graphics Template
This is a compare work performance in ppt powerpoint presentation infographic template graphics template. This is a two stage process. The stages in this process are business, management, finance, marketing, strategy, analysis, compare.

Donut Pie Chart Ppt PowerPoint Presentation Summary Guide
This is a donut pie chart ppt powerpoint presentation summary guide. This is a four stage process. The stages in this process are pie chart, marketing, strategy, finance, analysis, business.

Clustered Column Line Ppt PowerPoint Presentation Slides Ideas
This is a clustered column line ppt powerpoint presentation slides ideas. This is a four stage process. The stages in this process are business, finance, marketing, strategy, analysis, success.

Bar Graph Ppt PowerPoint Presentation Infographics Slide Download
This is a bar graph ppt powerpoint presentation infographics slide download. This is a four stage process. The stages in this process are bar graph, finance, marketing, strategy, analysis.
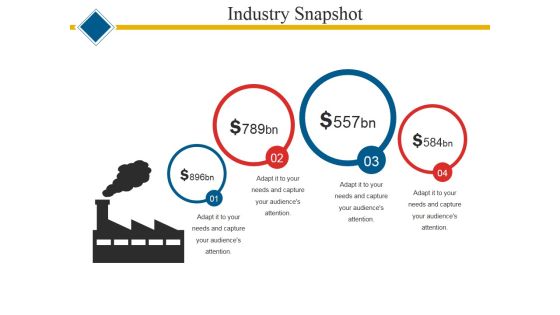
Industry Snapshot Template 1 Ppt PowerPoint Presentation Professional Templates
This is a industry snapshot template 1 ppt powerpoint presentation professional templates. This is a four stage process. The stages in this process are business, finance, marketing, strategy, analysis.

Market Insights Template 1 Ppt PowerPoint Presentation Show Brochure
This is a market insights template 1 ppt powerpoint presentation show brochure. This is a three stage process. The stages in this process are business, finance, marketing, analysis, growth.

Gap Between Current And Required Staff Ppt PowerPoint Presentation Infographic Template Microsoft
This is a gap between current and required staff ppt powerpoint presentation infographic template microsoft. This is a five stage process. The stages in this process are business, bar graph, finance, marketing, strategy, analysis.
Underlying Magic Ppt PowerPoint Presentation Icon Template
This is a underlying magic ppt powerpoint presentation icon template. This is a one stage process. The stages in this process are underlying magic, currency, finance, marketing, analysis, business.
Financial Highlights Ppt PowerPoint Presentation Icon Slide Download
This is a financial highlights ppt powerpoint presentation icon slide download. This is a three stage process. The stages in this process are percentage, business, strategy, management, finance, analysis.

Principles For Judging The Alternatives Ppt PowerPoint Presentation Layouts Graphic Tips
This is a principles for judging the alternatives ppt powerpoint presentation layouts graphic tips. This is a two stage process. The stages in this process are business, finance, marketing, strategy, analysis.

Bar Graph Ppt PowerPoint Presentation Pictures Tips
This is a bar graph ppt powerpoint presentation pictures tips. This is a five stage process. The stages in this process are bar graph, finance, marketing, strategy, analysis, business.

Bar Graph Ppt PowerPoint Presentation Infographic Template Graphics
This is a bar graph ppt powerpoint presentation infographic template graphics. This is a five stage process. The stages in this process are bar graph, finance, marketing, strategy, analysis, business.
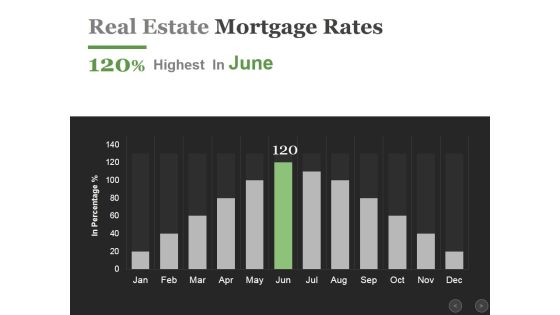
Real Estate Mortgage Rates Ppt PowerPoint Presentation Infographics Influencers
This is a real estate mortgage rates ppt powerpoint presentation infographics influencers. This is a twelve stage process. The stages in this process are business, finance, marketing, analysis, growth.


 Continue with Email

 Home
Home


