AI PPT Maker
Templates
PPT Bundles
Design Services
Business PPTs
Business Plan
Management
Strategy
Introduction PPT
Roadmap
Self Introduction
Timelines
Process
Marketing
Agenda
Technology
Medical
Startup Business Plan
Cyber Security
Dashboards
SWOT
Proposals
Education
Pitch Deck
Digital Marketing
KPIs
Project Management
Product Management
Artificial Intelligence
Target Market
Communication
Supply Chain
Google Slides
Research Services
 One Pagers
All Categories
-
Home
- Customer Favorites
- Cost Analysis Dashboard
Cost Analysis Dashboard

Warehouse Management System Wms Dashboard Sample PDF
The purpose of this slide is to provide a glimpse of the problems faced by our logistic company at present such as fuel costs, lack of technology, government regulations, inventory management etc. Deliver an awe-inspiring pitch with this creative warehouse management system wms dashboard sample pdf. bundle. Topics like order status graph, active pickers, warehouse capacity, warehouse status can be discussed with this completely editable template. It is available for immediate download depending on the needs and requirements of the user.

Advanced Technology Vehicle Dashboard Guidelines PDF
Deliver and pitch your topic in the best possible manner with this advanced technology vehicle dashboard guidelines pdf. Use them to share invaluable insights on advanced technology vehicle dashboard and impress your audience. This template can be altered and modified as per your expectations. So, grab it now.
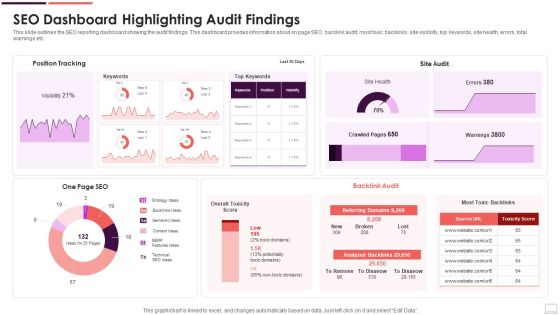
SEO Dashboard Highlighting Audit Findings Mockup PDF
This slide outlines the SEO reporting dashboard showing the audit findings. This dashboard provides information about on page SEO, backlink audit, most toxic backlinks, site visibility, top keywords, site health, errors, total warnings etc. Pitch your topic with ease and precision using this SEO Dashboard Highlighting Audit Findings Mockup PDF. This layout presents information on Strategy Ideas, Backlinks Ideas, Semantic Ideas. It is also available for immediate download and adjustment. So, changes can be made in the color, design, graphics or any other component to create a unique layout.
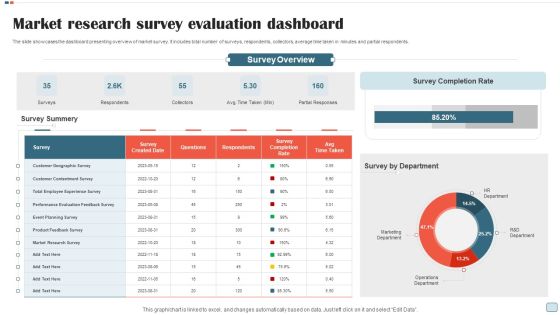
Market Research Survey Evaluation Dashboard Graphics PDF
The slide showcases the dashboard presenting overview of market survey. It includes total number of surveys, respondents, collectors, average time taken in minutes and partial respondents. Showcasing this set of slides titled Market Research Survey Evaluation Dashboard Graphics PDF. The topics addressed in these templates are Surveys, Respondents, Collectors, Partial Responses. All the content presented in this PPT design is completely editable. Download it and make adjustments in color, background, font etc. as per your unique business setting.

Email Marketing Dashboard Ppt Examples Professional
This is a email marketing dashboard ppt examples professional. This is a three stage process. The stages in this process are manage control list, report, schedules email queue, signup forma and surveys, setting.
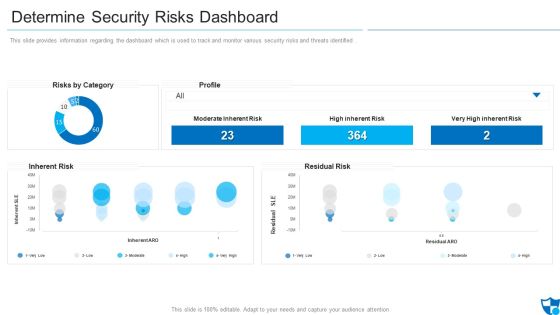
Determine Security Risks Dashboard Introduction PDF
This slide provides information regarding the dashboard which is used to track and monitor various security risks and threats identified.Deliver and pitch your topic in the best possible manner with this determine security risks dashboard introduction pdf. Use them to share invaluable insights on moderate inherent risk, high inherent risk, very high inherent risk and impress your audience. This template can be altered and modified as per your expectations. So, grab it now.

Call Center Performance KPI Dashboard Formats PDF
This slide covers contact center performance metrics KPI dashboard. It involves details such as number of total calls, average answer speed, abandon rate, data of agents performance and call abandon rate by departments. Showcasing this set of slides titled Call Center Performance KPI Dashboard Formats PDF. The topics addressed in these templates are Department, Dashboard, Agreement Limits. All the content presented in this PPT design is completely editable. Download it and make adjustments in color, background, font etc. as per your unique business setting.

Data Quality Elements Management Dashboard Download PDF
This slide showcases dashboard for real- time monitoring of data quality dimensions for organization. It further includes KPIs such as accuracy, completeness, consistency, integrity, timeliness, etc. Showcasing this set of slides titled Data Quality Elements Management Dashboard Download PDF. The topics addressed in these templates are Quality Dimensions, Accuracy, Completeness, Consistency, Integrity, Timeliness. All the content presented in this PPT design is completely editable. Download it and make adjustments in color, background, font etc. as per your unique business setting.

Kpi Dashboard Framework Ppt Powerpoint Slide Images
This is a kpi dashboard framework ppt powerpoint slide images. This is a five stage process. The stages in this process are business metrics, customer metrics, operational metrics, channel metrics, marketing metrics.
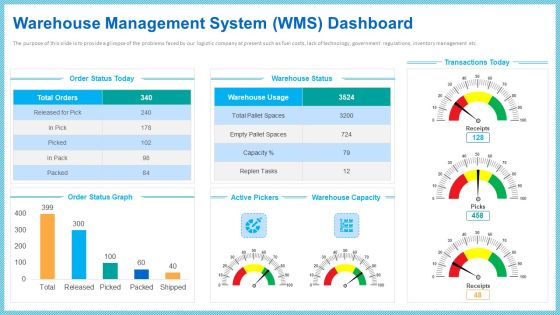
Warehouse Management System Wms Dashboard Mockup PDF
The purpose of this slide is to provide a glimpse of the problems faced by our logistic company at present such as fuel costs, lack of technology, government regulations, inventory management etc. Deliver and pitch your topic in the best possible manner with this warehouse management system wms dashboard mockup pdf. Use them to share invaluable insights on order status graph, warehouse capacity, warehouse status and impress your audience. This template can be altered and modified as per your expectations. So, grab it now.

Risk Metrics Dashboard Showing Priorities Infographics PDF
This slide illustrates graphical representation of corporate risk data. It includes monthly risks with their priorities, and risk summary quarter wise. Showcasing this set of slides titled Risk Metrics Dashboard Showing Priorities Infographics PDF. The topics addressed in these templates are Risk Metrics Dashboard Showing Priorities. All the content presented in this PPT design is completely editable. Download it and make adjustments in color, background, font etc. as per your unique business setting.
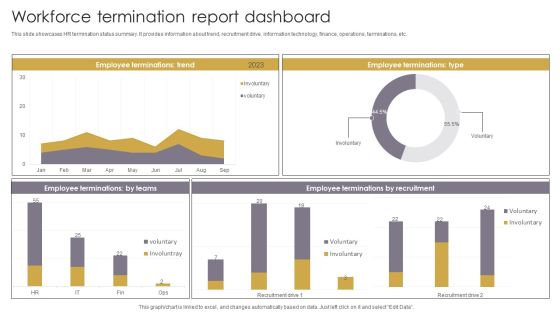
Workforce Termination Report Dashboard Professional PDF
This slide showcases HR termination status summary. It provides information about trend, recruitment drive, information technology, finance, operations, terminations, etc. Showcasing this set of slides titled Workforce Termination Report Dashboard Professional PDF. The topics addressed in these templates are Workforce Termination, Report Dashboard. All the content presented in this PPT design is completely editable. Download it and make adjustments in color, background, font etc. as per your unique business setting.

Information Technology Project Management Dashboard Formats PDF
This slide shows information technology project management dashboard which can be referred by companies looking for efficient outlining and execution of project tasks. It contains information about planning, design, development, testing, project budget, overdue tasks, workload, tasks and deadlines. Showcasing this set of slides titled Information Technology Project Management Dashboard Formats PDF. The topics addressed in these templates are Project Budget Workload, Planning Design Development, Upcoming Deadlines Testing. All the content presented in this PPT design is completely editable. Download it and make adjustments in color, background, font etc. as per your unique business setting.

Project Metrics Dashboard With Stages Download PDF
This slide shows the project management dashboard which includes start and end date if project, its duration, status of the project, key project links and project stages with metrics such as proposal, kick off, discovery, actions, optimization , etc. Pitch your topic with ease and precision using this Project Metrics Dashboard With Stages Download PDF. This layout presents information on Economic, Project Plan, Execution. It is also available for immediate download and adjustment. So, changes can be made in the color, design, graphics or any other component to create a unique layout.
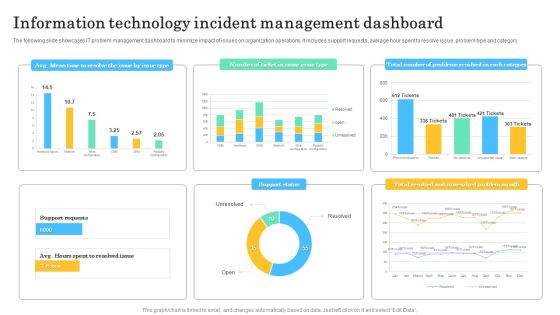
Information Technology Incident Management Dashboard Infographics PDF
The following slide showcases IT problem management dashboard to minimize impact of issues on organization operations. It includes support requests, average hour spent to resolve issue, problem type and category. Showcasing this set of slides titled Information Technology Incident Management Dashboard Infographics PDF. The topics addressed in these templates are Avg Mean Time, Resolve The Issue, Issue Type. All the content presented in this PPT design is completely editable. Download it and make adjustments in color, background, font etc. as per your unique business setting.
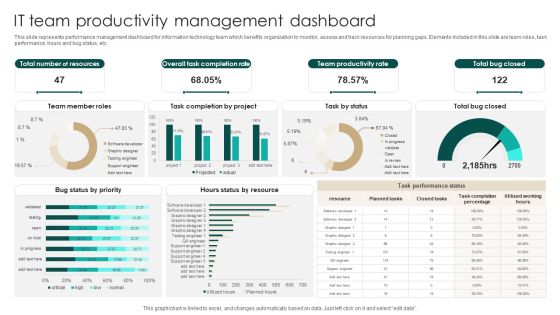
IT Team Productivity Management Dashboard Introduction PDF
This slide represents performance management dashboard for information technology team which benefits organization to monitor, assess and track resources for planning gaps. Elements included in this slide are team roles, task performance, hours and bug status, etc. Pitch your topic with ease and precision using this IT Team Productivity Management Dashboard Introduction PDF. This layout presents information on Total Number Resources, Overall Task Completion Rate, Team Productivity Rate. It is also available for immediate download and adjustment. So, changes can be made in the color, design, graphics or any other component to create a unique layout.
Overall Brand Performance Tracking Dashboard Microsoft PDF
This slide provides information regarding brand performance tracking dashboard capturing KPIs such as brand metric, brand commitment, advertising metrics, and purchase metrics. Slidegeeks is here to make your presentations a breeze with Overall Brand Performance Tracking Dashboard Microsoft PDF With our easy to use and customizable templates, you can focus on delivering your ideas rather than worrying about formatting. With a variety of designs to choose from, you are sure to find one that suits your needs. And with animations and unique photos, illustrations, and fonts, you can make your presentation pop. So whether you are giving a sales pitch or presenting to the board, make sure to check out Slidegeeks first.

Corporate Financial Performance Tracking Dashboard Diagrams PDF
This slide provides information regarding dashboard utilized by firm to monitor financial performance. The performance is tracked through revenues generated, vendors associated, profit generated, etc. If you are looking for a format to display your unique thoughts, then the professionally designed Corporate Financial Performance Tracking Dashboard Diagrams PDF is the one for you. You can use it as a Google Slides template or a PowerPoint template. Incorporate impressive visuals, symbols, images, and other charts. Modify or reorganize the text boxes as you desire. Experiment with shade schemes and font pairings. Alter, share or cooperate with other people on your work. Download Corporate Financial Performance Tracking Dashboard Diagrams PDF and find out how to give a successful presentation. Present a perfect display to your team and make your presentation unforgettable.

Employee Satisfaction Score Monitoring Dashboard Structure PDF
This slide showcases a dashboard presenting various metrics to measure and analyze employee overall satisfaction rate. It outlines information of employee net promoter score, employee retention and employee absenteeism. Find highly impressive Employee Satisfaction Score Monitoring Dashboard Structure PDF on Slidegeeks to deliver a meaningful presentation. You can save an ample amount of time using these presentation templates. No need to worry to prepare everything from scratch because Slidegeeks experts have already done a huge research and work for you. You need to download Employee Satisfaction Score Monitoring Dashboard Structure PDF for your upcoming presentation. All the presentation templates are 100 percent editable and you can change the color and personalize the content accordingly. Download now.
Several Brands Performance Tracking Dashboard Designs PDF
This slide provides information regarding different brands performance tracking dashboard in terms positive or negative mentions, sources, etc. The Several Brands Performance Tracking Dashboard Designs PDF is a compilation of the most recent design trends as a series of slides. It is suitable for any subject or industry presentation, containing attractive visuals and photo spots for businesses to clearly express their messages. This template contains a variety of slides for the user to input data, such as structures to contrast two elements, bullet points, and slides for written information. Slidegeeks is prepared to create an impression.
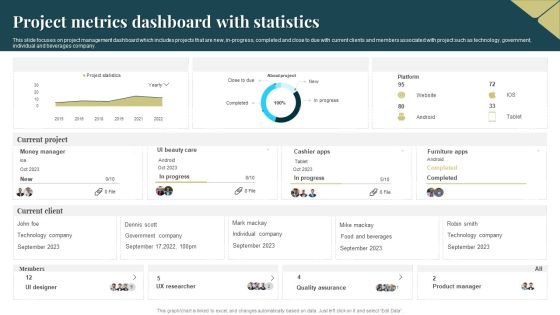
Project Metrics Dashboard With Statistics Slides PDF
This slide focuses on project management dashboard which includes projects that are new, in progress, completed and close to due with current clients and members associated with project such as technology, government, individual and beverages company. Showcasing this set of slides titled Project Metrics Dashboard With Statistics Slides PDF. The topics addressed in these templates are Quality Assurance, Product Manager, Technology. All the content presented in this PPT design is completely editable. Download it and make adjustments in color, background, font etc. as per your unique business setting.

Data Dashboard Diagram Presentation Powerpoint Example
This is a data dashboard diagram presentation powerpoint example. This is a seven stage process. The stages in this process are root cause, incident trends and their status, contributing cause, incident by category and severity, incident by category, incident by facilities, incident severity by.
Project Tracking And Evaluation Dashboard Portrait PDF
This slide illustrates graphical representation and facts and figures relating to project management data. It includes budget by employee, overdue tasks, workload charts etc. Pitch your topic with ease and precision using this Project Tracking And Evaluation Dashboard Portrait PDF. This layout presents information on Employee Budget, Target, Design, Development. It is also available for immediate download and adjustment. So, changes can be made in the color, design, graphics or any other component to create a unique layout.
Workforce Productivity Tracking Report Dashboard Background PDF
The given below slide depicts the KPIs of work stream status to assess progress and stagnation. It includes elements such as budget, risk, action plan, work stream timeline, highlights etc. Showcasing this set of slides titled Workforce Productivity Tracking Report Dashboard Background PDF. The topics addressed in these templates are High Technology Turnover, Workforce Health Safety Risk, Plan Employee Training. All the content presented in this PPT design is completely editable. Download it and make adjustments in color, background, font etc. as per your unique business setting.
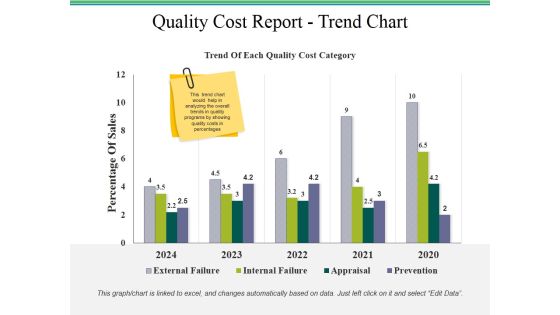
Quality Cost Report Trend Chart Ppt PowerPoint Presentation Styles Templates
This is a quality cost report trend chart ppt powerpoint presentation styles templates. This is a two stage process. The stages in this process are quality cost report, business, finance, marketing, strategy.

quality cost report trend chart ppt powerpoint presentation pictures vector
This is a quality cost report trend chart ppt powerpoint presentation pictures vector. This is a four stage process. The stages in this process are business, finance, marketing, strategy, analysis.
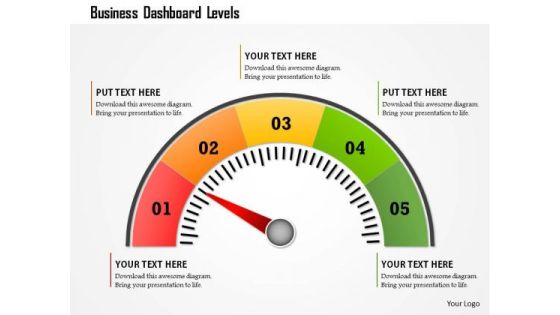
Business Framework Business Dashboard Levels PowerPoint Presentation
This business diagram displays colored meter with multiple levels. Use this diagram to display business process. This diagram can be used to indicate performance measures. This is an excellent diagram to impress your audiences.

Acquisition Cost Per Customer Ppt PowerPoint Presentation Example 2015
This is a acquisition cost per customer ppt powerpoint presentation example 2015. This is a three stage process. The stages in this process are rising, steady, falling.

Cost Performance Index Ppt PowerPoint Presentation Portfolio Examples
This is a cost performance index ppt powerpoint presentation portfolio examples. This is a three stage process. The stages in this process are cost performance index, schedule performance index, cost performance index und schedule performance index, project name.

Tips To Use Cost And Schedule Performance Index Diagrams PDF
This slide mentions the tips for analyzing cost and schedule performance index effectively. It includes ensuring data accuracy, knowing analysis isnt always correct and ensuring correct usage. Persuade your audience using this Tips To Use Cost And Schedule Performance Index Diagrams PDF. This PPT design covers three stages, thus making it a great tool to use. It also caters to a variety of topics including Cost Reporting, Inaccurate Data, Management Techniques. Download this PPT design now to present a convincing pitch that not only emphasizes the topic but also showcases your presentation skills.

Competitive Cost Advantage Ppt PowerPoint Presentation Infographic Template Guidelines
This is a competitive cost advantage ppt powerpoint presentation infographic template guidelines. This is a four stage process. The stages in this process are net cost advantage, parameter, tables, analysis, competition.

Agenda For Customer Acquisition Cost For Startups Themes PDF
This is a agenda for customer acquisition cost for startups themes pdf template with various stages. Focus and dispense information on seven stages using this creative set, that comes with editable features. It contains large content boxes to add your information on topics like client acquisition, dashboards, metrices, various strategies, analyze. You can also showcase facts, figures, and other relevant content using this PPT layout. Grab it now.

Cost For Catastrophe Recovery Application Plan Clipart PDF
This slide represents the cost details for the disaster recovery plan services, including types of plan names such as virtualization disaster, network disaster, cloud-based, data center, and disaster recovery as a service and cost for each plan. Presenting cost for catastrophe recovery application plan clipart pdf to provide visual cues and insights. Share and navigate important information on one stages that need your due attention. This template can be used to pitch topics like cost for catastrophe recovery application plan. In addtion, this PPT design contains high resolution images, graphics, etc, that are easily editable and available for immediate download.

Project Cost Estimate Ppt PowerPoint Presentation Portfolio Visual Aids
This is a project cost estimate ppt powerpoint presentation portfolio visual aids. This is a five stage process. The stages in this process are project management, hardware, software, testing, training and support, reserves.

Stock Cost Reduction Tips To Optimize Operations Brochure PDF
The following slide showcases tactics to reduce inventory cost which businesses can employ to free up capital and improve cash flow. It include strategies such as controlling order management process, managing excess inventory, reducing shipping cost, and monitoring KPIs. Presenting Stock Cost Reduction Tips To Optimize Operations Brochure PDF to dispense important information. This template comprises four stages. It also presents valuable insights into the topics including Regulate Order Management Process, Manage Excess Inventory, Reduce Shipping Cost. This is a completely customizable PowerPoint theme that can be put to use immediately. So, download it and address the topic impactfully.

Cloud Computing Scalability Cost Management Cloud Billing Framework Infographics PDF
This slide covers the cloud billing framework including streamlined multi-cloud data importation, usage-based billing, and margin optimization. Do you have an important presentation coming up Are you looking for something that will make your presentation stand out from the rest Look no further than Cloud Computing Scalability Cost Management Cloud Billing Framework Infographics PDF. With our professional designs, you can trust that your presentation will pop and make delivering it a smooth process. And with Slidegeeks, you can trust that your presentation will be unique and memorable. So why wait Grab Cloud Computing Scalability Cost Management Cloud Billing Framework Infographics PDF today and make your presentation stand out from the rest.

Strategic Cost Reducing Measures In Banks Infographics PDF
This slide exhibits measures to reduce bank cost and enhance efficiency of banking sector. It includes five steps improvement scope, centralize processing, consistent processes, effective staffing and performance management. Presenting Strategic Cost Reducing Measures In Banks Infographics PDF to dispense important information. This template comprises Five stages. It also presents valuable insights into the topics including Improvement Scope, Centralize Processing. This is a completely customizable PowerPoint theme that can be put to use immediately. So, download it and address the topic impactfully.

Digitized Tail End Cost Management Process Microsoft PDF
This slide presents tail spend management through digitized process helpful in reducing costs of procurement operations and improved purchasing experience for end users. It includes preparing product data, building supplier strategy, issuing RFIs and RFQs and management qualification. Presenting Digitized Tail End Cost Management Process Microsoft PDF to dispense important information. This template comprises four stages. It also presents valuable insights into the topics including Management Qualification, Building Supplier Strategy, Preparing Product Data. This is a completely customizable PowerPoint theme that can be put to use immediately. So, download it and address the topic impactfully.

Signs Indicating Tail End Cost In Business Demonstration PDF
This slide presents signs that indicate presence of tail spends in business helpful in identifying barriers to cost efficiency and providing solutions for same. It includes mismatch of ERP, sourcing data hidden in email, too much stock holding that should be treated on priority basis. Persuade your audience using this Signs Indicating Tail End Cost In Business Demonstration PDF. This PPT design covers three stages, thus making it a great tool to use. It also caters to a variety of topics including Stocks, Resource, Supplier. Download this PPT design now to present a convincing pitch that not only emphasizes the topic but also showcases your presentation skills.

Website Performance And Conversion Rate Analysis Ppt Slides Inspiration PDF
This slide covers dashboard showing webpage performance based on multiple KPIs. It includes elements such as users count, active sessions, conversation rate and cost, cost per click, top campaign performance, top countries by sessions, most engaged digital channels, etc. Showcasing this set of slides titled Website Performance And Conversion Rate Analysis Ppt Slides Inspiration PDF. The topics addressed in these templates are Digital Channels, Driving Maximum, Engagement. All the content presented in this PPT design is completely editable. Download it and make adjustments in color, background, font etc. as per your unique business setting.
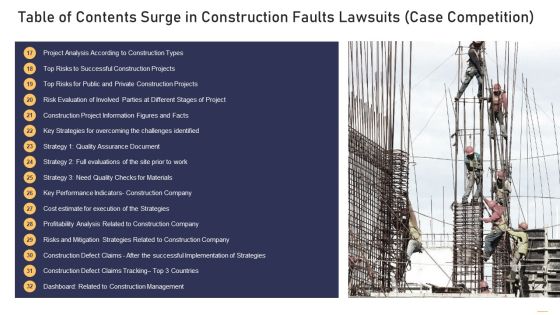
Table Of Contents Surge In Construction Faults Lawsuits Case Competition Cost Microsoft PDF
Deliver an awe inspiring pitch with this creative table of contents surge in construction faults lawsuits case competition cost microsoft pdf bundle. Topics like management, dashboard, implementation, strategies, profitability analysis can be discussed with this completely editable template. It is available for immediate download depending on the needs and requirements of the user.

Quantitative Risk Analysis Ppt PowerPoint Presentation Model Influencers
This is a quantitative risk analysis ppt powerpoint presentation model influencers. This is a ten stage process. The stages in this process are cost risk, insufficient funds to support the bid, schedule risk, insufficient resources to complete work on time.

Transform Management Instruction Schedule Change Management Training Analysis Pictures PDF
This slide represents the dashboard showing the analysis of change management training program conducted by the organization. It includes details related to total courses, total participants, compensation cost etc. Coming up with a presentation necessitates that the majority of the effort goes into the content and the message you intend to convey. The visuals of a PowerPoint presentation can only be effective if it supplements and supports the story that is being told. Keeping this in mind our experts created Transform Management Instruction Schedule Change Management Training Analysis Pictures PDF to reduce the time that goes into designing the presentation. This way, you can concentrate on the message while our designers take care of providing you with the right template for the situation.

Force Field Analysis Template 1 Ppt PowerPoint Presentation Professional
This is a force field analysis template 1 ppt powerpoint presentation professional. This is a eight stage process. The stages in this process are increase revenue, increase market share, market segment by customers, generate economies of scale, upset business partners, damage corporate image, cost risks, driving sales from current.
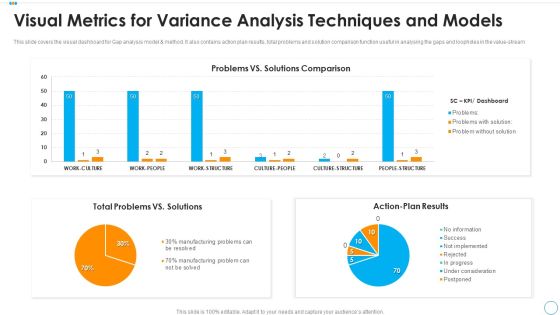
Visual Metrics For Variance Analysis Techniques And Models Mockup PDF
This slide covers the visual dashboard for Gap analysis model and method. It also contains action plan results, total problems and solution comparison function useful in analysing the gaps and loopholes in the value stream. Showcasing this set of slides titled visual metrics for variance analysis techniques and models mockup pdf. The topics addressed in these templates are total problems vs solutions, action plan results, problems vs solutions comparison. All the content presented in this PPT design is completely editable. Download it and make adjustments in color, background, font etc. as per your unique business setting.

Earned Value Management Analysis Performance Measurement Ppt Infographics Portrait PDF
This slide represents earned value management analysis performance measurement illustrating performance measure such as schedule variance and cost variance. Presenting Earned Value Management Analysis Performance Measurement Ppt Infographics Portrait PDF to dispense important information. This template comprises two stages. It also presents valuable insights into the topics including Performance Measure, Schedule Variance, Cost Variance. This is a completely customizable PowerPoint theme that can be put to use immediately. So, download it and address the topic impactfully.

Comparative Analysis Of Data Migration Strategic Plan Diagrams PDF
The following slide represents the comparative assessment of various types of data migration strategies to select the best based on the requirements. It includes elements such as scalability, cost effectiveness, safety, accessibility etc. Presenting Comparative Analysis Of Data Migration Strategic Plan Diagrams PDF to dispense important information. This template comprises one stages. It also presents valuable insights into the topics including Cost Effective, Application, Cloud. This is a completely customizable PowerPoint theme that can be put to use immediately. So, download it and address the topic impactfully.

Comparative Analysis In Digital Transformation Statistics Graphics PDF
This slide signifies the comparative assessment of digital transformation trends. It includes bar graph with governance and compliance, IT security, automation, cost saving and data analytics. Showcasing this set of slides titled comparative analysis in digital transformation statistics graphics pdf. The topics addressed in these templates are data analytics, cost saving, improve customer experience. All the content presented in this PPT design is completely editable. Download it and make adjustments in color, background, font etc. as per your unique business setting.
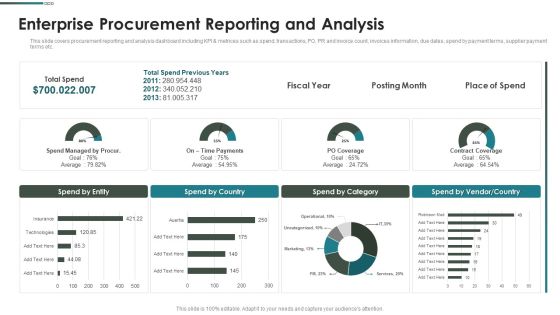
Purchase Assessment Process Enterprise Procurement Reporting And Analysis Infographics PDF
This slide covers procurement reporting and analysis dashboard including KPI metrices such as spend, transactions, PO, PR and invoice count, invoices information, due dates, spend by payment terms, supplier payment terms etc. Deliver an awe inspiring pitch with this creative Purchase Assessment Process Enterprise Procurement Reporting And Analysis Infographics PDF bundle. Topics like Spend Entity, Spend Country, Spend Category can be discussed with this completely editable template. It is available for immediate download depending on the needs and requirements of the user.

Purchase Assessment Process Procurement Spend Analysis Ideas PDF
This slide covers procurement spend analysis dashboard including KPIs such as invoice count, invoices information, due dates, spend by payment terms, supplier payment terms, spend by entity, spend by category, spend by country.Deliver an awe inspiring pitch with this creative Purchase Assessment Process Procurement Spend Analysis Ideas PDF bundle. Topics like Transactions, Category Search, Invoice Count can be discussed with this completely editable template. It is available for immediate download depending on the needs and requirements of the user.

Procurement Analytics Tools And Strategies Procurement Spend Analysis Graphics PDF
This slide covers procurement spend analysis dashboard including KPIs such as invoice count, invoices information, due dates, spend by payment terms, supplier payment terms, spend by entity, spend by category, spend by country.Deliver an awe inspiring pitch with this creative Procurement Analytics Tools And Strategies Procurement Spend Analysis Graphics PDF bundle. Topics like Transactions, Invoice Count, Spend Category can be discussed with this completely editable template. It is available for immediate download depending on the needs and requirements of the user.
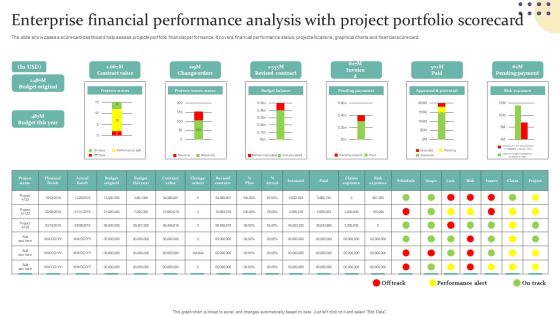
Enterprise Financial Performance Analysis With Project Portfolio Scorecard Guidelines PDF
The slide showcases a scorecard dashboard help assess projects portfolio financial performance. It covers financial performance status, projects locations, graphical charts and financial scorecard. Showcasing this set of slides titled Enterprise Financial Performance Analysis With Project Portfolio Scorecard Guidelines PDF. The topics addressed in these templates are Projects Status, Projects Issues Status, Budget Balance. All the content presented in this PPT design is completely editable. Download it and make adjustments in color, background, font etc. as per your unique business setting.
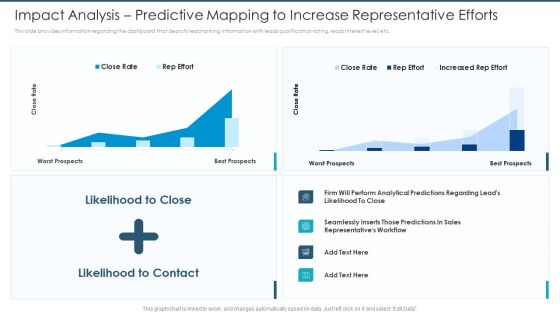
Impact Analysis Predictive Mapping To Increase Representative Efforts Template PDF
This slide provides information regarding the dashboard that depicts lead ranking information with leads qualification rating, leads interest level, etc. Deliver and pitch your topic in the best possible manner with this impact analysis predictive mapping to increase representative efforts template pdf. Use them to share invaluable insights on close rate, increased rep effort, rep effort and impress your audience. This template can be altered and modified as per your expectations. So, grab it now.
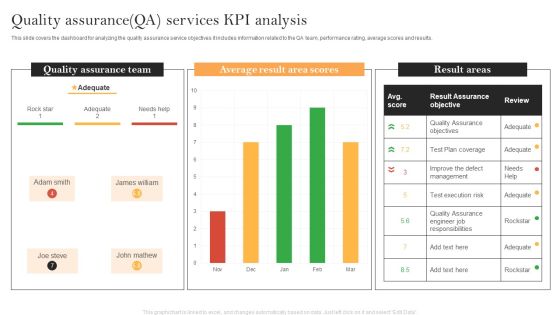
Quality Assurance QA Services KPI Analysis Demonstration PDF
This slide covers the dashboard for analyzing the quality assurance service objectives it includes information related to the QA team, performance rating, average scores and results. Showcasing this set of slides titled Quality Assurance QA Services KPI Analysis Demonstration PDF. The topics addressed in these templates are Quality Assurance Team, Average Result Area, Result Assurance Objective. All the content presented in this PPT design is completely editable. Download it and make adjustments in color, background, font etc. as per your unique business setting.
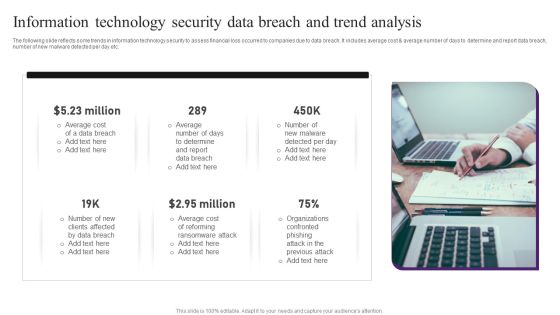
Information Technology Security Data Breach And Trend Analysis Professional PDF
The following slide reflects some trends in information technology security to assess financial loss occurred to companies due to data breach. It includes average cost and average number of days to determine and report data breach, number of new malware detected per day etc. Presenting Information Technology Security Data Breach And Trend Analysis Professional PDF to dispense important information. This template comprises six stages. It also presents valuable insights into the topics including Data Breach, Average Cost, Determine. This is a completely customizable PowerPoint theme that can be put to use immediately. So, download it and address the topic impactfully.

KPI Analysis Of Revenue Planning Procedure Professional PDF
This slide depicts the dashboard used to analyze the key performance indicators of the revenue planning process. The purpose of this template is to evaluate the revenue based on the actual and budget specified. It includes information related to the product, total, actual and budget revenue. Showcasing this set of slides titled KPI Analysis Of Revenue Planning Procedure Professional PDF. The topics addressed in these templates are Kpi Analysis, Revenue Planning Procedure. All the content presented in this PPT design is completely editable. Download it and make adjustments in color, background, font etc. as per your unique business setting.

Customer Engagement Data Through Social Platforms Data Analysis Brochure PDF
This slide demonstrates the dashboard representing the user engagement related to campaign A organized by ABC company. It includes statistical data related to no. of reach, custom button clicks, no. of shares, post engagement rate, taps on website link by users etc. Showcasing this set of slides titled Customer Engagement Data Through Social Platforms Data Analysis Brochure PDF. The topics addressed in these templates are Customer Engagement Data, Social Platforms Data Analysis. All the content presented in this PPT design is completely editable. Download it and make adjustments in color, background, font etc. as per your unique business setting.
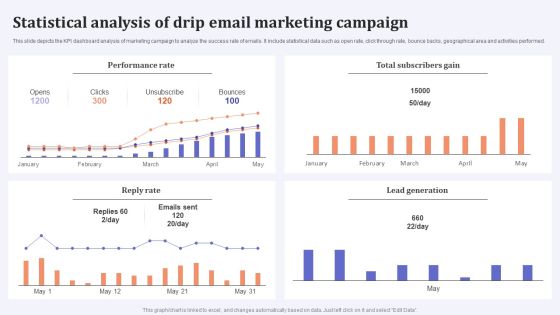
Statistical Analysis Of Drip Email Marketing Campaign Microsoft PDF
This slide depicts the KPI dashboard analysis of marketing campaign to analyze the success rate of emails. It include statistical data such as open rate, click through rate, bounce backs, geographical area and activities performed. Showcasing this set of slides titled Statistical Analysis Of Drip Email Marketing Campaign Microsoft PDF. The topics addressed in these templates are Performance Rate, Total Subscribers Gain, Reply Rate. All the content presented in this PPT design is completely editable. Download it and make adjustments in color, background, font etc. as per your unique business setting.

Change Metrics Showcasing Time Consumption Analysis By Status Clipart PDF
This slide showcases dashboard to analyze and monitor overall time consumption by various change cases in the organization. It includes elements such as escalated, solution proposed, waiting for customer approval, etc. Showcasing this set of slides titled Change Metrics Showcasing Time Consumption Analysis By Status Clipart PDF The topics addressed in these templates are Consuming, Status Analysis, Record Count. All the content presented in this PPT design is completely editable. Download it and make adjustments in color, background, font etc. as per your unique business setting.

Comparative Analysis Of Marketing Document Tools Topics PDF
This slide highlights comparison of marketing reporting tools aimed at communicating openly with clients and save time in the process to achieve business goals. It covers tools with respective description and pricing structure. Showcasing this set of slides titled Comparative Analysis Of Marketing Document Tools Topics PDF. The topics addressed in these templates are Allows Custom Report Building, Dashboard Management, Integrations Social, Analytical, CRM Platforms . All the content presented in this PPT design is completely editable. Download it and make adjustments in color, background, font etc. as per your unique business setting.
