Cost Analysis Dashboard
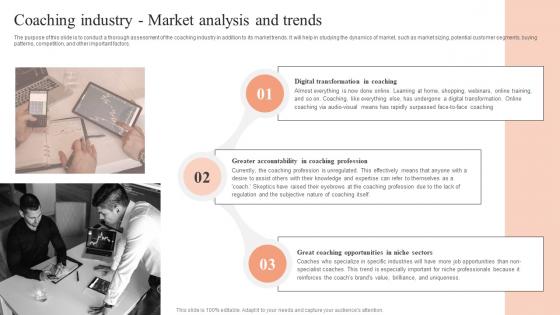
Industry Synopsis Market Analysis Coaching Industry Market Analysis And Trends Download Pdf
The purpose of this slide is to conduct a thorough assessment of the coaching industry in addition to its market trends. It will help in studying the dynamics of market, such as market sizing, potential customer segments, buying patterns, competition, and other important factors. Boost your pitch with our creative Industry Synopsis Market Analysis Coaching Industry Market Analysis And Trends Download Pdf. Deliver an awe-inspiring pitch that will mesmerize everyone. Using these presentation templates you will surely catch everyones attention. You can browse the ppts collection on our website. We have researchers who are experts at creating the right content for the templates. So you do not have to invest time in any additional work. Just grab the template now and use them.

Adjusting Financial Strategies And Planning Comparative Analysis Of Financial Analysis Software Structure PDF
This slide provides glimpse about comparative analysis of different corporate investment portfolios for selecting appropriate investment portfolio. It includes KPIs such as return, risk, liquidity, time horizon, etc. Coming up with a presentation necessitates that the majority of the effort goes into the content and the message you intend to convey. The visuals of a PowerPoint presentation can only be effective if it supplements and supports the story that is being told. Keeping this in mind our experts created Adjusting Financial Strategies And Planning Comparative Analysis Of Financial Analysis Software Structure PDF to reduce the time that goes into designing the presentation. This way, you can concentrate on the message while our designers take care of providing you with the right template for the situation.
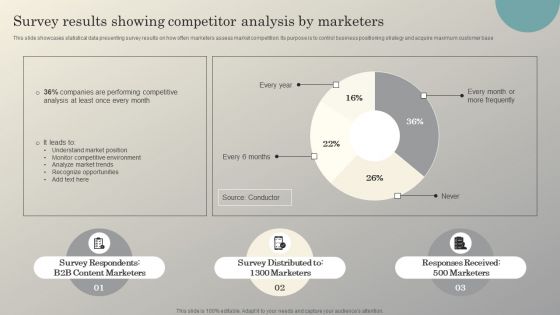
Steps To Conduct Competitor Analysis Survey Results Showing Competitor Analysis Mockup PDF
This slide showcases statistical data presenting survey results on how often marketers assess market competition. Its purpose is to control business positioning strategy and acquire maximum customer base. Want to ace your presentation in front of a live audience Our Steps To Conduct Competitor Analysis Survey Results Showing Competitor Analysis Mockup PDF can help you do that by engaging all the users towards you. Slidegeeks experts have put their efforts and expertise into creating these impeccable powerpoint presentations so that you can communicate your ideas clearly. Moreover, all the templates are customizable, and easy-to-edit and downloadable. Use these for both personal and commercial use.

Internal And External Business Environment Analysis Importance Of Key Environmental Trends For Market Analysis Formats PDF
This slide shows importance of Key environmental trends to identify technological, regulatory, socio cultural and socio-economic trends affecting business environment This is a internal and external business environment analysis importance of key environmental trends for market analysis formats pdf template with various stages. Focus and dispense information on four stages using this creative set, that comes with editable features. It contains large content boxes to add your information on topics like technology trends, regulatory trends, societal and cultural trends You can also showcase facts, figures, and other relevant content using this PPT layout. Grab it now.
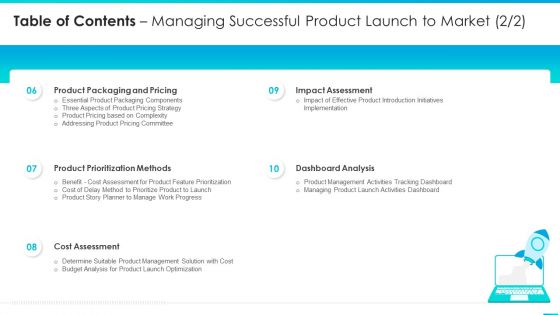
Table Of Contents Managing Successful Product Launch To Market Cost Introduction PDF
Presenting table of contents managing successful product launch to market cost introduction pdf to provide visual cues and insights. Share and navigate important information on five stages that need your due attention. This template can be used to pitch topics like prioritization methods, cost assessment, dashboard analysis, impact assessment, product packaging and pricing. In addtion, this PPT design contains high resolution images, graphics, etc, that are easily editable and available for immediate download.
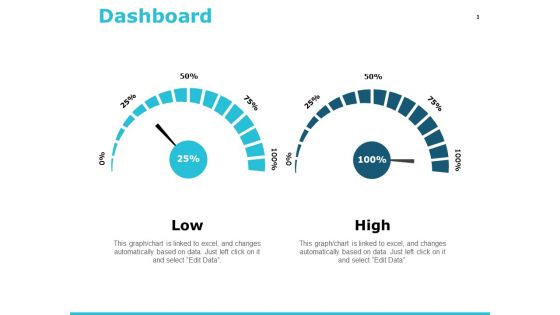
Dashboard Management Ppt PowerPoint Presentation Show Deck
This is a dashboard management ppt powerpoint presentation show deck. This is a two stage process. The stages in this process are dashboard, finance, analysis, business, investment.
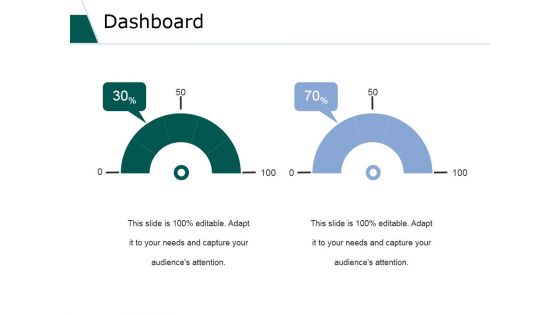
Dashboard Ppt PowerPoint Presentation Gallery Ideas
This is a dashboard ppt powerpoint presentation gallery ideas. This is a two stage process. The stages in this process are business, marketing, dashboard, analysis, finance.

Dashboard Ppt PowerPoint Presentation Infographic Template Format
This is a dashboard ppt powerpoint presentation infographic template format. This is a two stage process. The stages in this process are business, strategy, analysis, marketing, finance, dashboard.
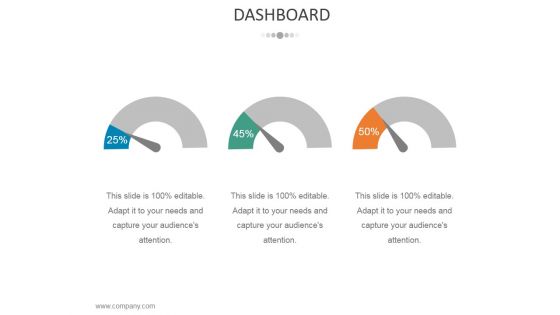
Dashboard Ppt PowerPoint Presentation Outline Show
This is a dashboard ppt powerpoint presentation outline show. This is a three stage process. The stages in this process are business, strategy, marketing, analysis, finance, dashboard.

Dashboard Ppt PowerPoint Presentation Pictures Microsoft
This is a dashboard ppt powerpoint presentation pictures microsoft. This is a three stage process. The stages in this process are business, strategy, marketing, analysis, dashboard, finance.
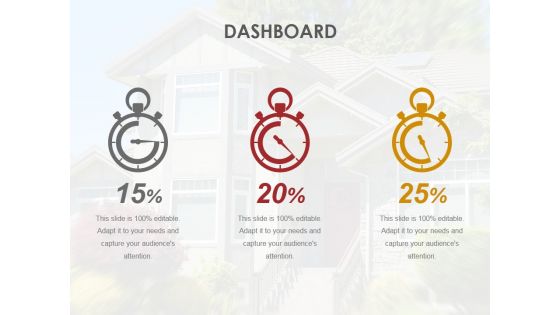
Dashboard Ppt PowerPoint Presentation Outline Layout
This is a dashboard ppt powerpoint presentation outline layout. This is a three stage process. The stages in this process are business, marketing, analysis, strategy, dashboard.
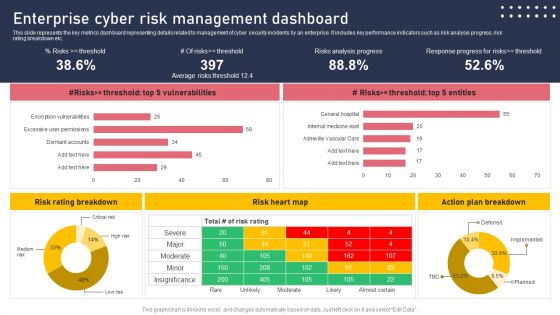
Enterprise Cyber Risk Management Dashboard Sample PDF
This slide represents the key metrics dashboard representing details related to management of cyber security incidents by an enterprise. It includes key performance indicators such as risk analysis progress, risk rating breakdown etc. There are so many reasons you need a Enterprise Cyber Risk Management Dashboard Sample PDF. The first reason is you cannot spend time making everything from scratch, Thus, Slidegeeks has made presentation templates for you too. You can easily download these templates from our website easily.

Project Metrics Dashboard And Reports Portrait PDF
This slide covers the project management dashboard which focuses on project financials with business objective, project costs, status, approved budget, forecasting, data variance, capital expenditure on new product development, comparison of total cost with actual budget, etc. Showcasing this set of slides titled Project Metrics Dashboard And Reports Portrait PDF. The topics addressed in these templates are Budget, Portfolio, Investment. All the content presented in this PPT design is completely editable. Download it and make adjustments in color, background, font etc. as per your unique business setting.
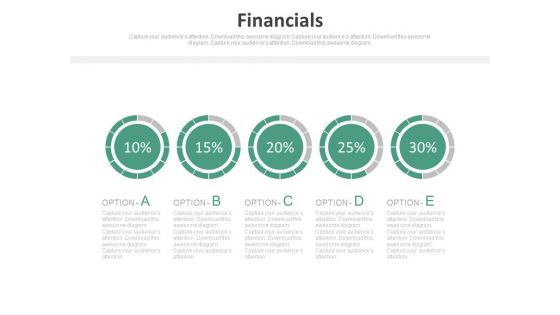
Pie Charts For Percentage Value Analysis Powerpoint Slides
Our above PPT slide displays graphics of Pie charts. This PowerPoint template may be used to display percentage value analysis. Download this template to leave permanent impression on your audience.

Customer Relationship Management Dashboard Revenue Background PDF
This slide covers the competitive analysis of different partner relationship management software which are compared based on features ratings and software prices. Deliver and pitch your topic in the best possible manner with this customer relationship management dashboard revenue background pdf. Use them to share invaluable insights on supply chain planning, fulfillment management, transportation management, inventory management and impress your audience. This template can be altered and modified as per your expectations. So, grab it now.

Workforce Detailed Analytics Report Dashboard Mockup PDF
This slide showcases detailed analysis of human resources across business. It provides information such as satisfaction score, department, gender, hiring trend, designation, type, etc. Showcasing this set of slides titled Workforce Detailed Analytics Report Dashboard Mockup PDF. The topics addressed in these templates are Employees, Designation Split, Employees By Nationality. All the content presented in this PPT design is completely editable. Download it and make adjustments in color, background, font etc. as per your unique business setting.
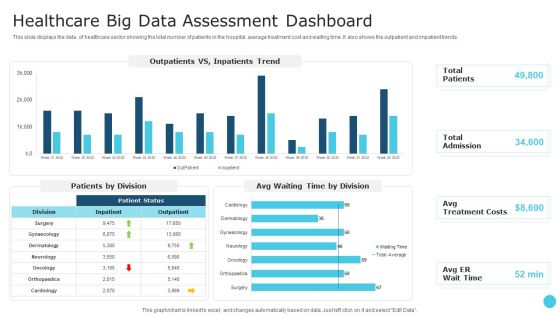
Healthcare Big Data Assessment Dashboard Portrait PDF
This slide displays the data of healthcare sector showing the total number of patients in the hospital, average treatment cost and waiting time. It also shows the outpatient and impatient trends. Pitch your topic with ease and precision using this Healthcare Big Data Assessment Dashboard Portrait PDF. This layout presents information on Patient Status, Treatment Costs. It is also available for immediate download and adjustment. So, changes can be made in the color, design, graphics or any other component to create a unique layout.
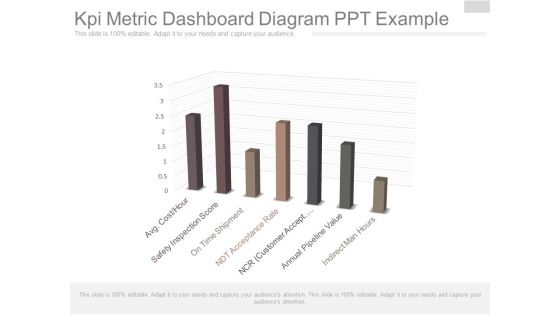
Kpi Metric Dashboard Diagram Ppt Example
This is a kpi metric dashboard diagram ppt example. This is a seven stage process. The stages in this process are avg cost hour, safety inspection score, on time shipment, ndt acceptance rate, ncr customer accept, annual pipeline value, indirect man hours.
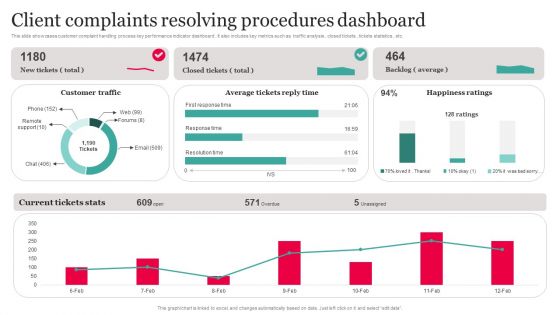
Client Complaints Resolving Procedures Dashboard Download PDF
This slide showcases customer complaint handling process key performance indicator dashboard. It also includes key metrics such as traffic analysis , closed tickets , tickets statistics , etc. Showcasing this set of slides titled Client Complaints Resolving Procedures Dashboard Download PDF The topics addressed in these templates are Customer Traffic, Average Tickets Reply Time, Resolving Procedures Dashboard. All the content presented in this PPT design is completely editable. Download it and make adjustments in color, background, font etc. as per your unique business setting.
Devops Continuous Workflow Tracking Dashboard Slides PDF
This slide provides the glimpse of facts and figures related to continuous monitoring of project with DevOps. It includes planned vs. completed work items, work item priority wise, active bugs severity wise, etc. Showcasing this set of slides titled Devops Continuous Workflow Tracking Dashboard Slides PDF. The topics addressed in these templates are Continuous Workflow, Tracking Dashboard, Sprint Analysis By Assignee. All the content presented in this PPT design is completely editable. Download it and make adjustments in color, background, font etc. as per your unique business setting.
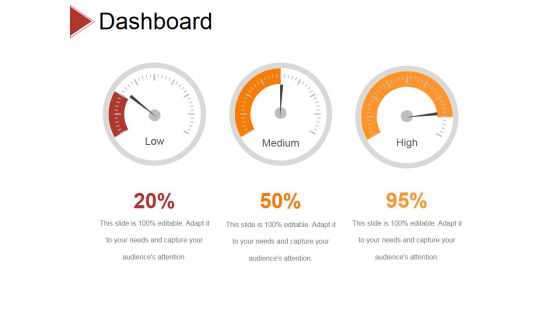
Dashboard Ppt PowerPoint Presentation Styles Graphics Design
This is a dashboard ppt powerpoint presentation styles graphics design. This is a three stage process. The stages in this process are business, strategy, analysis, pretention, finance, dashboard.
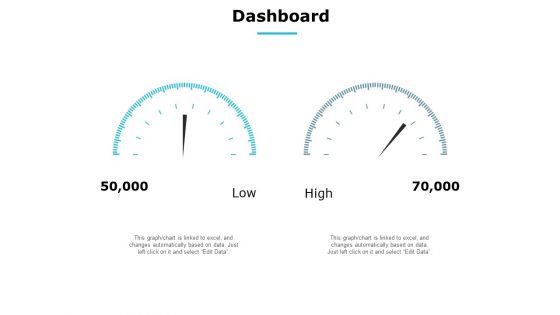
Dashboard Measurement Ppt PowerPoint Presentation Gallery Layouts
Presenting this set of slides with name dashboard measurement ppt powerpoint presentation gallery layouts. This is a two stage process. The stages in this process are dashboard, marketing, management, investment, analysis. This is a completely editable PowerPoint presentation and is available for immediate download. Download now and impress your audience.
Sustainable Green Cloud Computing Performance Tracking Dashboard
This slide depicts the performance tracking dashboard for green cloud computing. This slide aims to showcase the performance tracking report of green cloud computing by covering parameters such as Power Use Effectiveness PUE, high-density zone, history, consumption, and Average Propensity to Consume APC consumption. The Sustainable Green Cloud Computing Performance Tracking Dashboard is a compilation of the most recent design trends as a series of slides. It is suitable for any subject or industry presentation, containing attractive visuals and photo spots for businesses to clearly express their messages. This template contains a variety of slides for the user to input data, such as structures to contrast two elements, bullet points, and slides for written information. Slidegeeks is prepared to create an impression.
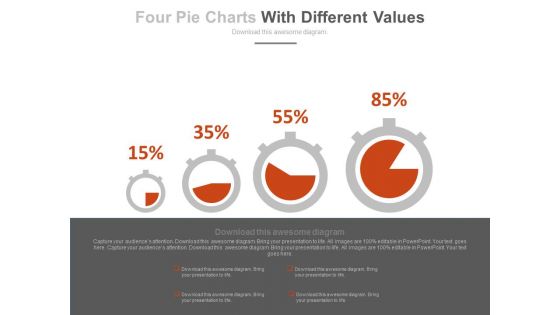
Dashboard With Increasing Values Powerpoint Slides
This innovative, stunningly beautiful dashboard has been designed for data visualization. It contains pie charts with increasing percentage values. This PowerPoint template helps to display your information in a useful, simple and uncluttered way.
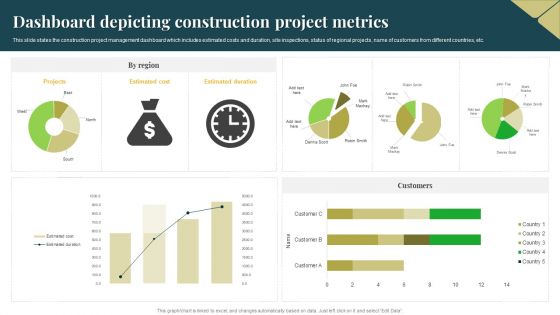
Dashboard Depicting Construction Project Metrics Inspiration PDF
This slide states the construction project management dashboard which includes estimated costs and duration, site inspections, status of regional projects, name of customers from different countries, etc. Pitch your topic with ease and precision using this Dashboard Depicting Construction Project Metrics Inspiration PDF. This layout presents information on Estimated Cost, Estimated Duration, Projects. It is also available for immediate download and adjustment. So, changes can be made in the color, design, graphics or any other component to create a unique layout.

Dashboard Percentage Ppt PowerPoint Presentation Professional Rules
Presenting this set of slides with name dashboard percentage ppt powerpoint presentation professional rules. The topics discussed in these slides are finance, marketing, management, investment, analysis. This is a completely editable PowerPoint presentation and is available for immediate download. Download now and impress your audience.
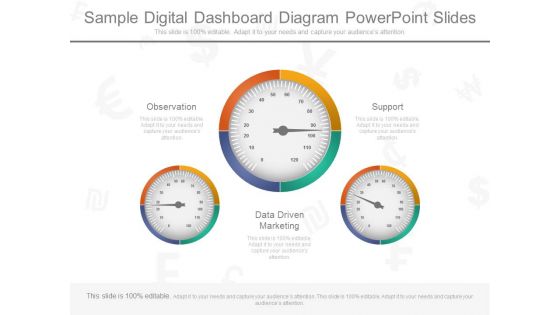
Sample Digital Dashboard Diagram Powerpoint Slides
This is a sample digital dashboard diagram powerpoint slides. This is a three stage process. The stages in this process are observation, support , data driven marketing.
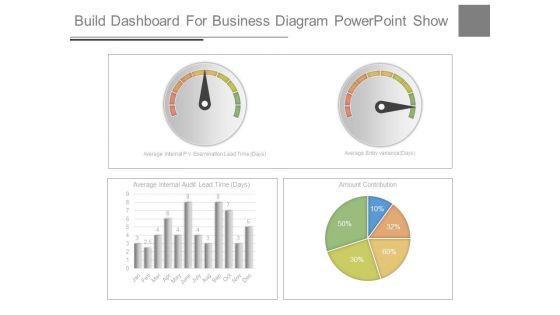
Build Dashboard For Business Diagram Powerpoint Show
This is a build dashboard for business diagram powerpoint show. This is a four stage process. The stages in this process are average internal pv examination lead time, average entry variance, average internal audit lead time, amount contribution.
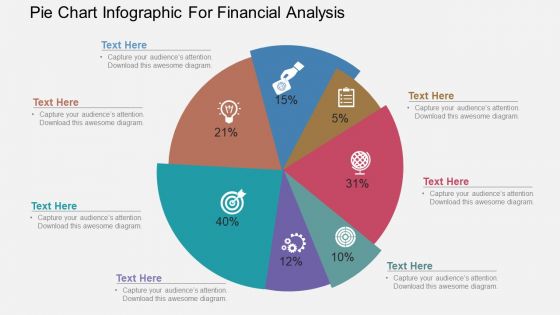
Pie Chart Infographic For Financial Analysis Powerpoint Template
Our above PowerPoint template has been designed with pie chart infographic. This slide is suitable to present financial analysis. Use this business diagram to present your work in a more smart and precise manner.
Dashboard Finance Ppt PowerPoint Presentation Icon Aids
This is a dashboard finance ppt powerpoint presentation icon aids. This is a three stage process. The stages in this process are dashboard, finance, analysis, business, investment.

Vehicle Management System KPI Dashboard Introduction PDF
This slide represents the dashboard showing real time data of fleet management to cut down operational costs and improve efficiency. It includes key metrics such as vehicles with errors, warnings, deviation from route, total vehicles, vehicles condition etc. Pitch your topic with ease and precision using this Vehicle Management System KPI Dashboard Introduction PDF. This layout presents information on Vehicle Management System, KPI Dashboard. It is also available for immediate download and adjustment. So, changes can be made in the color, design, graphics or any other component to create a unique layout.

Sap Bi Dashboard Ppt Powerpoint Layout
This is a sap bi dashboard ppt powerpoint layout. This is a five stage process. The stages in this process are crystal reports, dashboards, web intelligence, analysis, explorer.
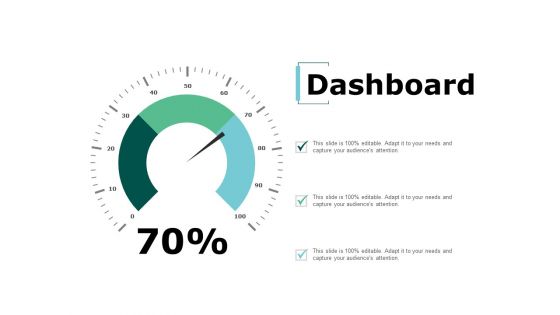
Dashboard Management Ppt Powerpoint Presentation Inspiration Model
This is a dashboard management ppt powerpoint presentation inspiration model. This is a three stage process. The stages in this process are dashboard, marketing, management, analysis, strategy.

Vehicle Management System Dashboard Graphics PDF
This slide represents the dashboard to help fleet managers to monitor the vehicles and the drivers in real-time. It represents KPIs such as vehicle status, service reminders, open issues, inspections summary, service costs etc. Pitch your topic with ease and precision using this Vehicle Management System Dashboard Graphics PDF. This layout presents information on Vehicle Management System, Representing Maintenance Status. It is also available for immediate download and adjustment. So, changes can be made in the color, design, graphics or any other component to create a unique layout.
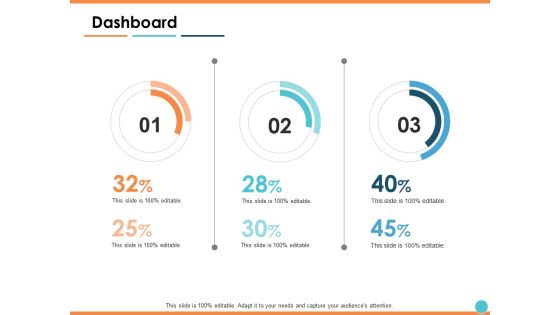
Dashboard Marketing Planning Ppt PowerPoint Presentation Tips
This is a dashboard marketing planning ppt powerpoint presentation tips. This is a three stage process. The stages in this process are finance, analysis, business, investment, marketing.

Dashboard Marketing Ppt Powerpoint Presentation Gallery Mockup
This is a dashboard marketing ppt powerpoint presentation gallery mockup. This is a two stage process. The stages in this process are finance, marketing, management, investment, analysis.
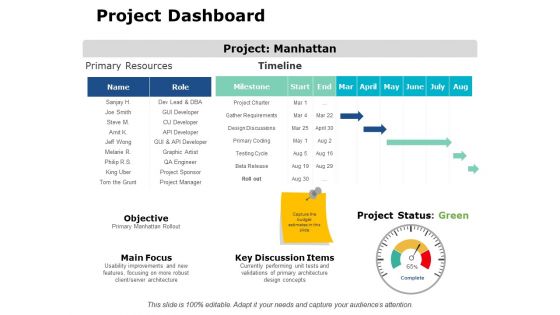
Project Dashboard Ppt PowerPoint Presentation Show Themes
This is a project dashboard ppt powerpoint presentation show themes. This is a eleven stage process. The stages in this process are finance, analysis, business, investment, marketing.

Corporate Performance Management Dashboard Ppt Powerpoint Topics
This is a corporate performance management dashboard ppt powerpoint topics. This is a eight stage process. The stages in this process are analysis, reporting, dashboards, financial consolidation, budgeting, forecasting, detailed planning, operational planning, corporate performance management.
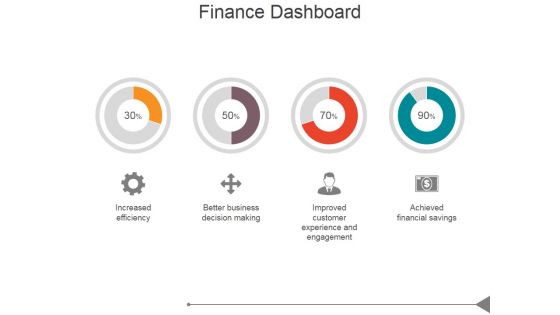
Finance Dashboard Ppt PowerPoint Presentation Diagrams
This is a finance dashboard ppt powerpoint presentation diagrams. This is a four stage process. The stages in this process are increased efficiency, better business decision making, improved customer experience and engagement, achieved financial savings.

Dashboard Contribution Ppt PowerPoint Presentation Summary Ideas
This is a dashboard contribution ppt powerpoint presentation summary ideas. This is a three stage process. The stages in this process are finance, business, management, strategy, analysis.

Dashboard Marketing Ppt PowerPoint Presentation Ideas Inspiration
This is a dashboard marketing ppt powerpoint presentation ideas inspiration. This is a three stage process. The stages in this process are finance, management, strategy, analysis, marketing.
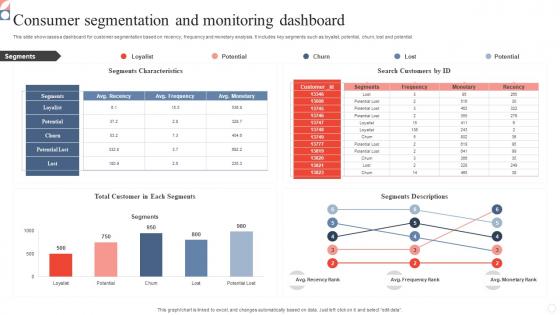
Consumer Segmentation And Monitoring Dashboard Mockup Pdf
This slide showcases a dashboard for customer segmentation based on recency, frequency and monetary analysis. It includes key segments such as loyalist, potential, churn, lost and potential. Showcasing this set of slides titled Consumer Segmentation And Monitoring Dashboard Mockup Pdf. The topics addressed in these templates are Consumer Segmentation, Monitoring Dashboard, Potential, Churn. All the content presented in this PPT design is completely editable. Download it and make adjustments in color, background, font etc. as per your unique business setting.
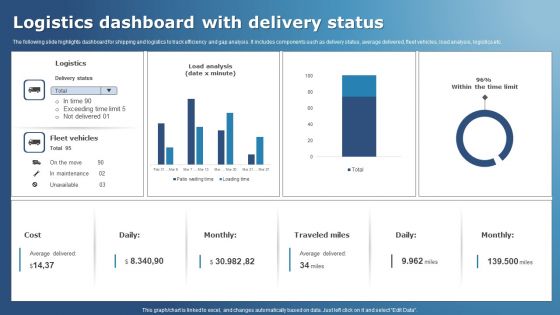
Logistics Dashboard With Delivery Status Structure PDF
The following slide highlights dashboard for shipping and logistics to track efficiency and gap analysis. It includes components such as delivery status, average delivered, fleet vehicles, load analysis, logistics etc. Pitch your topic with ease and precision using this Logistics Dashboard With Delivery Status Structure PDF. This layout presents information on Logistics, Vehicles, Analysis. It is also available for immediate download and adjustment. So, changes can be made in the color, design, graphics or any other component to create a unique layout.
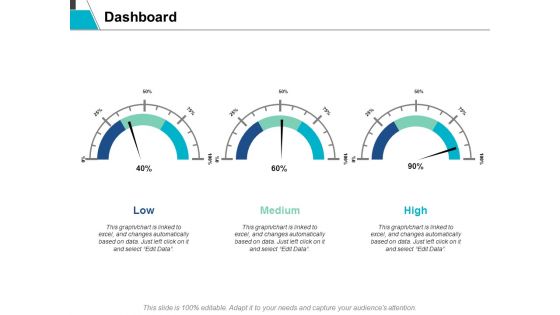
Dashboard Marketing Ppt Powerpoint Presentation Professional Mockup
This is a dashboard marketing ppt powerpoint presentation professional mockup. The topics discussed in this diagram are finance, marketing, management, investment, analysis. This is a completely editable PowerPoint presentation, and is available for immediate download.

Marketing Dashboard Example Powerpoint Slide Backgrounds
This is a marketing dashboard example powerpoint slide backgrounds. This is a eight stage process. The stages in this process are market profile, market segments, competitive analysis, positioning strategy, value proposition, brand strategy, pricing, distribution channels.

Business Intelligence Dashboard Design Ppt Powerpoint Topics
This is a business intelligence dashboard design ppt powerpoint topics. This is a four stage process. The stages in this process are sales analysis, sales forecasting, global distribution, sales by region, latin america, north america, eastern europe, western europe.
Financial Performance Tracking Dashboard Themes PDF
This slide presents the dashboard which will help firm in tracking the fiscal performance. This dashboard displays revenues and expenses trends and payment received analysis. There are so many reasons you need a Financial Performance Tracking Dashboard Themes PDF. The first reason is you can not spend time making everything from scratch, Thus, Slidegeeks has made presentation templates for you too. You can easily download these templates from our website easily.
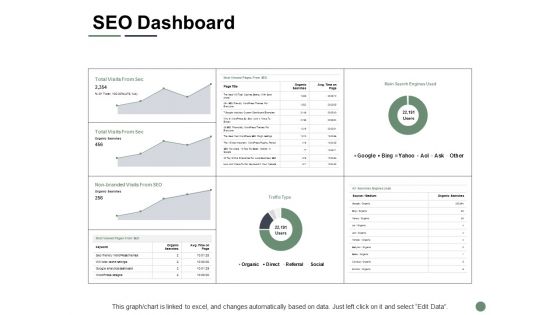
SEO Dashboard Ppt PowerPoint Presentation Model Example
Presenting this set of slides with name seo dashboard ppt powerpoint presentation model example. The topics discussed in these slides are finance, marketing, management, investment, analysis. This is a completely editable PowerPoint presentation and is available for immediate download. Download now and impress your audience.
SMM Dashboard Ppt PowerPoint Presentation Icon Introduction
Presenting this set of slides with name smm dashboard ppt powerpoint presentation icon introduction. This is a one stage process. The stages in this process are finance, marketing, management, investment, analysis. This is a completely editable PowerPoint presentation and is available for immediate download. Download now and impress your audience.
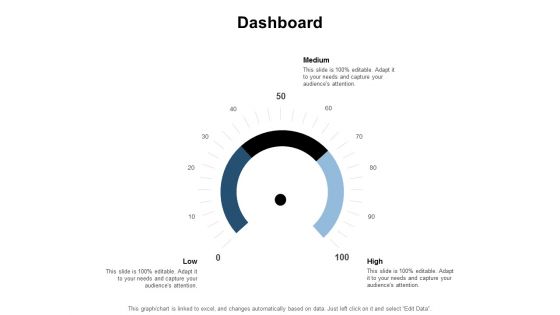
Dashboard Marketing Ppt PowerPoint Presentation Model Graphics
Presenting this set of slides with name dashboard marketing ppt powerpoint presentation model graphics. The topics discussed in these slides are finance, marketing, management, investment, analysis. This is a completely editable PowerPoint presentation and is available for immediate download. Download now and impress your audience.

Educative Event Budget Planning Dashboard Professional PDF
This slide depicts the dashboard used for analyzing the budget plan for an education event. The purpose of this template is to allocate funds to different activities. It includes information related to the budget planner, expenses, etc.Showcasing this set of slides titled Educative Event Budget Planning Dashboard Professional PDF. The topics addressed in these templates are Budget Analysis, Budget Planner, Payment Date. All the content presented in this PPT design is completely editable. Download it and make adjustments in color, background, font etc. as per your unique business setting.
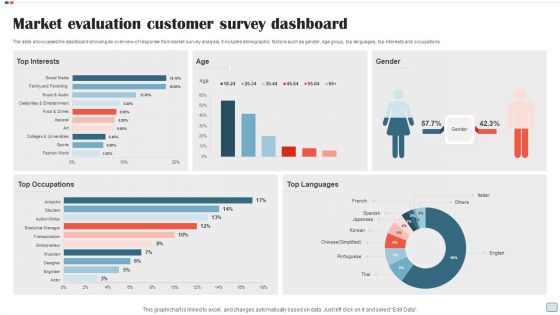
Market Evaluation Customer Survey Dashboard Topics PDF
The slide showcases the dashboard showing an overview of response from market survey analysis. It includes demographic factors such as gender, age group, top languages, top interests and occupations. Showcasing this set of slides titled Market Evaluation Customer Survey Dashboard Topics PDF. The topics addressed in these templates are Gender, Age Group, Top Languages, Top Interests And Occupations. All the content presented in this PPT design is completely editable. Download it and make adjustments in color, background, font etc. as per your unique business setting.

Manufacturing Enterprise Inventory Overview Dashboard Graphics PDF
The following slide depicts the key performance areas of inventory management in a manufacturing firm. It includes KPIs such as inventory turnover ratio, out of stock rate, on time in full rate, product wise average time to sell etc. Showcasing this set of slides titled Manufacturing Enterprise Inventory Overview Dashboard Graphics PDF. The topics addressed in these templates are Turnover Analysis, Dashboard, Stock Rate. All the content presented in this PPT design is completely editable. Download it and make adjustments in color, background, font etc. as per your unique business setting.
Weekly Customer Grievance Tracking Dashboard Designs PDF
This slide showcases dashboard that can help organization to identify the open and overdue status of customer grievance . It can guide managers to resolve the complaints and issues within stipulated time for customer satisfaction. Pitch your topic with ease and precision using this Weekly Customer Grievance Tracking Dashboard Designs PDF. This layout presents information on Average, Traffic Analysis, Customer Satisfaction Ratings. It is also available for immediate download and adjustment. So, changes can be made in the color, design, graphics or any other component to create a unique layout.

Business Management Workflow Automation Dashboard Pictures PDF
This slide presents the graphical representation of business management dashboard via workflow automation software. It includes annual revenue analysis, annual profit analysis, quotation, estimated income, monthly project revenue, upcoming event schedule, etc. Coming up with a presentation necessitates that the majority of the effort goes into the content and the message you intend to convey. The visuals of a PowerPoint presentation can only be effective if it supplements and supports the story that is being told. Keeping this in mind our experts created Business Management Workflow Automation Dashboard Pictures PDF to reduce the time that goes into designing the presentation. This way, you can concentrate on the message while our designers take care of providing you with the right template for the situation.
Dashboard For DEI Maturity Framework Icons Pdf
This slide illustrates facts and figures related to D and I that can help a business organization to track D and I maturity levels. It includes number of qualified leads, percent of supplier satisfaction value, etc. Pitch your topic with ease and precision using this Dashboard For DEI Maturity Framework Icons Pdf. This layout presents information on Dashboard For DEI, Maturity Framework, Supplier Satisfaction Value. It is also available for immediate download and adjustment. So, changes can be made in the color, design, graphics or any other component to create a unique layout.
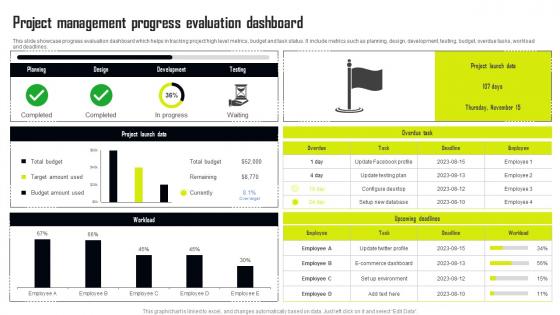
Project Management Progress Evaluation Dashboard Formats Pdf
This slide showcase progress evaluation dashboard which helps in tracking project high level metrics, budget and task status. It include metrics such as planning, design, development, testing, budget, overdue tasks, workload and deadlines. Pitch your topic with ease and precision using this Project Management Progress Evaluation Dashboard Formats Pdf This layout presents information on Planning, Design, Project Launch Data, Workload It is also available for immediate download and adjustment. So, changes can be made in the color, design, graphics or any other component to create a unique layout.

Client Self Service Metric Dashboard Brochure Pdf
The following slide highlights dashboard for customer self service to limit repetitive questions and facilitate support staff to handle complex issues. It includes components such as self service score, unique customers who survey help content, unique customers who produced tickets etc. Pitch your topic with ease and precision using this Client Self Service Metric Dashboard Brochure Pdf. This layout presents information on Self Service Score, Published, Content Type. It is also available for immediate download and adjustment. So, changes can be made in the color, design, graphics or any other component to create a unique layout.

Dashboard Showcasing Portfolio Investment Performance Information PDF
This slide represents dashboard showcasing portfolio investment performance. It includes project progress, project manager, task completed etc. Deliver and pitch your topic in the best possible manner with this Dashboard Showcasing Portfolio Investment Performance Information PDF. Use them to share invaluable insights on Rider Survey, Project, Support Mobile Account Inquiry and impress your audience. This template can be altered and modified as per your expectations. So, grab it now.

Pricing Right Data Kpi Dashboard Powerpoint Layout
This is a pricing right data kpi dashboard powerpoint layout. This is a two stage process. The stages in this process are price management, transactional discounting, price waterfall, channel mix, segmentation, product mix, price elasticity, contribution margin, price realization, kpi dashboard, financial statement, pricing, data, pricing right.

 Home
Home