Cost Analysis Dashboard
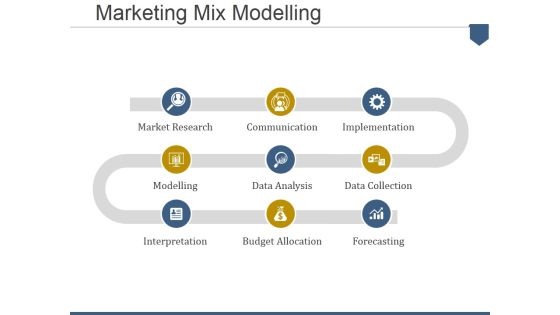
Marketing Mix Modelling Ppt PowerPoint Presentation Portfolio Graphics Template
This is a marketing mix modelling ppt powerpoint presentation portfolio graphics template. This is a three stage process. The stages in this process are market research, communication, implementation, data collection, forecasting, budget allocation, data analysis, modelling, interpretation.

Test Tubes With Percentage Data For Comparison Powerpoint Slides
This PowerPoint template has been designed with test tubes and percentage data. You may download this PPT slide to display data comparison and analysis. Add this slide to your presentation and impress your superiors.
Key Evaluation Metrics Ppt PowerPoint Presentation Layouts Icons
This is a key evaluation metrics ppt powerpoint presentation layouts icons. This is a five stage process. The stages in this process are business, icons, marketing, strategy, finance, analysis.

Table Of Contents Procurement Analytics Tools And Strategies Information PDF
Presenting Table Of Contents Procurement Analytics Tools And Strategies Information PDF to provide visual cues and insights. Share and navigate important information on one stage that need your due attention. This template can be used to pitch topics like Data Analysis, Enterprise Procurement, Budget Analysis. In addtion, this PPT design contains high resolution images, graphics, etc, that are easily editable and available for immediate download.
Procurement Steps Ppt PowerPoint Presentation Icon Objects
This is a procurement steps ppt powerpoint presentation icon objects. This is a six stage process. The stages in this process are understanding your goals, data analysis, beginning the pricing process, manage the pricing process, execution.

Investment Management And Administration Sample Diagram Ppt Ideas
This is a investment management and administration sample diagram ppt ideas. This is a ten stage process. The stages in this process are investment analysis, portfolio and blend construction, transition management, execution, risk control, corporation actions, custody and fees, performance reporting, web reporting data feed, portfolio updates, investment management and administration.

Procurement Steps Ppt PowerPoint Presentation Slides Templates
This is a procurement steps ppt powerpoint presentation slides templates. This is a six stage process. The stages in this process are understanding your goals, data analysis, beginning the pricing process, manage the pricing process, execution, continuing service.
Market Trends Chart With Percentage And Icons Powerpoint Slides
This PowerPoint template has been designed with graphics of chart with percentage values and icons. This PowerPoint template may be used to market trends and financial analysis. Prove the viability of your ideas using this impressive slide.
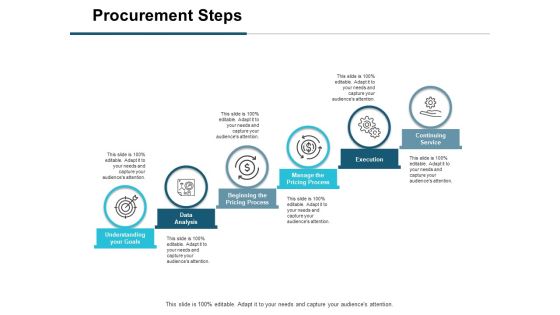
Procurement Steps Ppt PowerPoint Presentation Visual Aids Portfolio
This is a procurement steps ppt powerpoint presentation visual aids portfolio. This is a six stage process. The stages in this process are understanding your goals, data analysis, beginning pricing process, manage pricing process, execution.
Three Text Boxes With Percentage Values And Icons Powerpoint Slides
This PowerPoint template has been designed with text boxes and percentage data. You may download this PPT slide to display data comparison and analysis. Add this slide to your presentation and impress your superiors.
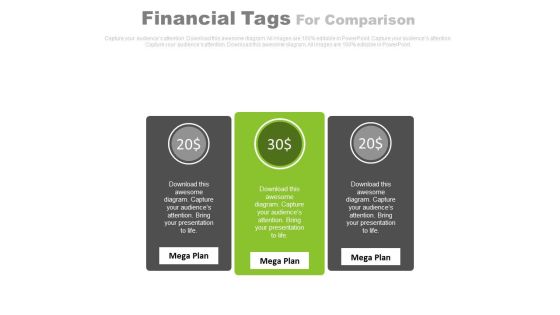
Three Text Tags Compare Chart Powerpoint Slides
This PowerPoint template has been designed with text tags and percentage data. You may download this PPT slide to display data comparison and analysis. Add this slide to your presentation and impress your superiors.

Hedge Funds Performance Contribution Ppt PowerPoint Presentation Infographic Template Visual Aids
This is a hedge funds performance contribution ppt powerpoint presentation infographic template visual aids. This is a five stage process. The stages in this process are business, management, strategy, analysis, marketing.

Energy Administration Flowchart Diagram Presentation Visuals
This is a energy administration flowchart diagram presentation visuals. This is a five stage process. The stages in this process are inventory, measurement, data analysis, assessment of funding, implication.
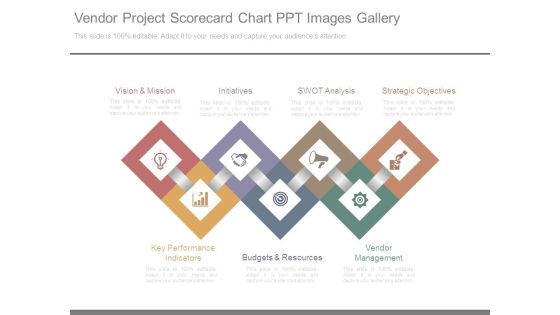
Vendor Project Scorecard Chart Ppt Images Gallery
This is a vendor project scorecard chart ppt images gallery. This is a seven stage process. The stages in this process are vision and mission, initiatives, swot analysis, strategic objectives, vendor management, budgets and resources, key performance indicators.

Customer Touch Points Powerpoint Presentation Examples
This is a customer touch points powerpoint presentation examples. This is a four stage process. The stages in this process are customer touch points, social media, big data analysis, tariffs and pricing.

Data Map Tools Comparative Assessment Ppt PowerPoint Presentation Gallery Influencers PDF
This slide showcases different data inventory tools. It provides information about reporting, dashboard, collaboration, data flows, compliance reports, insights, risk monitoring, project management, production, deploying costs, etc. Showcasing this set of slides titled Data Map Tools Comparative Assessment Ppt PowerPoint Presentation Gallery Influencers PDF. The topics addressed in these templates are Overall Ratings, Industries Ideal, Pricing. All the content presented in this PPT design is completely editable. Download it and make adjustments in color, background, font etc. as per your unique business setting.

Organizational Effectiveness Model Powerpoint Slide Presentation
This is a organizational effectiveness model powerpoint slide presentation. This is a six stage process. The stages in this process are leadership, strategic planning, structure, human resources, business processes, data analysis, customer service and performance results.

Cash Flow Statement Kpis Tabular Form Ppt PowerPoint Presentation Styles Design Inspiration
This is a cash flow statement kpis tabular form ppt powerpoint presentation styles design inspiration. This is a four stage process. The stages in this process are finance, analysis, management, business, marketing.

Balance Sheet Kpis Template 3 Ppt PowerPoint Presentation Infographic Template Demonstration
This is a balance sheet kpis template 3 ppt powerpoint presentation infographic template demonstration. This is a four stage process. The stages in this process are balance sheet, finance, marketing, strategy, analysis.

Curve Line Diagram With Icons Powerpoint Template
Our above slide contains diagram of curve line infographic. This infographic slide helps to exhibit business analysis. Use this diagram to impart more clarity to data and to create more sound impact on viewers.

Project Estimate Your Investment For Project Quote Proposal Ppt Portfolio Files PDF
Presenting this set of slides with name project estimate your investment for project quote proposal ppt portfolio files pdf. The topics discussed in these slides are data mining, analysis, report compilation, research, price. This is a completely editable PowerPoint presentation and is available for immediate download. Download now and impress your audience.

Balance Sheet Kpis Template 1 Ppt PowerPoint Presentation Infographic Template Example 2015
This is a balance sheet kpis template 1 ppt powerpoint presentation infographic template example 2015. This is a four stage process. The stages in this process are balance sheet, finance, marketing, strategy, analysis.

Balance Sheet Kpis Template 2 Ppt PowerPoint Presentation Outline Graphics Pictures
This is a balance sheet kpis template 2 ppt powerpoint presentation outline graphics pictures. This is a four stage process. The stages in this process are balance sheet, finance, marketing, strategy, analysis.

Circles With Percentage Values Powerpoint Templates
This PowerPoint template displays circles with percentage values. This business diagram is suitable for financial data analysis. Use this business diagram slide to highlight the key issues of your presentation.
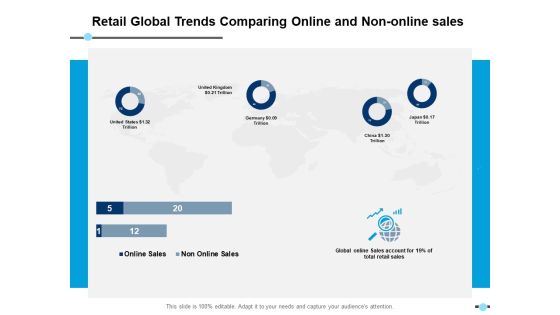
Retail Global Trends Comparing Online And Non Online Sales Donut Ppt PowerPoint Presentation Infographic Template Images
This is a retail global trends comparing online and non online sales donut ppt powerpoint presentation infographic template images. This is a four stage process. The stages in this process are finance, strategy, analysis, marketing.

Data Analytics IT Timeline For Data Science Implementation In The Organization Ppt Portfolio Icons PDF
This slide represents the timeline for the data science projects and a list of tasks performed each month, from training to work on projects. This is a data analytics it timeline for data science implementation in the organization ppt portfolio icons pdf template with various stages. Focus and dispense information on four stages using this creative set, that comes with editable features. It contains large content boxes to add your information on topics like exploratory analysis, final analysis, data cleaning, conditioning and transformation, data gathering from different resources. You can also showcase facts, figures, and other relevant content using this PPT layout. Grab it now.
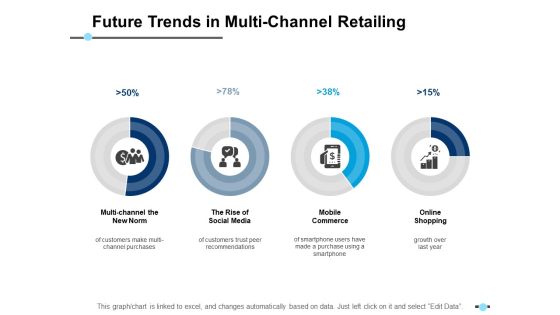
Future Trends In Multi Channel Retailing Multi Channel The New Norm Ppt PowerPoint Presentation Pictures Background Images
This is a future trends in multi channel retailing multi channel the new norm ppt powerpoint presentation pictures background images. This is a four stage process. The stages in this process are finance, management, strategy, analysis, marketing.

Sales Rep Performance Scorecard Ppt PowerPoint Presentation Infographic Template Master Slide
This is a sales rep performance scorecard ppt powerpoint presentation infographic template master slide. This is a four stage process. The stages in this process are overall territory performance, finance, analysis, marketing, business.

Compare Work Performance In Ppt PowerPoint Presentation Infographic Template Graphics Template
This is a compare work performance in ppt powerpoint presentation infographic template graphics template. This is a two stage process. The stages in this process are business, management, finance, marketing, strategy, analysis, compare.

Content Marketing Performance Template 1 Ppt PowerPoint Presentation Infographic Template Brochure
This is a content marketing performance template 1 ppt powerpoint presentation infographic template brochure. This is a eight stage process. The stages in this process are business, finance, marketing, strategy, analysis.
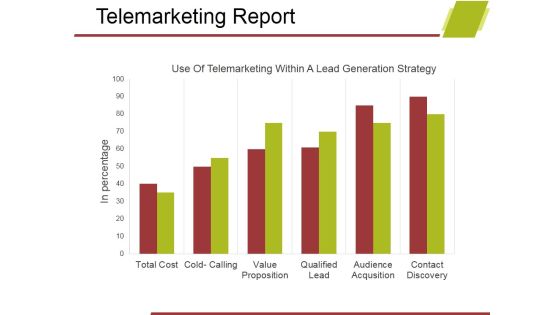
Telemarketing Report Template 1 Ppt PowerPoint Presentation Show Design Ideas
This is a telemarketing report template 1 ppt powerpoint presentation show design ideas. This is a six stage process. The stages in this process are business, bar graph, marketing, analysis, growth, strategy.

Table Of Content Template 2 Ppt PowerPoint Presentation Infographics Professional
This is a table of content template 2 ppt powerpoint presentation infographics professional. This is a six stage process. The stages in this process are financial performance, client and project updates, competitors analysis, future roadmap, csr miscellaneous activities.
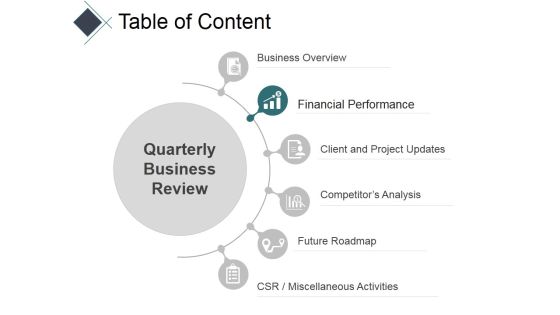
Table Of Content Template 1 Ppt PowerPoint Presentation Infographics Display
This is a table of content template 1 ppt powerpoint presentation infographics display. This is a six stage process. The stages in this process are business overview, financial performance, client and project updates, competitors analysis, future roadmap.

Table Of Content Template 4 Ppt PowerPoint Presentation Infographic Template
This is a table of content template 4 ppt powerpoint presentation infographic template. This is a six stage process. The stages in this process are business overview, financial performance, client and project updates, competitor s analysis, future roadmap.

Table Of Content Template 7 Ppt PowerPoint Presentation Professional Infographics
This is a table of content template 7 ppt powerpoint presentation professional infographics. This is a six stage process. The stages in this process are business overview, financial performance, client and project updates, competitor s analysis, future roadmap.

Business Financial Growth Ppt Powerpoint Graphics
This is a business financial growth ppt powerpoint graphics. This is a five stage process. The stages in this process are financial growth, investment, reporting, growth, security and analysis.
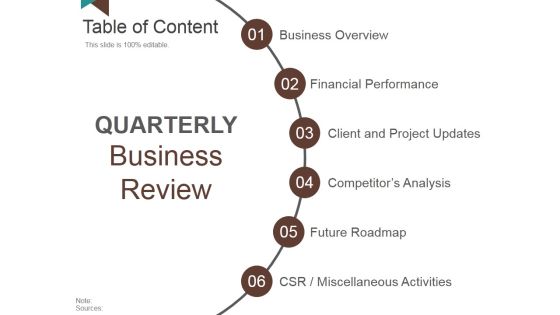
Table Of Content Template 7 Ppt PowerPoint Presentation Infographic Template Gridlines
This is a table of content template 7 ppt powerpoint presentation infographic template gridlines. This is a six stage process. The stages in this process are financial performance, client and project updates, competitors analysis, future roadmap, csr miscellaneous activities.
Project Conclusion Ppt PowerPoint Presentation Infographic Template Deck
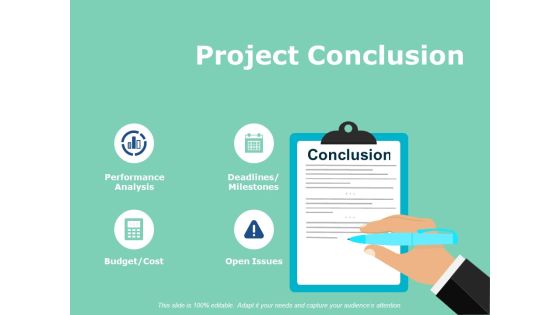
This is a project conclusion ppt powerpoint presentation infographic template deck. This is a four stage process. The stages in this process are Performance Analysis, Open Issues, Budget, Deadlines, Milestones.
Job Estimate Your Investment For Job Quote Proposal Ppt Slides Visuals PDF
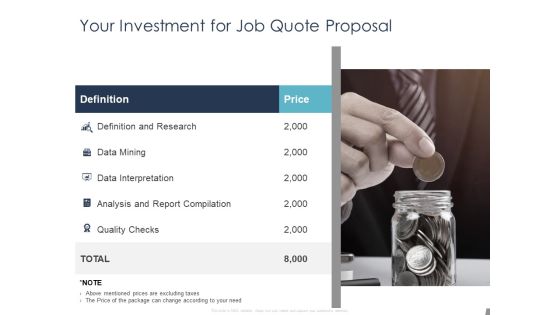
Presenting this set of slides with name job estimate your investment for job quote proposal ppt slides visuals pdf. The topics discussed in these slides are data mining, analysis, report compilation, research, quality. This is a completely editable PowerPoint presentation and is available for immediate download. Download now and impress your audience.
Milestones For The Next Reporting Period Template 2 Ppt PowerPoint Presentation Infographic Template Outfit
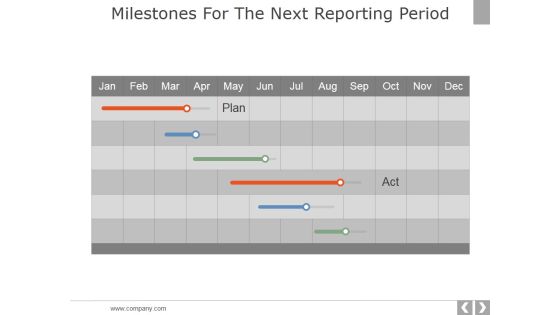
This is a milestones for the next reporting period template 2 ppt powerpoint presentation infographic template outfit. This is a six stage process. The stages in this process are business, strategy, marketing, analysis, compare.
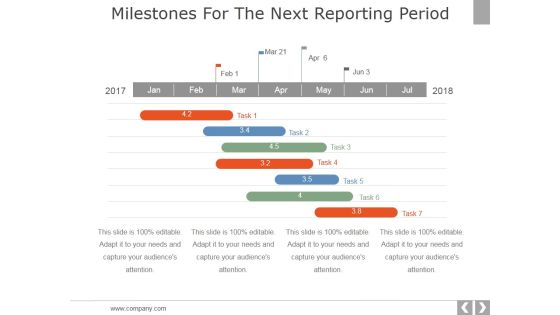
Milestones For The Next Reporting Period Template 3 Ppt PowerPoint Presentation Outline Outfit
This is a milestones for the next reporting period template 3 ppt powerpoint presentation outline outfit. This is a seven stage process. The stages in this process are business, strategy, marketing, analysis, location, time management.
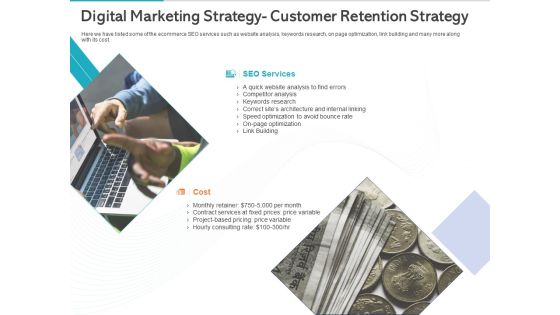
Gym Health And Fitness Market Industry Report Digital Marketing Strategy Customer Retention Strategy Ppt Ideas Picture PDF
Presenting this set of slides with name gym health and fitness market industry report digital marketing strategy customer retention strategy ppt ideas picture pdf. This is a two stage process. The stages in this process are seo services, ceo, competitor analysis, optimization, price variable, website analysis. This is a completely editable PowerPoint presentation and is available for immediate download. Download now and impress your audience.

Barriers In Implementation Of Integrating Iiot Infographics PDF
This slide covers top 5 challenges companies face in implementing phase of IIOT. It includes key barriers such as connectivity, data analysis, skill gaps, financing problems and security issues. Presenting Barriers In Implementation Of Integrating Iiot Infographics PDF to dispense important information. This template comprises five stages. It also presents valuable insights into the topics including Data Analysis, Connectivity, Financing. This is a completely customizable PowerPoint theme that can be put to use immediately. So, download it and address the topic impactfully.

Development Procedure To Summarize Expense Information Ppt Layouts Sample PDF
The following slide showcases budget development process to summarize data. The steps include revenue transferred, budget analysis, data compilation and budget presented for approval. Persuade your audience using this Development Procedure To Summarize Expense Information Ppt Layouts Sample PDF. This PPT design covers five stages, thus making it a great tool to use. It also caters to a variety of topics including Revenue Transfer, Budget Analysis, Data Compilation. Download this PPT design now to present a convincing pitch that not only emphasizes the topic but also showcases your presentation skills.

Pandl Kpis Investment Ppt PowerPoint Presentation Slides Background Designs
Presenting this set of slides with name pandl kpis investment ppt powerpoint presentation slides background designs. The topics discussed in these slides are financial, marketing, management, investment, analysis. This is a completely editable PowerPoint presentation and is available for immediate download. Download now and impress your audience.

Venture Capital Business Plan Powerpoint Slide Backgrounds
This is a venture capital business plan powerpoint slide backgrounds. This is a seven stage process. The stages in this process are business model, marketing planning, team building, development strategy, trend analysis, personal resources, market research.

5 Types Of Data Analytics Required In Insurance Sector Background PDF
This slide showcases need of data analytics for insurance personnels. Key requirements areas highlighted here are customer acquisition, product pricing, risk analysis, claim management and operations. Presenting 5 Types Of Data Analytics Required In Insurance Sector Background PDF to dispense important information. This template comprises five stages. It also presents valuable insights into the topics including Risk Analysis, Product Pricing, Customer Acquisition. This is a completely customizable PowerPoint theme that can be put to use immediately. So, download it and address the topic impactfully.

Advertising On Youtube Platform Table Of Contents Introduction PDF
This is a advertising on youtube platform table of contents introduction pdf template with various stages. Focus and dispense information on seven stages using this creative set, that comes with editable features. It contains large content boxes to add your information on topics like strategy, marketing, campaign analytics, dashboard, costs. You can also showcase facts, figures, and other relevant content using this PPT layout. Grab it now.
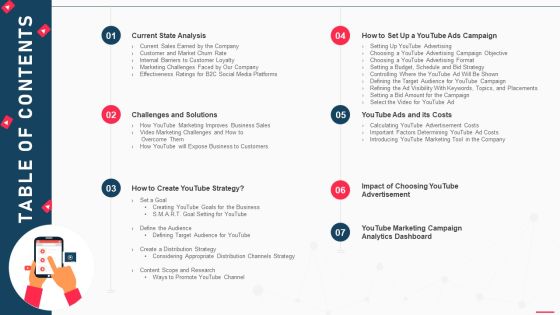
How To Promote Business Using Youtube Marketing Table Of Contents Elements PDF
This is a how to promote business using youtube marketing table of contents elements pdf template with various stages. Focus and dispense information on seven stages using this creative set, that comes with editable features. It contains large content boxes to add your information on topics like strategy, marketing, campaign analytics, dashboard, costs. You can also showcase facts, figures, and other relevant content using this PPT layout. Grab it now.
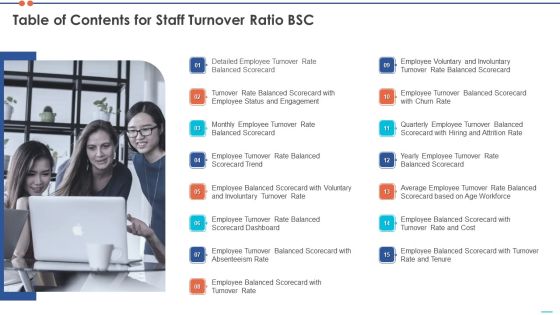
Table Of Contents For Staff Turnover Ratio BSC Portrait PDF
This is a table of contents for staff turnover ratio bsc portrait pdf template with various stages. Focus and dispense information on fifteen stages using this creative set, that comes with editable features. It contains large content boxes to add your information on topics like tenure, cost, workforce, dashboard, involuntary. You can also showcase facts, figures, and other relevant content using this PPT layout. Grab it now.
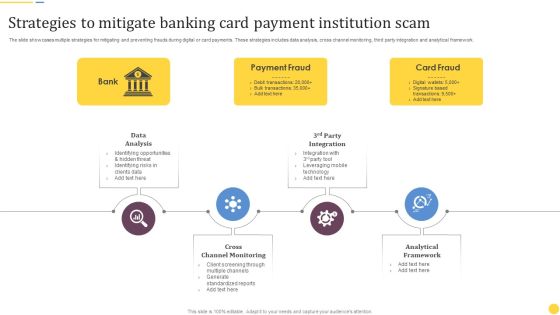
Strategies To Mitigate Banking Card Payment Institution Scam Background PDF
The slide showcases multiple strategies for mitigating and preventing frauds during digital or card payments. These strategies includes data analysis, cross channel monitoring, third party integration and analytical framework. Persuade your audience using this Strategies To Mitigate Banking Card Payment Institution Scam Background PDF. This PPT design covers four stages, thus making it a great tool to use. It also caters to a variety of topics including Bank, Payment Fraud, Card Fraud, Data Analysis. Download this PPT design now to present a convincing pitch that not only emphasizes the topic but also showcases your presentation skills

Strategic Guide To Launch New Product In Market Determine Suitable Product Management Solution Infographics PDF
This slide provides information regarding selection of suitable product management solution by analyzing on various parameters such as user tracking analysis, data management sharing, API integration along with cost. Deliver and pitch your topic in the best possible manner with this strategic guide to launch new product in market determine suitable product management solution infographics pdf Use them to share invaluable insights on coordination among team, members with data sharing, along product management cycle and impress your audience. This template can be altered and modified as per your expectations. So, grab it now.
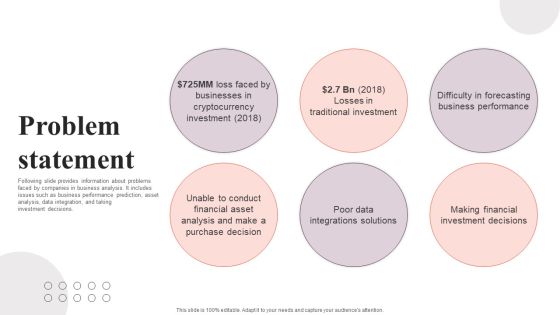
Financial Analytics Solution Investor Funding Elevator Pitch Deck Problem Statement Formats PDF
Following slide provides information about problems faced by companies in business analysis. It includes issues such as business performance prediction, asset analysis, data integration, and taking investment decisions. Make sure to capture your audiences attention in your business displays with our gratis customizable Financial Analytics Solution Investor Funding Elevator Pitch Deck Problem Statement Formats PDF. These are great for business strategies, office conferences, capital raising or task suggestions. If you desire to acquire more customers for your tech business and ensure they stay satisfied, create your own sales presentation with these plain slides.
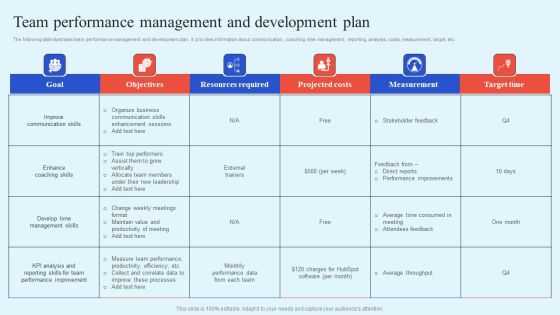
How Leaders Can Improve Team Effectiveness Team Performance Management And Development Plan Infographics PDF
The following slide illustrates team performance management and development plan. It provides information about communication, coaching, time management, reporting, analysis, costs, measurement, target, etc. Stand out from the crowd with our dynamic How Leaders Can Improve Team Effectiveness Team Performance Management And Development Plan Infographics PDF template. Designed to help you make a statement, this single-slide PPT template is fully customizable to suit your unique needs. With eye-catching visuals and seamless editing options, you can create impactful presentations in minutes. Say goodbye to boring slides and unlock your presentation potential with our top-notch template.
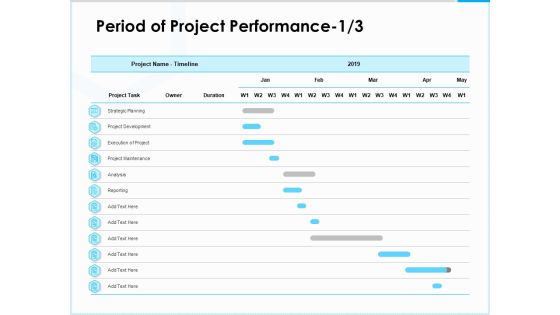
Project Budget Period Of Project Performance Timeline Ppt PowerPoint Presentation Infographic Template Aids PDF
Deliver an awe-inspiring pitch with this creative project budget period of project performance timeline ppt powerpoint presentation infographic template aids pdf bundle. Topics like strategic planning, project development, analysis, project execution, data maintenance, reporting can be discussed with this completely editable template. It is available for immediate download depending on the needs and requirements of the user.

Percentage Data Growth Chart Powerpoint Slides
This PowerPoint template has been designed with percentage data growth chart. Download this PPT chart to depict financial ratio analysis. This PowerPoint slide is of great help in the business sector to make realistic presentations and provides effective way of presenting your newer thoughts.
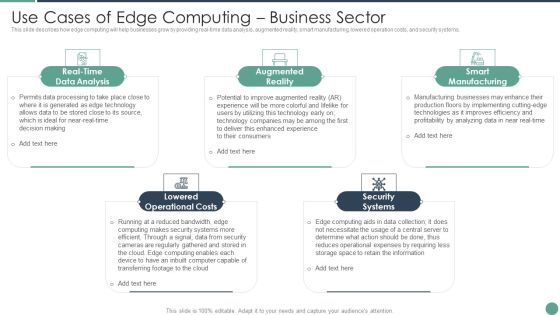
Distributed Computing Use Cases Of Edge Computing Business Sector Themes PDF
This slide describes how edge computing will help businesses grow by providing real-time data analysis, augmented reality, smart manufacturing, lowered operation costs, and security systems.This is a Distributed Computing Use Cases Of Edge Computing Business Sector Themes PDF template with various stages. Focus and dispense information on five stages using this creative set, that comes with editable features. It contains large content boxes to add your information on topics like Augmented Reality, Smart Manufacturing, Security Systems You can also showcase facts, figures, and other relevant content using this PPT layout. Grab it now.

New Website Launch Strategy Website Analytics Software Solution Pricing Plan Microsoft PDF
Mentioned slide provides information about multiple pricing plans offered by selected web analytical software which can be leveraged by businesses for making strategic improvements. It includes key features such as workplace analysis, automated reports, segment comparison, dashboard, voice assistance, privacy, etc. The New Website Launch Strategy Website Analytics Software Solution Pricing Plan Microsoft PDF is a compilation of the most recent design trends as a series of slides. It is suitable for any subject or industry presentation, containing attractive visuals and photo spots for businesses to clearly express their messages. This template contains a variety of slides for the user to input data, such as structures to contrast two elements, bullet points, and slides for written information. Slidegeeks is prepared to create an impression.

Two Month E-Commerce Marketing Plan Schedule Infographics PDF
The following slide showcases the two month timeline plan for e-commerce marketing. Key stages included in the plan are product selection for e-commerce marketing, develop marketing goals, market analysis, product listing activity, campaigning etc. Persuade your audience using this Two Month E-Commerce Marketing Plan Schedule Infographics PDF. This PPT design covers Nine stages, thus making it a great tool to use. It also caters to a variety of topics including Product Selection, Perform Market Analysis, Run Campaigns. Download this PPT design now to present a convincing pitch that not only emphasizes the topic but also showcases your presentation skills.

Data Collection Techniques For Client Case Study Observations Ppt PowerPoint Presentation Ideas Demonstration
Presenting this set of slides with name data collection techniques for client case study observations ppt powerpoint presentation ideas demonstration. This is a six stage process. The stages in this process are finance, marketing, management, investment, analysis. This is a completely editable PowerPoint presentation and is available for immediate download. Download now and impress your audience.

 Home
Home